Publisher’s version / Version de l'éditeur:
Vous avez des questions? Nous pouvons vous aider. Pour communiquer directement avec un auteur, consultez la première page de la revue dans laquelle son article a été publié afin de trouver ses coordonnées. Si vous n’arrivez Questions? Contact the NRC Publications Archive team at
PublicationsArchive-ArchivesPublications@nrc-cnrc.gc.ca. If you wish to email the authors directly, please see the first page of the publication for their contact information.
https://publications-cnrc.canada.ca/fra/droits
L’accès à ce site Web et l’utilisation de son contenu sont assujettis aux conditions présentées dans le site LISEZ CES CONDITIONS ATTENTIVEMENT AVANT D’UTILISER CE SITE WEB.
Technical Report (National Research Council of Canada. Institute for Ocean Technology); no. TR-2006-01, 2006
READ THESE TERMS AND CONDITIONS CAREFULLY BEFORE USING THIS WEBSITE.
https://nrc-publications.canada.ca/eng/copyright
NRC Publications Archive Record / Notice des Archives des publications du CNRC :
https://nrc-publications.canada.ca/eng/view/object/?id=af1c6aec-410b-4bc0-8b9c-72f4e80cfdda https://publications-cnrc.canada.ca/fra/voir/objet/?id=af1c6aec-410b-4bc0-8b9c-72f4e80cfdda
NRC Publications Archive
Archives des publications du CNRC
For the publisher’s version, please access the DOI link below./ Pour consulter la version de l’éditeur, utilisez le lien DOI ci-dessous.
https://doi.org/10.4224/8894990
Access and use of this website and the material on it are subject to the Terms and Conditions set forth at
An empirical method for the estimation of resistance of a life raft in various sea states
DOCUMENTATION PAGE
REPORT NUMBER
TR-2006-01
NRC REPORT NUMBER DATE
April 2006
REPORT SECURITY CLASSIFICATION
Unclassified
DISTRIBUTION
Unlimited
TITLE
AN EMPIRICAL METHOD FOR THE ESTIMATION OF TOWING RESISTANCE OF A LIFE RAFT IN VARIOUS SEA STATES
AUTHOR(S)
L. M. Mak, A. Kuczora and A. Simões Ré
CORPORATE AUTHOR(S)/PERFORMING AGENCY(S)
Institute for Ocean Technology, National Research Council, St. John’s, NL
PUBLICATION
SPONSORING AGENCY(S)
Institute for Ocean Technology, National Research Council, St. John’s, NL
IMD PROJECT NUMBER
2064
NRC FILE NUMBER KEY WORDS
Life raft, tow, force, waves, wind
PAGES v, 41, App. A-C FIGS. 16 TABLES 20 SUMMARY
Current IMO regulations require life rafts to be tow tested only in calm water. In real evacuation situations, life rafts are deployed in the prevailing environmental conditions, with wind and waves. Added wave resistance is small at low wave heights but increases non-linearly with increased wave height. If life rafts are to be towed in moderate seas (up to 4 m significant wave height), tow force estimates based only on calm water tow resistance become less reliable. Tow patches, towline, towing craft etc. also need to be designed to withstand dynamic wave loading in addition to mean load. Therefore, mean tow force, tow force variation and maximum tow force are important.
A full-scale 16-person, commercially available, SOLAS approved life raft was towed in the tank, in upwind, head seas with significant wave height of 0.5 m. The measured tow force showed that it could be treated as a linear system with wave amplitude, by demonstrating that tow force is mainly inertial and follows a Rayleigh distribution. Therefore, extreme-value statistics used for waves can be applied to developing equations for predicting tow force.
A methodology is proposed to predict life raft tow force at different tow speeds and in various sea states, with waves and wind. The methodology involved using tank experiments to obtain tow force response for one sea state. The information can then be used to predict life raft tow force in wind and waves for different sea states.
Three equations are proposed to demonstrate that a simple tank experiment could provide valuable information necessary to empirically estimate the mean tow force, tow force variation and maximum tow force for a specific life raft in different sea states. The equations are developed for upwind, head seas.
These equations were extensively validated using tow force measured in the tank. They were partially validated with limited sea trial data, by towing the same 16-person life raft and a 42-person life raft in upwind, head seas with significant wave height of 1.3 m. The equations were able to predict maximum tow forces to within 15% of the measured.
ADDRESS National Research Council
Institute for Ocean Technology Arctic Avenue, P. O. Box 12093 St. John's, NL A1B 3T5
National Research Council Conseil national de recherches Canada Canada Institute for Ocean Institut des technologies
Technology océaniques
AN EMPIRICAL METHOD FOR THE ESTIMATION OF TOWING
RESISTANCE OF A LIFE RAFT IN VARIOUS SEA STATES
TR-2006-01
L. M. Mak, A. Kuczora and A. Simões Ré
TABLE OF CONTENTS
SUMMARY ... 1
1.0 INTRODUCTION... 2
2.0 PROJECT OBJECTIVES, SCOPE AND LIMITATION ... 4
3.0 PROPOSED METHODOLOGY AND FORMULAE... 6
4.0 RESULTS AND DISCUSSION ... 9
4.1 TOW FORCE DISTRIBUTION AND SHORT-TERM RESPONSE STATISTICS... 9
4.2 DEVELOPMENT OF MEAN TOW FORCE EQUATION... 12
4.2.1 Life Raft Calm Water Resistance ... 12
4.2.2 Life Raft Added Resistance in Waves... 13
4.2.3 Life Raft Added Resistance in Wind... 14
4.3 VALIDATION OF MEAN TOW FORCE EQUATION WITH TOW TANK DATA... 15
4.4 VALIDATION OF SIGNIFICANT TOW FORCE EQUATION WITH TOW TANK DATA... 18
4.5 DEVELOPMENT OF MAXIMUM TOW FORCE EQUATION... 20
4.6 VALIDATION OF MAXIMUM TOW FORCE EQUATION WITH TOW TANK DATA... 23
4.7 APPLYING THE EQUATIONS TO SEA TRIAL DATA... 24
4.7.1 Towing a 16-person Life Raft by a Fast Rescue Craft... 25
4.7.1.1 Comparison of Predicted and Measured Mean Tow Force ... 25
4.7.1.2 Comparison of Predicted and Measured Significant Tow Force ... 27
4.7.1.3 Comparison of Predicted and Measured Maximum Tow Force ... 28
4.7.2 Towing a 42-person Life Raft by a Fast Rescue Craft and by a Large Vessel 29 4.8NEED FOR MODEL TEST... 32
4.9 PREDICTING MEAN TOW FORCE IN MODERATE SEAS... 33
5.0 CONCLUSIONS ... 38
6.0 RECOMMENDATIONS... 40
7.0 REFERENCES... 41
Appendix A Tow Force Height Probability Density and Cumulative Distribution Appendix B Typical AMEC Forecast
LIST OF FIGURES
Figure 1. Tow force, tow force height probability density and cumulative distribution Figure 2. Calm water resistance of various life raft configurations at different tow
speed
Figure 3. Calm water resistance of drogue at different tow speed
Figure 4. The measured tow force response function, RAW/ζa2, at 2 knots with a
smoothing spline
Figure 5. Effect of ballast type on mean tow force, Case E and F, 2 knots. Figure 6. Life raft plowing through waves when towed at high speed Figure 7. Typical Tow force time series at 1-knot (Case B)
Figure 8. Average measured wave spectra in June 2005
Figure 9. Variation in measured and AMEC forecasted significant wave height in July
Figure 10. Measured tow force with the 42-person life raft towed by a Fast Rescue Craft and by a large vessel, MV Lauzier (2 knots)
Figure 11. Measured tow force with the 42-person life raft towed by a Fast Rescue Craft and by a large vessel, MV Lauzier (3 knots)
Figure 12. Measured tow force with the 42-person life raft towed by a Fast Rescue Craft (2 knots)
Figure 13. Full-scale Pierson-Moskowitz wave spectra
Figure 14. Contributing mean tow resistance components, Lake Ontario, 1 and 2 knots Figure 15. Contributing mean tow resistance components, Pacific Coast, 1 and 2 knots Figure 16. Contributing mean tow resistance components, Grand Banks, 1 and 2 knots
LIST OF TABLES
Table 1. Test matrix
Table 2. Keulegan-Carpenter number for 16-person life raft Table 3. Keulegan-Carpenter number for 42-person life raft
Table 4. Comparison of measured and predicted mean tow force in irregular waves in towing tank (1 knots tow speed; significant wave height 0.5 m)
Table 5. Comparison of measured and predicted mean tow force in irregular waves in towing tank (2 knots tow speed; significant wave height 0.5 m)
Table 6. Comparison of measured and predicted mean tow force in irregular waves in towing tank (3 knots tow speed; significant wave height 0.5 m)
Table 7. Comparison of measured and predicted significant tow force in irregular waves in towing tank (1 knot tow speed; significant wave height 0.5 m) Table 8. Comparison of measured and predicted significant tow force in irregular
waves in towing tank (2 knots tow speed; significant wave height 0.5 m) Table 9. Comparison of measured and predicted significant tow force in irregular waves in towing tank (3 knots tow speed; significant wave height 0.5 m) Table 10. Cwaves factor
Table 11. Skewness factor
Table 12. Comparison of predicted and measured maximum tow force in irregular waves in towing tank (1 knot tow speed; significant wave height 0.5 m) Table 13. Comparison of predicted and measured maximum tow force in irregular
waves in towing tank (2 knots tow speed; significant wave height 0.5 m) Table 14. Comparison of predicted and measured maximum tow force in irregular
waves in towing tank (3 knots tow speed; significant wave height 0.5 m) Table 15. Comparison of measured and predicted mean tow force in sea trial
(16-person raft towed at 2 knots by Fast Rescue Craft; significant wave height 1.3 m)
Table 16. Comparison of measured and predicted significant tow force in sea trial (16-person raft towed at 2 knots by Fast Rescue Craft; significant wave height 1.3 m)
Table 17. Comparison of measured and predicted maximum tow force in sea trial (16-person raft towed at 2 knots by Fast Rescue Craft; significant wave height 1.3 m)
Table 18. 42-person life raft tow tests at sea
Table 19. Comparison of measured and predicted maximum tow force in sea trial (42-person raft towed at 2 knots by Fast Rescue Craft and by large vessel) Table 20. Regional distribution of JONSWAP peak enhancement factor, γ
Summary
Current IMO regulations require life rafts to be tow tested only in calm water. In real evacuation situations, life rafts are deployed in the prevailing environmental conditions, with wind and waves. Added wave resistance is small at low wave heights but increases non-linearly with increased wave height. If life rafts are to be towed in moderate seas (up to 4 m significant wave height), tow force estimates based only on calm water tow resistance become less reliable. Tow patches, towline, towing craft etc. also need to be designed to withstand dynamic wave loading in addition to mean load. Therefore, mean tow force, tow force variation and maximum tow force are important.
A full-scale 16-person, commercially available, SOLAS approved life raft was towed in the tank, in upwind, head seas with significant wave height of 0.5 m. The measured tow force showed that it could be treated as a linear system with wave amplitude, by
demonstrating that tow force is mainly inertial and follows a Rayleigh distribution. Therefore, extreme-value statistics used for waves can be applied to developing equations for predicting tow force.
A methodology is proposed to predict life raft tow force at different tow speeds and in various sea states, with waves and wind. The methodology involved using tank
experiments to obtain tow force response for one sea state. The information can then be used to predict life raft tow force in wind and waves for different sea states.
Three equations are proposed to demonstrate that a simple tank experiment could provide valuable information necessary to empirically estimate the mean tow force, tow force variation and maximum tow force for a specific life raft in different sea states. The equations are developed for upwind, head seas.
These equations were extensively validated using tow force measured in the tank. They were partially validated with limited sea trial data, by towing the same 16-person life raft and a 42-person life raft in upwind, head seas with significant wave height of 1.3 m. The equations were able to predict maximum tow forces to within 15% of the measured.
1.0 Introduction
Inflatable life rafts are commonly used on oil installations, merchant ships, cruise ships, ferries, military vessels and small vessels for evacuation. Large passenger ships, such as ferries, are typically equipped with dedicated motor crafts to tow the life rafts to safety, away from hazards such as fires, explosions, collisions and sinking vessels.
Currently IMO regulations require life rafts to be tow tested only in calm water. However, in real evacuation situations, life rafts are deployed in the prevailing environmental conditions, with wind and waves. Literatures reviewed by Mak et el. (2005) indicated that both environmental variables and life raft variables affect life raft stability and motion. Therefore, it is important to assess life raft towing performance in waves and wind.
Furthermore, added resistance due to waves is small at low wave heights but increases non-linearly with increased wave height. If life rafts are to be towed in moderate seas (up to 4 m significant wave height), tow force estimates based only on calm water tow resistance become less reliable. Tow patches, towline, towing craft etc. also need to be designed to withstand the dynamic loads caused by the waves, in addition to the mean load. Therefore, information of mean tow force and tow force variation about its mean in various sea states is an important component to consider.
Some challenges in assessing the additional wind and wave forces at sea are the high costs, complexity and repeatability of sea trials, because the tests are not conducted in a controlled environment. The changing environmental conditions also make it difficult to systematically isolate and assess the effects of different variables on life raft towing. Moreover, to assess the tow motion and forces in different sea states, one must wait for the right environmental condition to conduct the tests. This typically requires different trial dates to collect a complete set of data. All these make sea trials relatively impractical and inefficient.
Currently, data on life raft towing performance in waves and wind is very limited. A comprehensive life raft tow test program composed of a full-scale tank test, a model-scale tank test and a sea trial was designed to address the knowledge gap. The combined data will provide needed information to address how different variables affect raft towing in realistic ocean environments, in which the life rafts must operate. Such information would be beneficial to marine operators, rescuers, life raft designers and training providers.
Mak et el. (2005, 2006) presented the results of tow tests of a full-scale life raft in waves, conducted in the tow tank of National Research Council Canada (NRC), Institute for Ocean Technology (IOT). The results indicated that:
The type of ballast used is very important. The tests demonstrated that manikin ballast results in higher mean tow force and tow force variation than water bag ballast. There was very good agreement between the comparison of life raft Response
amplitude operators (RAO) (in surge, heave, pitch and tow force variation) in regular and irregular waves. Irregular waves can be used effectively to determine the motion response RAOs of the life raft, without running individual regular waves.
Irregular waves mean tow force is 20% higher than that in calm water, for the
relatively mild sea condition tested (significant wave height 0.5 m), which is roughly equivalent to sea state 2 without wind.
Mean tow force and raft heave increase with floor inflation, drogue deployment, even weight distribution and increased tow speed. Floor inflation also increases tow force variation. Raft heave tends to decrease with tow speed.
Even weight distribution and drogue deployment increase raft surge, while floor inflation decreases raft surge.
The measured occupant heave acceleration (from instrumented manikin) was about the same as the measured raft heave acceleration, indicating that the occupants would experience similar heave motions to those of the raft heave.
The motion sickness dose value predicts that 20% of occupants would vomit after 20 hours in the life raft, for the relatively mild sea state tested (significant wave height = 0.5 m). The percentage of occupants vomiting is slightly lower at high tow speed. Further advancement of this work to develop and validate a test methodology, which can be applied to different life rafts, to estimate the tow force in different sea states, is presented in this report.
2.0 Project Objectives, Scope and Limitation
The overall objectives of this project are:
1. To design a methodology that can be applied to different life rafts, to predict tow force at different tow speed and in various sea states, with waves and wind. 2. To validate the methodology and to prove the concept, using the data measured in
towing a full-scale life raft in the tow tank and at sea.
3. To assess if added wave resistance and added wind resistance in moderate seas can increase the tow force significantly.
4. To propose formulae that will help regulators, training provides and manufacturers to determine the design load.
To achieve these objectives, the development is broken down into the following sub-tasks:
1. Develop a methodology to predict life raft tow force in various sea states, from low to moderate seas (up to 4 m significant wave height), accounting for both added
resistance due to wind and waves.
2. Empirically parameterize the tow force in calm water with respect to tow speed. 3. Assess the feasibility of using regular and irregular wave RAOs and other results
obtained in the tests in the tow tank, to predict added resistance due to waves. 4. Assess the added resistance due to wind.
5. Validate the methodology with tow force measured in towing a full-scale life raft in the tow tank and at sea.
6. Use the methodology to numerically assess the contribution of added wave resistance and added wind resistance to the total mean tow force, for different sea states. Assess the tow force variation and peak load. Determine if calm water tow force alone is a conservative estimate of the tow force in wind and waves.
7. Assess if the methodology can be generally applied to different life rafts.
The scope of the project will be limited to predicting tow force in low to moderate seas, where it is possible for a well trained and experienced crew to tow a life raft and where there might not be too many breaking waves to cause significant non-linear effects.
The measured tow force from towing a full-scale 16-person, commercially available SOLAS approved life raft, in a tow tank and at sea, are used in the present study to validate the methodology. The results of these tests are documented in Mak et al. (2005, 2006) and Simões Ré et al. (2006) respectively.
The test matrix for these tests is shown in Table 1. In the tow tank, the life raft was towed at 1, 2 and 3 knots, with both water bag ballast and manikin ballast. The spectrum used had a significant wave height of 0.5 m. At sea, the life raft was towed at various speeds, with water bag ballast only. The waves had various significant heights. Due to a
malfunction of the wave buoy, wave data was only available one week before the sea trial and no wave data was available during the sea trial.
Calm Water Regular Waves Irregu
la
r
Waves
Ballast Type
Case Weight Distribu
tion
Floor Inflation Drogue Manikins Bags Manikins Bags Manikins Bags
A Even Y Y Y Y Y Y Y B Even Y N Y Y Y C Even N N Y Y Y D Uneven Y N Y Y Y E Uneven N Y Y Y Y Y Y Y F Uneven N N Y Y Y Y Y Table 1. Test matrix
3.0 Proposed Methodology and Formulae
The proposed methodology to estimate life raft tow force in wind and waves is to use tank experiments to obtain tow force response for one sea state. This information will be used to formulate equations that can be applied to predict life raft tow force in wind and waves for different sea states. The justification and validation of this methodology is presented in Section 4.
Three formulae are proposed to demonstrate that a simple tank experiment, such as the one described in Mak et al. (2005, 2006), could provide valuable information necessary to empirically predict the mean tow force, tow force variation and maximum tow force for a specific life raft in different sea states. All formulae were developed for upwind, head seas, which we believe is potentially the worst-case scenario. These formulae predict towing by a large vessel. In Section 4, the difference between towing by a large vessel and a Rigid Hull Inflatable Boat (RIB) is discussed.
The first formula is used to predict mean tow force for different sea states. The tow resistance is expressed as the sum of calm water resistance, added wave resistance and added wind resistance. Calm water resistance is developed empirically using the tow data measured in the tow tank. The added wave resistance is estimated with the same method developed for large ships. The response function, RAW/ζa2, is computed from regular wave
tow test data in the tank (Bhattacharyya 1978). It is raft specific and tow speed
dependent. Added wind resistance is estimated for the raft with wind speed, tow speed, air density, projected area of the raft and drag coefficient (Lloyd 1989). In Sections 4.1 to 4.3, detailed discussion of the formulation of this equation, how it is applied and
comparison of predicted and measured data are presented.
A VV V C df f S f R V K C C K R R R F w w d e a AW Calm Drogue i w Calm Raft ce sis Wind Added ce sis Wave Added Calm mean ) 2 ( 5 . 0 ) ( ) ( 2 ) ( 2 2 2 tan Re tan Re + + + + = + + =
∫
ρ ζ (Equation 1) WhereFmean Mean tow force in irregular waves, head seas [N]
KRaft Calm Increase in calm water raft resistance per unit increase in tow
speed squared, for a raft with no drogue deployment, floor not inflated and uneven weight distribution [N/(m/s)2]
KDrogue Calm Increase in calm water drogue resistance per unit increase in tow
Cw Correction factor for weight distribution
Ci Correction factor for floor inflation
V Tow speed [m/s]
RAW Added resistance measured in regular wave tow tests [N]
ζ Regular wave amplitude [m]
Se(f) Encounter wave spectrum [m2/Hz]
Vw Wind velocity [m/s]
A Projected area of the raft [m2] ρ Density of air [kg/m3]
Cd Drag coefficient
The second formula is used to predict the significant or average of the one-third highest tow force variations about its mean, due to waves, for different sea states. In Section 4.4, a detailed discussion of this equation and comparison of measured and predicted data are presented. ) ( | ) ( | ) ( ) ( 4 ) ( 2 3 / 1 var f S f RAO f S df f S F e raft raft iation × = × =
∫
(Equation 2) Where(Fvariation)1/3 Significant or average of the one-third highest tow force variation
about its mean, head seas [N]
Sraft(f) Raft tow force variation response spectrum [N2/Hz]
RAO(f) Raft tow force variation response amplitude operator computed from irregular waves tow tests [N/m]
Se(f) Encounter wave spectrum [m2/Hz]
The third formula is used to predict the maximum tow force, using results obtained from Equations 1 and 2. In Sections 4.5 to 4.6, a detailed discussion of the formulation of this equation and comparison of measured and prediction data are presented.
] )
[( var 1/3
max Fmean F iation Cwaves Cskewness
F = + × × (Equation 3)
Where
Fmax Maximum tow force [N]
Fmean Mean tow force in irregular waves, head seas [N]
(Fvariation)1/3 Average of one-third highest tow force variation about its mean,
head seas [N]
height. In Section 4, tow force is shown to be a linear system with wave height.
Cskewness Skewness factor to account for the fact that tow force response is
unevenly distributed about its mean. If a response is symmetric about its mean, the skewness factor is
2 1
. A typical tow force response is asymmetric, with very sharp peak. A skewness factor of
3 2
4.0 Results and Discussion
4.1 Tow Force Distribution and Short-term Response Statistics
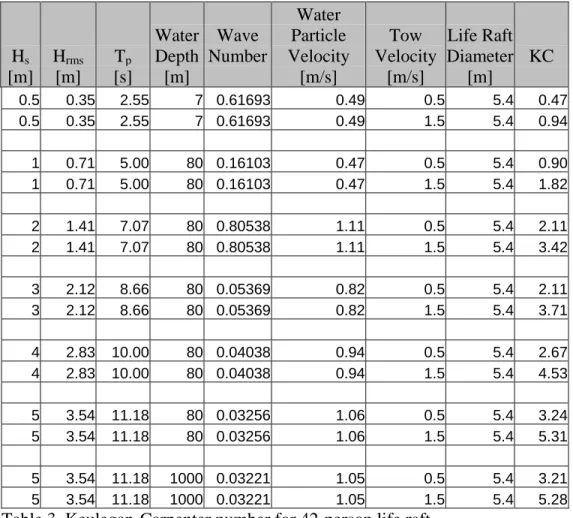
In formulating Equations 1, 2 and 3, it is assumed that the tow force response is linear with wave amplitude. Generally, inertial systems are linear and drag systems are non-linear (Chakrabarti, 1987). To show that the tow force response is mostly inertial, the Keulegan-Carpenter number, KC, (KC = UT/D) is computed for different wave height, wave period and water depth in Table 2 for a 16-person life raft. According to Sarpkaya and Isaacson (1981), when KC is smaller than 10, inertia force is more important. For larger rafts, such as a 42-person life raft, inertial force predominates even more as shown in Table 3.
Table 2. Keulegan-Carpenter number for 16-person life raft Hs [m] Hrms [m] Tp [s] Water Depth [m] Wave Number Water Particle Velocity [m/s] Tow Velocity [m/s] Life Raft Diameter [m] KC 0.5 0.35 2.55 7 0.61693 0.49 0.5 3.4 0.74 0.5 0.35 2.55 7 0.61693 0.49 1.5 3.4 1.49 1 0.71 5.00 80 0.16103 0.47 0.5 3.4 1.43 1 0.71 5.00 80 0.16103 0.47 1.5 3.4 2.90 2 1.41 7.07 80 0.80538 1.11 0.5 3.4 3.35 2 1.41 7.07 80 0.80538 1.11 1.5 3.4 5.43 3 2.12 8.66 80 0.05369 0.82 0.5 3.4 3.35 3 2.12 8.66 80 0.05369 0.82 1.5 3.4 5.90 4 2.83 10.00 80 0.04038 0.94 0.5 3.4 4.25 4 2.83 10.00 80 0.04038 0.94 1.5 3.4 7.19 5 3.54 11.18 80 0.03256 1.06 0.5 3.4 5.14 5 3.54 11.18 80 0.03256 1.06 1.5 3.4 8.43 5 3.54 11.18 1000 0.03221 1.05 0.5 3.4 5.10 5 3.54 11.18 1000 0.03221 1.05 1.5 3.4 8.39
Hs [m] Hrms [m] Tp [s] Water Depth [m] Wave Number Water Particle Velocity [m/s] Tow Velocity [m/s] Life Raft Diameter [m] KC 0.5 0.35 2.55 7 0.61693 0.49 0.5 5.4 0.47 0.5 0.35 2.55 7 0.61693 0.49 1.5 5.4 0.94 1 0.71 5.00 80 0.16103 0.47 0.5 5.4 0.90 1 0.71 5.00 80 0.16103 0.47 1.5 5.4 1.82 2 1.41 7.07 80 0.80538 1.11 0.5 5.4 2.11 2 1.41 7.07 80 0.80538 1.11 1.5 5.4 3.42 3 2.12 8.66 80 0.05369 0.82 0.5 5.4 2.11 3 2.12 8.66 80 0.05369 0.82 1.5 5.4 3.71 4 2.83 10.00 80 0.04038 0.94 0.5 5.4 2.67 4 2.83 10.00 80 0.04038 0.94 1.5 5.4 4.53 5 3.54 11.18 80 0.03256 1.06 0.5 5.4 3.24 5 3.54 11.18 80 0.03256 1.06 1.5 5.4 5.31 5 3.54 11.18 1000 0.03221 1.05 0.5 5.4 3.21 5 3.54 11.18 1000 0.03221 1.05 1.5 5.4 5.28
Table 3. Keulegan-Carpenter number for 42-person life raft
Also, under the assumption that the wave spectrum is narrow banded and force is mainly inertial, it can be shown that the force amplitudes follow the Rayleigh distribution. If Rayleigh distribution applies to the force amplitudes, then all of the extreme-value statistics shown for the waves are equally applicable to the force (Chakrabarti, 1987 and Lloyd, 1989).
Figure 1 shows (a) a typical time series of measured tow force at 2 knots, (b) a plot of probability density histogram with a fitted Rayleigh probability density function, and (c) a plot of the cumulative distribution function obtained by integrating the probability density histogram (CDH) with the cumulative distribution function of the fitted Rayleigh distribution (CDF). The Rayleigh density function and the corresponding cumulative probability are expressed as follows:
⎥ ⎥ ⎦ ⎤ ⎢ ⎢ ⎣ ⎡ ⎟ ⎠ ⎞ ⎜ ⎝ ⎛ − ⎟ ⎠ ⎞ ⎜ ⎝ ⎛ = 2 2 2 ) ( A x e A x x p (Equation 4) ⎥ ⎥ ⎦ ⎤ ⎢ ⎢ ⎣ ⎡ ⎟ ⎠ ⎞ ⎜ ⎝ ⎛ − − = 2 1 ) ( A x e x P (Equation 5) where x A µ π ⎟⎠ ⎞ ⎜ ⎝ ⎛ = 2
µx = mean value of x and may be considered as distance to the centroid of the
probability density function.
A Chi-squared Goodness-of-fit test at the 0.05 level of significance is used to test the hypothesis that the tow force has a Rayleigh distribution. If the probability of exceedance associated with the Chi-square value is greater than 0.05, the hypothesis is accepted. The probability of exceedance is 0.9107 in Figure 1. It shows that the measured tow force height follows a Rayleigh distribution. Plots for other tow speeds are shown in
Appendix A. The measured tow force height for other tow speeds also follow a Rayleigh distribution.
These show the tow force response can be treated as a linear system with wave amplitude (or height), and the extreme-value statistics used for waves can be applied to tow force. This is the basis of using extreme-value statistics in the formulation of equations 1 to 3.
4.2 Development of Mean Tow Force Equation
4.2.1 Life Raft Calm Water Resistance
Calm water tow resistance tests were conducted in a tow tank with a full-scale, 16-person life raft, as described in Mak et al. 2005. The tow force was measured using an inline load cell.
Figure 2 shows the correlation of calm water raft resistance for different configurations versus tow speed squared. Figure 3 shows the correlation of drogue resistance versus tow speed squared. The slope and R2 value are shown on the plots. They show there are very good correlations between the fitted straight lines and the raft resistance and drogue resistance. This is the basis for formulating the calm water resistance term of Equation 1 as (Kraft calm + Kdrogue calm) V2, where Kraft calm and Kdrogue calm are the slope of the fitted
straight lines.
Raft Resistance vs Speed2
y = 413.53x R2 = 0.9966 y = 360.47x R2 = 0.9969 y = 403.85x R2 = 0.9983 y = 396.8x R2 = 0.9968 y = 335.61x R2 = 0.9956 0.0 200.0 400.0 600.0 800.0 1000.0 1200.0 0.0 0.5 1.0 1.5 2.0 2.5 3.0 Speed2 (m/s)2 Resistance(N) Case B Case C Case D Case E Case F
Drogue Resistance vs Speed2 y = 66.791x R2 = 0.9993 0.0 20.0 40.0 60.0 80.0 100.0 120.0 140.0 160.0 180.0 0.0 0.5 1.0 1.5 2.0 2.5 3.0 Speed2 (m/s)2 Resistance(N)
Figure 3. Calm water resistance of drogue at different tow speed
4.2.2 Life Raft Added Resistance in Waves
Added resistance tests of a full-scale, 16-person life raft were conducted in regular waves with a constant wave slope of 1:15. The results are described in Mak et al. 2005 and 2006. The response function, RAW/ζa2, is computed from regular wave tow test data in the
tank.
A typical plot of the measured tow force response function and a fitted smoothing spline is shown in Figure 4. For the validation of Equation 1, tow force measured in irregular wave tests in the tow tank and tow force measured in sea trial are used. Originally, the scope of the work described in Mak et al. 2005 did not require the use of sea trial data, until an opportunity to apply the results to the present work presented itself. Since the frequencies for wave spectra at sea are lower than those measured in the tank, it is necessary to use a smoothing spline curve through all the data points to help define the response function at low frequencies, where no data was measured. The measured data in the tank helped to define the spline.
Figure 4. The measured tow force response function, RAW/ζa2, at 2 knots with a
smoothing spline
It can be seen that the spline fitted well to all the measured tank data and appears quite reasonable throughout the entire frequency range. A possible improvement for further consideration would be to conduct tests at lower wave frequencies in the tow tank, so that the range of frequencies that required data extrapolation is reduced.
4.2.3 Life Raft Added Resistance in Wind
Typically, wind velocities are reported at 10 m above mean water level. Small to medium size life raft canopies normally are less than 2 m above mean water level. Therefore, to apply Equation 1, the wind velocity must be adjusted. The wind velocity profile
according to API-RP2A (1989) is represented by:
n H h H h V V 1/ ⎟ ⎠ ⎞ ⎜ ⎝ ⎛ = (Equation 6) Where
Vh The wind velocity at height h
VH The wind velocity at reference height H, typically 10 m above
mean water level
1/n 1/13 to 1/7, depending on the sea state, the distance from land and the averaging time interval. It is approximately equal to 1/13 for gusts and 1/8 for sustained winds in the open ocean.
For this study, h = 0.5 m and 1/n = 1/8 were used. When applying Equation 1, the projected area of the raft used was 2.1 m2 and the drag coefficient used was 0.7 based on that reported by Hodgins and Mak (1995) on various life rafts.
4.3 Validation of Mean Tow Force Equation with Tow Tank Data
The first step to validate Equation 1 was to tow a full-scale, 16-person, commercially available, SOLAS approved life raft in the NRC-IOT tow tank, in 0.5 m significant height irregular waves. The predicted mean tow forces were compared to measured tow force in irregular wave tests in the tank (Mak et al., 2005).
It should be emphasized that the data used in Equation 1 to predict the mean tow force are derived from tow tests in calm water and regular waves. They are completely independent of the measured irregular waves tow force compared to in the tables.
The following discussion will focus on tests with water bag ballast which has all the input data required for Equation 1. Experiments with manikin ballast are included for
completeness in Appendix C but readers should note that no regular wave test was run for those experiments. Therefore, there was no data on the response functions, RAW/ζa2 for
tests with manikin ballast. To overcome this, the response functions, RAW/ζa2, from tests
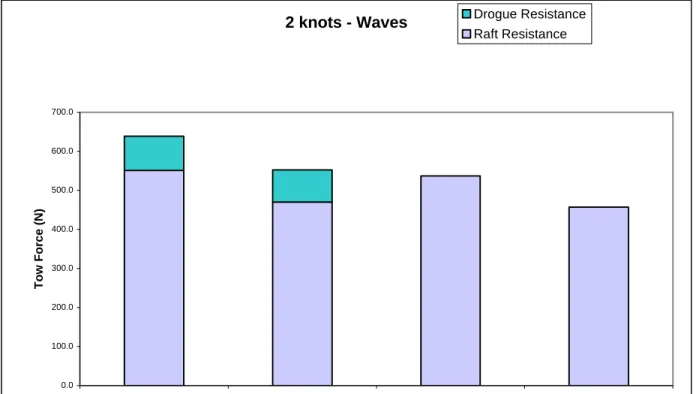
with water bag ballast were used in Equation 1. Mak et al. (2005) showed that manikin ballast consistently results in much higher mean tow force as shown in Figure 5. Since the response functions from water bag ballast were used to predict mean tow force in manikin ballast cases, it is reasonable to expect that Equation 1 will under-predict in those cases.
2 knots - Waves 0.0 100.0 200.0 300.0 400.0 500.0 600.0 700.0
Case E, Uneven, Uninflated, Manikins Case E, Uneven, Uninflated, Bags Case F, Uneven, Uninflated, Manikins Case F, Uneven, Uninflated, Bags
Tow Force (N)
Drogue Resistance Raft Resistance
Figure 5. Effect of ballast type on mean tow force, Case E and F, 2 knots.
Tables 4, 5 and 6 show good agreement between the predicted and measured mean tow forces at 1, 2 and 3 knots respectively.
Mean Tow Force Case
Tow Speed
Ballast Measured Predicted Error
B 1 knot Bags 153.1 158.3 3.40%
C 1 knot Bags 141.7 153.7 8.47%
D 1 knot Bags 153.2 154.9 1.11%
E 1 knot Bags 169.0 172.3 1.95%
Table 4. Comparison of measured and predicted mean tow force in irregular waves in towing tank (1 knots tow speed; significant wave height 0.5 m)
Tow Mean Tow Force
Case Speed Ballast Measured Predicted Error
B 2 knots Bags 546.4 497.8 -8.89%
C 2 knots Bags 492.8 460.1 -6.65%
D 2 knots Bags 537.1 517.5 -3.63%
E 2 knots Bags 550.2 520.3 -5.43%
F 2 knots Bags 457.0 433.7 -5.09%
Table 5. Comparison of measured and predicted mean tow force in irregular waves in towing tank (2 knots tow speed; significant wave height 0.5 m)
Tow Mean Tow Force
Case Speed Ballast Measured Predicted Error
B 3 knots Bags 1170.8 1119.5 -4.39%
C 3 knots Bags 1075.3 950.9 -11.57%
D 3 knots Bags 1077.1 1046.4 -2.85%
E 3 knots Bags 1138.8 1043.5 -8.37%
F 3 knots Bags 970.4 874.8 -9.85%
Table 6. Comparison of measured and predicted mean tow force in irregular waves in towing tank (3 knots tow speed; significant wave height 0.5 m)
The results in the tables show that the predicted mean tow forces agree very well with the measured mean tow forces for tests with water bag ballast. With the exception of one case (Case C) at 3 knots, the prediction errors are all less than 10%. At low tow speed (1-knot), Equation 1 over-predicts in most cases but at higher tow speeds (2 and 3 knots), it under-predicts. The tow force behaves linearly with wave amplitude at low tow speed, as the raft rides up and down the waves. At higher tow speed, the raft plows through the waves as shown in Figure 6. These wave-breaking are causing non-linear phenomena, which are not accounted for in Equation 1. Despite this, the equation still predicts the mean tow force very well.
Figure 6. Life raft plowing through waves when towed at high speed
4.4 Validation of Significant Tow Force Equation with Tow Tank
Data
The initial validation of Equation 2 involves comparing the predicted and measured significant tow forces from towing a full-scale, 16-person life raft in 0.5 m significant height irregular waves in the NRC-IOT tow tank (Mak et al., 2005).
In Tables 7, 8 and 9, the predicted and measured significant tow force variations (i.e. average of one-third highest tow force variation about its mean) are compared at 1, 2 and 3 knots respectively.
Case Tow Speed Ballast m0 [N2] Predicted Significant Tow Force Variation [N] Measured Significant Tow
Force Variation [N] Error
B 1 knot Bags 18613 546 533 2.3% C 1 knot Bags 14070 475 470 0.9% D 1 knot Bags 19388 557 564 -1.2% E 1 knot Manikins 25105 635 624 1.6% E 1 knot Bags 19120 553 532 4.0% F 1 knot Manikins 21037 580 579 0.1%
Table 7. Comparison of measured and predicted significant tow force in irregular waves in towing tank (1 knot tow speed; significant wave height 0.5 m)
Case Tow Speed Ballast m0 [N2] Predicted Significant Tow Force Variation [N] Measured Significant Tow
Force Variation [N] Error
B 2 knots Bags 43797 837 751 11.5% C 2 knots Bags 31422 709 650 9.0% D 2 knots Bags 46175 860 761 12.9% E 2 knots Manikins 45546 854 760 12.3% E 2 knots Bags 32293 719 670 7.3% F 2 knots Manikins 45084 849 777 9.3% F 2 knots Bags 33560 733 660 10.9%
Table 8. Comparison of measured and predicted significant tow force in irregular waves in towing tank (2 knots tow speed; significant wave height 0.5 m)
Case Tow Speed Ballast m0 [N2] Predicted Significant Tow Force Variation [N] Measured Significant Tow
Force Variation [N] Error
B 3 knots Bags 60188 981 860 14.1%
C 3 knots Bags 42150 821 759 8.2%
D 3 knots Bags 58569 968 843 14.8%
E 3 knots Bags 47750 874 723 20.9%
F 3 knots Bags 35236 751 717 4.7%
Table 9. Comparison of measured and predicted significant tow force in irregular waves in towing tank (3 knots tow speed; significant wave height 0.5 m)
In the tables, m0 is equal to
∫
Sraft(f)df , and is the area under the Sraft(f) curve. Theestimated significant tow force variation is computed as (Fvariation)1/3 =4×
∫
Sraft(f)df ,where . The nomenclatures of all the symbols are explained
in Equation 2. ) ( | ) ( | ) (f RAO f 2 S f Sraft = × e
There is good agreement at all tow speed. The best agreement is at 1-knot tow speed, where the prediction error is less than 5%. At 2-knots and 3-knots, the prediction errors gradually increase. Equation 2 tends to over-predict at higher tow speeds.
This is probably because at low tow speeds, the raft rides up and down with the waves, and the tow force behaves linearly with wave amplitude. Typically, tow force is reduced when the raft surges down the crest of a wave since it is catching up with the tow
carriage.
At high tow speeds, the raft plows through the waves, and the tow force response becomes non-linear. Wave plowing is believed to limit the raft from surging forward since wave crest height is reduced and it dissipates the raft forward momentum in the wave breaking process.
4.5 Development of Maximum Tow Force Equation
According to Goda (2000) and Chakrabarti (1987), the most probable maximum wave height in N waves is related to the significant wave height by the following equation.
⎥⎦ ⎤ ⎢⎣ ⎡ + = = N N H H Cwaves ln 2 5772 . 0 ln 706 . 0 3 / 1 max (Equation 7) Where
Hmax Most probable maximum wave height [m]
H1/3 Significant wave height, i.e. average of one-third highest wave
height [m]
N Number of waves in the duration considered. The more waves present in the duration considered, the higher the maximum wave will be. This is due to the fact that the Rayleigh probability function decays asymptotically to zero for large wave height, but never reaches zero.
In Section 4.1, tow force is shown to behave as a linear system with wave height. It is therefore believed that Cwaves would also relate (Fvariation)max to (Fvariation)1/3. Table 10
shows how Cwaves varies with number of waves.
N Cwaves 100 1.61 200 1.71 500 1.84 1000 1.93 2000 2.02 5000 2.13 10000 2.21 20000 2.29 50000 2.38 100000 2.46 Table 10. Cwaves factor
If tow force were perfectly symmetric about its mean, the maximum tow force could be predicted as Fmax =Fmean+(Fvariation)1/3×Cwaves×Cskewness, where Cskewness =
2 1
. However, the tow force response is asymmetrical about its mean. A typical plot of tow force response at 1-knot tow speed is shown in Figure 7. Other tow force responses are plotted in Appendix A. Therefore, a skewness factor, other than
2 1
, needs to be used.
The skewness factor used in this report was
3 2
, bared on the results for the average tow force crest height to tow force height for 1-knot tow speed as shown in Table 11. The skewness factor was computed as
) ( ) ( Trough Average Crest Average Mean Crest Average Cskewness − − = (Equation 8) Case Tow Speed Ballast Average Crest [N] Average Trough [N] Mean [N] Cskewness Average Cskewness B 1 knot Bags 397.21 36.03 153.11 0.68 C 1 knot Bags 326.73 44.67 141.65 0.66 D 1 knot Bags 367.01 46.17 153.18 0.67 E 1 knot Manikins 417.65 55.73 188.12 0.63 E 1 knot Bags 363.78 62.35 169.03 0.65 F 2 knot Bags 399.66 39.85 152.51 0.69 0.66 Case Tow Speed Ballast Average Crest [N] Average Trough [N] Mean [N] Cskewness Average Cskewness B 2 knot Bags 816.65 332.54 546.43 0.56 C 2 knot Bags 721.18 306.51 492.85 0.55 D 2 knot Bags 809.68 324.61 537.05 0.56 E 2 knot Manikins 932.48 414.14 638.37 0.57 E 2 knot Bags 802.74 374.77 552.39 0.58 F 2 knot Manikins 833.39 326.85 536.85 0.59 F 2 knot Bags 706.02 273.25 457.02 0.58 0.58 Case Tow Speed Ballast Average Crest [N] Average Trough [N] Mean [N] Cskewness Average Cskewness B 3 knot Bags 1500.55 910.801170.87 0.56 C 3 knot Bags 1328.82 851.501075.44 0.53 D 3 knot Bags 1354.85 851.021077.16 0.55 E 3 knot Bags 1373.41 980.601144.27 0.58 F 3 knot Bags 1172.42 773.87 937.26 0.59 0.56
4.6 Validation of Maximum Tow Force Equation with Tow Tank
Data
Using the predicted results of Equations 1 and 2 as input to Equation 3, the maximum tow forces were predicted. Tables 12, 13 and 14 show the comparison of predicted and measured maximum tow force at 1, 2 and 3 knots tow speed respectively. The number of waves, N, used in Equation 7 was 100, and Cwaves = 1.61.
As noted in Section 4.3, no regular wave was run for tests with manikin ballast. The response functions, RAW/ζa2, from tests with water bag ballast were used in Equation 1 to
predict mean tow force. Mak et al. (2005) showed that manikin ballast consistently results in much higher mean tow force as shown in Figure 5. Since the response functions from water bag ballast were used to predict mean tow force in manikin ballast cases, it is reasonable to expect that Equations 1 and 3 will under-predict mean tow force and maximum tow force respectively in those cases.
The following discussion will focus on tests with water bag ballast which has all the input data required for Equation 3. The tests with manikin ballast are included for completeness in Appendix C. Case Tow Speed Ballast Predicted Mean Tow Force [N] Predicted Significant Tow Force [N] Predicted Maximum Tow Force [N] Measured Maximum Tow Force [N] Error B 1 knot Bags 158.3 545.7 744.0 666.4 10.4% C 1 knot Bags 153.7 474.5 663.0 657.8 0.8% D 1 knot Bags 154.9 557.0 752.7 736.1 2.2% E 1 knot Bags 172.3 553.1 766.0 888.3 -16.0%
Table 12. Comparison of predicted and measured maximum tow force in irregular waves in towing tank (1 knot tow speed; significant wave height 0.5 m)
Case Tow Speed Ballast Predicted Mean Tow Force [N] Predicted Significant Tow Force [N] Predicted Maximum Tow Force [N] Measured Maximum Tow Force [N] Error B 2 knots Bags 497.8 837.1 1396.3 1430.4 -2.4% C 2 knots Bags 460.1 709.1 1221.2 1386.5 -13.5% D 2 knots Bags 517.5 859.5 1440.1 1505.4 -4.5% E 2 knots Bags 520.3 718.8 1291.8 1460.8 -13.1% F 2 knots Bags 433.7 732.8 1220.2 1241.4 -1.7%
Table 13. Comparison of predicted and measured maximum tow force in irregular waves in towing tank (2 knots tow speed; significant wave height 0.5 m)
Case Tow Speed Ballast Predicted Mean Tow Force [N] Predicted Significant Tow Force [N] Predicted Maximum Tow Force [N] Measured Maximum Tow Force [N] Error B 3 knots Bags 1119.5 981.3 2172.8 2308.8 -6.3% C 3 knots Bags 950.9 821.2 1832.4 1807.8 1.3% D 3 knots Bags 1046.4 968.0 2085.4 1953.0 6.3% E 3 knots Bags 1043.5 874.1 1981.7 2124.6 -7.2% F 3 knots Bags 874.8 750.9 1680.7 1661.9 1.1%
Table 14. Comparison of predicted and measured maximum tow force in irregular waves in towing tank (3 knots tow speed; significant wave height 0.5 m)
The results show that the predicted and measured maximum tow force agreed very well. Among all the test cases with ballast bags, they all had less than 16% error.
4.7 Applying the Equations to Sea Trial Data
Since the equations were developed using the tank carriage as a towing mechanism, it is believed that the predicted tow force would more closely resemble towing by a large vessel than by a small vessel (e.g. a fast rescue craft). For the purpose of this discussion, a large vessel is one that has considerable mass and power. Unlike a small vessel, its passage through head waves is unlikely hindered by the mass of the raft it is towing. At the time this report was written, there was limited sea trial data, so the validation of the proposed equations cannot be as exhaustive as the tank results. However, the sea trials still generate useful information and help to illustrate the value of the equations.
In the following sections, the results from two sea trials will be presented and compared with predicted tow force from the equations. During the months of June and July 2005, Simões Ré et al. (2006) performed two tow tests on 16- and 42-person life rafts at sea. Water bags were used for ballast in both sea trials. The first sea trial involves towing a full-scale 16-person life raft by a fast rescue craft. The raft and ballast condition were the same as it was in the tank study. The second sea trial involves towing a full-scale 42-person life raft by a large vessel and by a fast rescue craft.
A full set of instrumentation similar to that used in the tow tank tests was employed. Additionally a wave buoy was deployed at the test site approximately one week prior to the sea trials. The buoy logged the incident wave power spectral density function at ½ hour intervals. It provides test site-specific detailed wave information. Due to technical problems, no surface current information was available.
4.7.1 Towing a 16-person Life Raft by a Fast Rescue Craft
4.7.1.1 Comparison of Predicted and Measured Mean Tow Force
It was intended that the measured wave spectrum would be used as input to the empirical tow force prediction formula, Equation 1, and the result would be compared to the
experimentally measured tow force. Unfortunately the wave buoy experienced a failure in June prior to the tests on the 16-person raft and the corresponding wave data was not acquired.
However a full set of wave data was measured during the week prior to the tests.
Additionally, a forecast of the significant wave height and wind speed information at the test site was provided by AMEC weather service (www.amec.com) at 3-hour intervals for the entire period. A typical AMEC forecast is shown in Appendix B.
So, it was decided to attempt to derive a representative wave spectrum from the available wave buoy data and the AMEC forecast. The premise was to calculate a series of average wave spectra for a range of significant wave heights to derive typical spectral shapes. Then, the AMEC forecast would be used to select a representative shape that would then be scaled to the required height. The assumption was that the prevailing sea state and spectral shape during the week of sea trials would be similar to those the week prior. Figure 8 shows the calculated average wave spectra for the week in June.
Figure 8. Average measured wave spectra in June 2005
In the July sea trials with 42-person life raft, a full data set was acquired from the wave buoy. To validate the AMEC forecast and the measured wave buoy data, the two datasets were compared against each other.
The frequency of occurrence histogram in Figure 9 shows the variation in measured and forecast significant wave height in July follows roughly a normal distribution, with its center close to the arithmetic mean. The significant wave height measured by the wave buoy was typically 16.7% higher than the one forecasted by AMEC.
0 2 4 6 8 10 12 14 -40.00% -30.00% -20.00% -10.00% 0.00% 10.00% 20.00% 30.00% 40.00% 50.00% 60.00% Average = 16.7%
It was believed that the arithmetic mean would be the most appropriate to use in correlating the AMEC forecast with the measured wave buoy data. Based on that, the wave buoy significant wave height in June was estimated from the AMEC forecasted significant wave height closest to the time of sea trial, increased by 16.7%. Once the significant wave height, Hs, was estimated, the nearest spectral shape was chosen from
Figure 8, and the area under the spectrum, m0, was adjusted so that HS =4 m0 . This
approximation is believed to be appropriate because the wave spectra shape remains very similar for different significant wave height. The wave spectrum was then used in
Equation 1 to predict the mean tow force.
The predicted mean tow force, its contributing components and the measured mean tow force at sea, for Case B at 2 knots tow speed, are shown in Table 15. The significant wave height is 1.3 m. It shows that the measured and predicted mean tow force agree well. Case Ballast Measured Mean Tow Force [N] Calm Water Resistance [N] Predicted Added Wave Resistance [N] Predicted Added Wind Resistance [N] Predicted Mean Tow Force [N] Error B Bags 687.1 403.7 258.3 13.9 675.9 -1.6%
Table 15. Comparison of measured and predicted mean tow force in sea trial
(16-person raft towed at 2 knots by Fast Rescue Craft; significant wave height 1.3 m)
4.7.1.2 Comparison of Predicted and Measured Significant Tow Force
Table 16 shows the predicted and measured significant tow force variation in sea trial. The verification of Equation 2 is limited to computing (Fvariation)1/3 =4×∫
Sraft(f)df .Sraft(f) was obtained by computing the power spectrum from the measured tow force
rather than obtained from . This is because the wave spectrum
measured at sea has a much lower frequency range than those tested in the tank. So, was not available for the frequency range of the wave spectrum at sea. A model scale raft tow test is required to provide in the frequency range of interest, and this points to the necessity of model tests discussed in Section 4.8.
) ( | ) ( | ) (f RAO f 2 S f Sraft = × e 2 | ) ( |RAO f 2 | ) ( |RAO f
Equation 2 over-predicts the significant tow force variation, similar to its prediction in the tow tank. The over-prediction error is slight higher than the comparable tow speed in the tow tank. It is believed that increased significant wave height and wave plowing at high tow speed combined to create more wave breaking and non-linear phenomena not accounted for by Equation 2. Energy is lost in the wave breaking process and this may reduces life raft tow force variation. Also, towing the life raft by a fast rescue craft may
also contribute to the difference, since the predictions should resemble more closely a raft towed by a large vessel.
Case Tow Speed Ballast m0 [N2] Predicted Significant Tow Force Variation [N] Measured Significant Tow Force Variation [N] Error Sea
Trial 2 knots Bags 208563 1826.75 1538.16 18.8%
Table 16. Comparison of measured and predicted significant tow force in sea trial (16-person raft towed at 2 knots by Fast Rescue Craft; significant wave height 1.3 m)
4.7.1.3 Comparison of Predicted and Measured Maximum Tow Force
Table 17 shows good agreement between the predicted and measured maximum tow force. While in this particular case, the predicted maximum tow force from Equation 3 agreed well with the measured maximum tow force, readers should be cautioned that more data from sea trials is required to fully validate the equations and to assess the difference between towing by a large vessel and a small vessel.Case Tow Speed Ballast Predicted Mean Tow Force [N] Predicted Significant Tow Force [N] Predicted Maximum Tow Force [N] Measured Maximum Tow Force [N] Error Sea Trial 2 knots Bags 675.9 1826.7 2758.4 3018.9 -9.4% Table 17. Comparison of measured and predicted maximum tow force in sea trial (16-person raft towed at 2 knots by Fast Rescue Craft; significant wave height 1.3 m)
4.7.2 Towing a 42-person Life Raft by a Fast Rescue Craft and by a Large Vessel
Table 18 shows the measured results of a 42-person life raft towed by a fast rescue craft and by a large vessel in head seas. The fast rescue craft used fixed rpm setting (1,000 rpm and 1,500 rpm for 2-knots and 3-knots nominal speed respectively) during the tow test. The corresponding tow force time series are shown in Figures 10 and 11, for 2 knots and 3 knots tow speed respectively.
Towing Vessel Nominal Tow Speed [knot] Actual Average Tow Speed from GPS [knot] Significant Wave Height [m] Peak Wave Period [s] Tow Force Mean [N] Tow Force Std Dev. [N] Tow Force Max [N] FRC 2 2.3 1.37 9.09 809 1082 8283 Large vessel 2 2.2 1.07 9.09 3045 1015 7375 FRC 3 3.0 1.32 11.76 1832 771 5654 Large vessel 3 3.1 1.23 9.09 4056 1401 9565
Table 18. 42-person life raft tow tests at sea
Figure 10. Measured tow force with the 42-person life raft towed by a Fast Rescue Craft and by a large vessel, MV Lauzier (2 knots)
Figure 11. Measured tow force with the 42-person life raft towed by a Fast Rescue Craft and by a large vessel, MV Lauzier (3 knots)
At the time this report was written, no tow tests had been conducted in the tank on the 42-person life raft. Therefore, the necessary input information for Equations 1 and 2 are unavailable. However, the formulation of Equation 3 can still be validated with the measured tow force, using the measured Fmean and (Fvariation)1/3. To perform this
validation, Fmean is computed as the arithmetic mean of the time series. (Fvariation)1/3 is
computed as (4 x Standard Deviation), recognizing that it is approximately equal to
∫
× Sraft(f)df
4 . Table 19 shows the comparison of predicted maximum tow force using this method and the measured maximum tow force. The number of waves, N, is estimated to be around 200 and Cwaves of 1.71 was used.
Towing Vessel Nominal Tow Speed Significant Wave Height [m] Measured Mean Tow Force [N] Measured Significant Tow Force [N] Predicted Maximum Tow Force [N] Measured Maximum Tow Force [N] Error FRC 2 knots 1.37 810 4328 5744 8283-44.2%(Note 1)
Large Vessel, Lauzier 2 knots 1.32 3045 4064 7407 7376 0.4%
FRC 3 knots 1.07 1832 3086 5351 5654 -5.7%
Large Vessel, Lauzier 3 knots 1.23 4057 5605 10073 9565 5.0%
Table 19. Comparison of measured and predicted maximum tow force in sea trial (42-person raft towed at 2 knots by Fast Rescue Craft and by large vessel)
1
Shock loads resulting from repeated occurrence of slack towline becoming taut is unrelated to wave height and are not accounted for by equations developed based on linear relationship between tow force and wave height.
From Table 19, it is observed that the maximum tow force predicted using Equation 3 agreed well with the measured maximum tow force in all but one case - the case when the life raft was towed by a fast rescue craft at 2 knots. If one examines the measured tow forces of this case closely, it is obvious that the tow force dropped to zero frequently. The other cases do not exhibit the same behavior. This indicates that the towline became slack frequently and remained slacked for a long duration, up to 10 seconds sometimes. When the towline became taut again, the tow force increased sharply. Figure 12 presents a close-up plot of the tow force time series from 800 to 1000 seconds to show the phenomenon. The appearance of shock load may indicate that the FRC is traveling too slowly, allowing the raft to catch up as it slides down the wave crest, at which point the towline became slack. A trained crew on the towing craft would attempt to minimize shock load by changing speed, course and towline length. However, during the test, the fast rescue craft was set to use fixed rpm. Shock loads bear no relationship to wave height and are not accounted for by the equations developed in this report.
Figure 12. Measured tow force with the 42-person life raft towed by a Fast Rescue Craft (2 knots)
From the 3-knot tow results, it appears that towing by a large vessel will likely generate larger maximum tow force than towing by a fast rescue craft. This tends to demonstrate that a tank test using the carriage to simulate towing is conservative, as it models towing by a large vessel.
4.8 Need for Model Test
There are many advantages in conducting full-scale life raft tow tests in a tow tank. The major advantages include controlled test environment to assess different variables, avoiding inaccuracy in model scaling, rafts can be tested as purchased commercially, rafts can be setup to closely resemble actual towing configuration etc. It is definitely invaluable in developing the methodology and equations. However, there is a limit to what can be done with full-scale testing in the tow tank due to physical tank limitations. These limitations include wave height (typically about 1 m wave height for regular waves and 0.6 m significant wave height for irregular waves) and wave frequencies (typically 0.15 Hz to 1.2 Hz) that can be generated, tow tank length, wave reflection, size of life raft that can fit in the tank etc. For the purpose of validating the proposed methodology in moderate seas, it is necessary to demonstrate repeatable tow test results in a controlled environment, in seas up to 4 m significant wave height. This means model life raft tests are required.
Figure 13 shows typical full-scale Pierson-Moskowitz wave spectra for 1 m to 4 m significant wave height. If a scale of 1:7 is used, it is possible to cover a full-scale frequency range from 0.075 Hz to 0.4 Hz, as marked by vertical lines in the figure. A repeat period of 15-minute full-scale could be used for irregular waves. With this, 2 and 3 knots tows could be completed in one run down the tank. If the amount of wave
reflection is found to be excessive, then each run could be split into two. The stiffness of the raft and tow devices may also need to be modeled to properly simulate the tow dynamics.
Figure 13. Full-scale Pierson-Moskowitz wave spectra
4.9 Predicting Mean Tow Force in Moderate Seas
Having validated Equation 1 with a comprehensive set of measured data in the tank and a limited set of measured data in sea trials, the focus now is to predict the tow force in moderate seas (up to 4 m significant wave height). The rationale for this is to determine the relative importance of calm water resistance, added wave resistance and added wind resistance, in order to assess if tow force estimates based on calm water resistance only is conservative for moderate seas.
A study conducted by LeBlond et al. (1982), showed that the best fit to the observed spectra in Canadian waters is usually provided by the JONSWAP spectrum. Using the typical JONSWAP spectrum peak enhancement factor, γ, provided by LeBlond et al. (1982), for Lake Ontario, Pacific Coast and the Grand Banks shown in Table 20, encounter spectra were computed based on tow speed.
Region Peak enhancement factor, γ Lake Ontario 4.25
Pacific Coast 2.30 Grand Banks 2.20
These encounter spectra were then substituted into Equation 1 to predict the raft tow force in head seas. Other inputs required for equation 1 were obtained from the tow tank results. Wind speed was estimated based on the Beaufort Scale necessary to create the significant wave height and corrected to a height 0.5 m above the mean water level using Equation 3.
Figures 14, 15 and 16 show the contributing tow resistance components of the life raft at 1 and 2 knots tow speed in various sea states, for Lake Ontario, Pacific Coast and the Grand Banks respectively. In each graph, the calm water resistance, the added resistance due to waves, added resistance due to wind and total mean resistance are plotted to show their relative significance. The added resistance due to wind for 1 and 2 knots are
virtually identical for this particular life raft and are denoted as RAddedwind in the graphs.
It can be seen that added resistance due to wind is relatively small for this life raft. Added resistance due to waves increases significantly with increased significant wave height. Added wave resistance surpasses calm water resistance at 1.3 m significant wave height for 1-knot tow. It surpasses calm water resistance at 1.7 m significant wave height for 2-knot tow. At these significant wave heights, the total mean tow resistance is already roughly twice the calm water tow resistance. Above 2 m significant wave height, the total mean tow resistance can be several times higher than calm water tow resistance. Tow force variation about its mean, for example, from riding the crest of a wave propagating opposite to the tow direction, will further increase the maximum tow resistance.
This implies that tow force estimate based on calm water tow resistance is not
conservative for low to moderate seas. It shows added resistance due to waves should be given due consideration. For the 16-person life raft being studied in this report, it appears that added resistance due to wind is relatively small and its contribution can be accounted for in applying a conservative safety factor. However, this may not be true for all life rafts because they have different shapes, projected area and drag coefficient.
Resistance components at 1 & 2 knots 0.0 200.0 400.0 600.0 800.0 1000.0 1200.0 1400.0 1600.0 1800.0 0 1 2 3 4 5 Hs (m) Resistance (N)
R Mean total 2 knots
RCalm 1 knot
RAdded waves 2 knots
RAdded wind
RCalm 2 knots
RAdded waves 1 knot
RMean Total 1 knot
Resistance components at 1 & 2 knots 0.0 200.0 400.0 600.0 800.0 1000.0 1200.0 1400.0 1600.0 1800.0 2000.0 0 1 2 Hs (m) 3 4 5 Resistance (N)
RMean total 2 knots
RCalm 1 knot RAdded waves 2 knots
RAdded wind
RCalm 2 knots RAdded waves 1 knot
RMean total 1 knot
Figure 15. Contributing mean tow resistance components, Pacific Coast, 1 and 2 knots
The total tow resistance for the three geographical regions is very similar. The Pacific Coast and the Grand Banks are practically identical because the peak enhancement factors, γ, of the JONSWAP spectra are so close. Comparing the three geographical regions, it shows that when the JONSWAP spectrum peak enhancement factor, γ,
increases, mean tow force decreases. So, Lake Ontario has the lowest mean tow force and the Grand Banks has the highest mean tow force. However, the difference is insignificant, in the range of 100 N at 4 m significant wave height for 2-knot tow.
Resistance components at 1 & 2 knots 0.0 200.0 400.0 600.0 800.0 1000.0 1200.0 1400.0 1600.0 1800.0 2000.0 0 1 2 3 4 5 Hs (m) Resistance (N)
RMean total 2 knots
RCalm 1 knot
RAdded waves 2 knots
RAdded wind
RCalm 2 knots
RAdded waves 1 knot
RMean total 1 knot
5.0 Conclusions
1. The life raft tow force was demonstrated to be mostly inertial using the Keulegan-Carpenter number. It was also shown to follow a Rayleigh distribution. These show that tow force response can be treated as a linear system with wave amplitude (or height), and the extreme-value statistics used for waves can be applied to tow force. This is the basis in the formulation of the equations.
2. A methodology is proposed to predict life raft tow force at different tow speeds and in various sea states, with waves and wind. The methodology involved using tank
experiments to obtain tow force response for one sea state, which can then be used to predict life raft tow force in wind and waves for different sea states.
Three formulae are proposed to empirically predict the mean tow force, tow force variation and maximum tow force. These formulae were developed for upwind, head seas, which is believed to be potentially the worst-case scenario. As the formulae were developed using a tank carriage as the towing device, they would resemble towing by large vessel more closely than by a small vessel, such as a fast rescue craft. 3. The three equations were extensively validated using tow force measured by towing a full-scale 16-person, commercially available, SOLAS approved life raft in the tank, in head seas with significant wave height of 0.5 m. They were also partially validated with limited sea trial data, by towing the same 16-person life raft and a 42-person life raft in head seas with significant wave height of 1.3 m. The formulae were able to predict maximum tow forces to within 15% of the measured.
4. Results from the 42-person raft, 3-knot tow sea trial appear to indicate that towing by a large vessel will likely generate a larger maximum tow force than towing by a fast rescue craft (a small vessel). Also, towing by both the large vessel and the fast rescue craft (small vessel) resulted in the same order of magnitude of maximum tow force (9,565 N and 5,654 N when towed by the large vessel versus towed by the small vessel respectively.) This may justify the use of a carriage in a towing tank for life raft tow experiments because it closely simulates towing by a large vessel and would result in more conservative tow load estimation.
5. Shock loads caused by slack towline suddenly becoming taut could result in very high maximum loads. This type of shock load occurs when the towing vessel travels too slowly, allowing the raft to catch up as it slides down the wave crest. This type of shock load bears no relationship to wave height and is not accounted for by the equations developed in this report.
6. Using the equations, it can be shown numerically that added resistance due to waves increases significantly with increased significant wave height. Added wave resistance surpasses calm water resistance at 1.3 m significant wave height for 1-knot tow. It surpasses calm water resistance at 1.7 m significant wave height for 2-knot tow. At
these significant wave heights, the total mean tow resistance is already roughly twice the calm water tow resistance. Above 2 m significant wave height, the total mean tow resistance can be several times higher than calm water tow resistance. Tow force variation about its mean, for example, from riding the crest of a wave propagating opposite to the tow direction, will further increase the maximum tow resistance. This implies that tow force values based on calm water tow resistance are very optimistic for low to moderate seas and are not good representations of real world situation.
![Table 2. Keulegan-Carpenter number for 16-person life raft Hs[m] Hrms[m] Tp[s] Water Depth [m] Wave NumberWater Particle Velocity [m/s] Tow Velocity [m/s] Life Raft Diameter [m] KC 0.5 0.35 2.55 7 0.616930.490.5 3.4 0.74 0.5 0.35 2.55 7 0.616930.491.53.](https://thumb-eu.123doks.com/thumbv2/123doknet/14180695.476203/16.918.135.707.456.951/table-keulegan-carpenter-numberwater-particle-velocity-velocity-diameter.webp)