Publisher’s version / Version de l'éditeur:
Vous avez des questions? Nous pouvons vous aider. Pour communiquer directement avec un auteur, consultez la première page de la revue dans laquelle son article a été publié afin de trouver ses coordonnées. Si vous n’arrivez pas à les repérer, communiquez avec nous à PublicationsArchive-ArchivesPublications@nrc-cnrc.gc.ca.
Questions? Contact the NRC Publications Archive team at
PublicationsArchive-ArchivesPublications@nrc-cnrc.gc.ca. If you wish to email the authors directly, please see the first page of the publication for their contact information.
https://publications-cnrc.canada.ca/fra/droits
L’accès à ce site Web et l’utilisation de son contenu sont assujettis aux conditions présentées dans le site LISEZ CES CONDITIONS ATTENTIVEMENT AVANT D’UTILISER CE SITE WEB.
Technical Report (National Research Council of Canada. Energy, Mining and
Environment); no. NRC-EME-56200, 2020-10-01
READ THESE TERMS AND CONDITIONS CAREFULLY BEFORE USING THIS WEBSITE.
https://nrc-publications.canada.ca/eng/copyright
NRC Publications Archive Record / Notice des Archives des publications du CNRC :
https://nrc-publications.canada.ca/eng/view/object/?id=76b7d97b-b302-41f0-b34f-7c640e3f4427 https://publications-cnrc.canada.ca/fra/voir/objet/?id=76b7d97b-b302-41f0-b34f-7c640e3f4427
NRC Publications Archive
Archives des publications du CNRC
For the publisher’s version, please access the DOI link below./ Pour consulter la version de l’éditeur, utilisez le lien DOI ci-dessous.
https://doi.org/10.4224/40002069
Access and use of this website and the material on it are subject to the Terms and Conditions set forth at
Super Critical Water Gasification: a review of current research
progress
Super Critical Water Gasification
A review of current research progress
James Butler, Allison Procher, Samira Lotfi, Jennifer Littlejohns
Energy, Mining and Environment
October 1
st, 2020
Disclaimer
This Report prepared by the National Research Council of Canada (NRC), is intended to provide a useful tool for stakeholders to acquire knowledge on Supercritical Water Gasification (SCWG) and identify meaningful areas for future research efforts. NRC assumes no responsibility or liability for any decisions based upon the information and/or from references in this report. Neither NRC, nor its employees, make any warranty, express or implied, or assume any legal liability or responsibility for the accuracy or completeness of any information, methods, processes that are presented in this report, and assume no responsibility for anyone's use of this information. NRC also assumes no responsibility for any damage or other liability whatsoever including any consequential damage even if NRC or any of the NRC
representatives/employees have been advised of the possibility of such damages resulting from selection or use of the information, apparatuses, methods processes or similar items described in this document. Applicable local and regional regulations should be read thoroughly and governing bodies should be consulted prior to commencing of a project. The contents of this handbook are not intended to provide recommendations on a particular technology over another. NRC does not endorse products or
companies. References and hyperlinks to external web sites do not constitute endorsement by NRC of the linked web sites, or the information, products or services contained therein. NRC does not exercise any editorial control over the information that may be found in these references.
Ce manuel, préparé par le Conseil national de recherches du Canada (CNRC), vise à fournir aux
intervenants un outil utile pour acquérir des connaissances sur la gazéification de l’eau supercritique pour positionner les projets en vue de leur succès et identifier des domaines significatifs pour les efforts de recherche futurs. Le CNRC n'assume aucune responsabilité pour toute décision basée sur l'information et / ou des références dans ce rapport. Ni le CNRC, ni ses employés, n'offrent aucune garantie, expresse ou implicite, ou n'assument aucune responsabilité légale quant à l'exactitude ou à l'exhaustivité des informations, méthodes et processus présentés dans le présent rapport et n'assument aucune
responsabilité quant à l'utilisation de ces informations. Le CNRC n'assume aucune responsabilité pour tout dommage ou toute autre responsabilité, y compris les dommages indirects, même si NRC ou l'un des représentants / employés du CNRC ont été avisés de la possibilité de tels dommages résultant de la sélection ou de l'utilisation des renseignements, appareils, procédés ou méthodes similaires décrits dans ce document. Les réglementations locales et régionales applicables doivent être lues attentivement et les organes directeurs doivent être consultés avant de commencer un projet. Le contenu de ce manuel ne vise pas à fournir des recommandations sur une technologie particulière par rapport à une autre. Le CNRC n'appuie pas les produits ou les entreprises. Les références et les hyperliens vers des sites Web externes ne signifient pas que le CNRC approuve les sites Web liés ou les informations, produits ou services qu'ils contiennent. Le CNRC n'exerce aucun contrôle éditorial sur les informations pouvant figurer dans ces références.
Summary
Supercritical Water Gasification (SCWG) is a promising technology for the treatment and valorization of difficult waste streams, particularly high moisture waste streams that require significant energy to de-water prior to disposal. Municipal and industrial wastede-water containing organics is ideally suited for conversion using SCWG. The highly corrosive properties of supercritical water are such that breaks down organic molecules and converts them into gaseous products. The gas product of SCWG is primarily composed of hydrogen, methane and carbon dioxide with minimal carbon monoxide. After separation of CO2 which can be accomplished through staged de-pressurization of the product stream or low pressure
water washing, a high value gas consisting primarily of hydrogen and methane is produced. This gas can be injected into the natural gas grid or the hydrogen separated utilizing high pressure membrane
separation for a low carbon source of hydrogen energy carrier. SCWG has the added benefit of removing difficult to treat wastewater components such as endocrine disruptors and micro-plastics.
This report prevents a review of the current state of research into SCWG. It offers the reader a detailed introduction to SCWG reaction mechanisms, effect of different parameters and reactor designs. As well as, insight into what research has been conducted in this area, the progress in process scale-up and the main challenges of the technology.
There are a number of challenges that need to be overcome before effective scale-up can be achieved. The primary challenges are: reactor material corrosion under corrosive supercritical conditions; plugging of the reactor due to char formation and salt precipitation; and reactor design to maximize heat transfer and efficiency of the system. The high temperatures and pressures required to bring water to supercritical conditions necessitate significant energy recovery unit operations to minimize the energy input required. These challenges provide opportunity for further research at the lab scale. Due to the low concentration of biomass in the feed (5-10%) and the energy required, the process is unlikely to be a net energy producer; however, if a lower value energy carrier is used for the production of a high value energy carrier such as hydrogen, the process can be exergetically favourable.
This report also examines the progress being made in scale-up of SCWG systems. There are a significant number of lab SCWG reactors in operation and a few pilot / demonstration scale systems. As experience with these systems increases and the knowledge base grows, more optimized / refined designs for full scale systems will be developed and built. It is expected that research in this area will shift further towards large scale systems in the coming decade.
The interest in SCWG has grown significantly in the past 20 years along with society’s desire to responsibly manage its waste. This desire is based on an increased understanding of the detrimental effects of biological contaminants and micro-plastics in wastewater. This report examines the momentum of different topic areas of SCWG research. The topic areas seeing the most growth according to the publication momentum analysis are reactor materials and solid fuels as a feedstock; however, the topics of wastewater and sewage still dominate the topics on feedstock.
This report is meant to be a tool for researchers in the area of SCWG who wish to learn about the current understanding of the science behind gasification of hydrocarbons in supercritical water; to learn about the scale-up efforts underway in the area and to highlight potential areas of applied research.
Contents
Introduction... 1
Properties of Supercritical Water ... 4
Biomass Decomposition in SCW ... 6 3.1 Reaction Mechanism ... 8 3.2 Feedstocks ... 12 3.2.1 Sewage Sludge ... 13 3.2.2 Pre-treatment ... 14 3.3 Conditions ... 15 3.3.1 Pressure ... 16 3.3.2 Temperature ... 16 3.3.3 Feedstock Concentration ... 18 3.3.4 Residence time ... 19 3.3.5 Heating Rate ... 22 3.3.6 Catalysts ... 23 3.4 By-Products ... 24 Reactor ... 26 4.1 Bench Scale ... 26 4.2 Lab/Demonstration Scale... 27
4.3 Lab Scale Continuous Systems ... 28
4.3.1 Electrically Heated Tubular Reactor ... 28
4.3.2 Immersed Tubular Reactor ... 36
4.3.3 CSTR Reactor ... 38
4.3.4 Fluidized Bed Reactor ... 39
4.4 Catalytic Effects ... 41 4.5 Reactor Operation ... 41 Scale-up ... 43 5.1 Demonstration Systems ... 43 5.1.1 VERENA ... 43 5.1.2 Sparqle International B.V ... 45
5.1.3 BTG Biomass Technology Group ... 45
5.1.4 T.U. Delft/Gensos (Yakaboylu et al, 2018) ... 46
5.1.5 Supercritical water gasification of sewage sludge: A pilot scale study ... 47
5.1.6 Solar-driven supercritical water gasification pilot plant for hydrogen production ... 49
5.1.7 University of Valladolid & High-Pressure Process Group ... 50
Challenges ... 52 6.1 Corrosion ... 52 6.1.1 Mechanism ... 52 6.1.2 Materials ... 53 6.1.3 Parameters ... 53 6.1.4 Corrosion in SCWG ... 54 6.2 Creep ... 55 6.3 Salt Precipitation ... 55
6.5 Energy Recovery ... 56
6.6 Reactor Heating ... 57
Research Landscape ... 58
7.1 Patents ... 58
7.1.1 Super-Critical Water Gasification ... 58
7.1.2 Supercritical Water Oxidation ... 59
7.2 Publications ... 61
7.2.1 Super-Critical Water Gasification ... 61
7.2.2 Super-Critical Water Oxidation ... 62
7.2.3 Topic Area Trends ... 63
Research Opportunities ... 67 8.1 Waste Water ... 67 8.2 Non-biomass wastes ... 67 8.3 Corrosion ... 67 8.4 Reactor Heating ... 68 Conclusion ... 69 References ... 70
Appendix A: Properties of Super Critical Water at 25 MPa ... 78
List of tables
Table 1: Hydrothermal conversion processes desired products and severity of conditions ... 2
Table 2: Intermediate products of glucose decomposition [1]... 7
Table 3: Species detected in the aqueous phase after hydrothermal liquefaction (300°C and 12 MPa) and SCWG (400°C and 29 MPa) [13]. ... 11
Table 4: Effect of temperature on gaseous products of SCWG of sewage sludge [27] ... 13
Table 5: Effect of key parameters on SCWG ... 15
Table 6: Material, critical dimensions, flow rate, and residence times of continuous flow reactors. ... 28
Table 7: Differences between simulation [39] and experimental results [41]... 43
List of figures
Figure 1: Phase diagram of water, critical point: 364°C, 22.1 MPa... 1
Figure 2: Relationship between different hydrothermal conversion techniques ... 2
Figure 3: Density of water at different temperatures and pressures [3] ... 4
Figure 4: Dielectric constant of water at different temperatures ... 4
Figure 5: Effect of temperature and pressure on the products of hydrothermal conversion ... 6
Figure 6: Gas composition of hydrothermal glucose decomposition as a function of temperature, 28 MPa, 30 s residence time and 0.6 M glucose feed [9]. ... 7
Figure 7: Proposed mechanism of glucose decomposition in sub and super-critical water by [13]. ... 10
Figure 8: Glucose decomposition pathways and the effect of catalysts and heating rate [12]. ... 11
Figure 9: A simplified reaction mechanism for the hydrothermal gasification of woody biomass, “cat.” refers to the use of a catalyst; 5-NHF to hydroxymethyl furfural [13]. ... 12
Figure 10: Schematic of a proposed sequential SCWG and SCWO process for treatment of waste water and generation of hydrogen rich gas: (1) feedstock tank; (2) high pressure meter pump; (3) natural gas furnace; (4) SCWG tubular reactor; (5) SCWG heat exchanger; (6) SCWG gas–liquid separator; (7) liquid oxygen tank; (8) liquid oxygen pump; (9) vaporizer; (10) SCWO tubular reactor; (11) SCWO heat exchanger; (12) SCWO gas–liquid separator; (13) back pressure valve. ... 14
Figure 11: Simulated effect of temperature on gas yield at 25 MPa with 5 wt.% dry biomass content [39]. ... 17
Figure 12: Effect of high temperatures on the CGE and H2 yield of corn cob gasification (Lu et al. 2012) 18 Figure 13: Effect of dry biomass content on gas yield at 25 MPa with 5 wt.% dry biomass content [39]. .. 18
Figure 14: Effect of feedstock concentration on CGE and H2 yield from corn cob gasification [37]. ... 19
Figure 15: Gas yield as a function of increasing residence time / space time [45]. ... 20
Figure 16: Gas composition during SCWG of sewage sludge as a function of residence time at temperature of 600°C and pressure of 25 MPa [38] ... 21
Figure 17: Effect of feed flow rate (residence time) on product gas composition, yield and conversion efficiency in a pilot scale SCWG system [41]. ... 21
Figure 18: Effect of heating rate on carbon conversion efficiency of cabbage slurry, adapted from [47]. .. 22
Figure 19: Effect of catalysts on the product yield from SCWG of glucose at 500C and 30 MPa at a heating rate of a) 1 k/min and b) 3 K/min [12]. ... 23
Figure 20: Effect of reactor conditions on char and oil yield from a demonstration scale SCWG system [41]... 25
Figure 21: Hydrothermal diamond anvil cell schematic [58]. ... 26
Figure 22: Carbon balance in the HTL-to-fuel process [32]. ... 27
Figure 23: Schematic representation of the continuous flow supercritical water reformer from [59]. ... 29
Figure 24: Inclined tubular reactor [68]. ... 29
Figure 25: Schematic representation of the SCWG apparatus from [61]; (1) feed reservoir, (2) pump, (3) preheater, (4) reactor, (5) oven, (6) thermostatic bath, (7) condenser, (8) manometer. ... 30
Figure 26: Schematic diagram of the bench scale continuous-flow reactor for SCWG from [62]. ... 31
Figure 27: Experimental apparatus from [38]. ... 31
Figure 28: Experimental apparatus from [63]. ... 32
Figure 29: One of three reactor configurations from [16]. ... 32
Figure 30: Continuous flow tubular reactor setup from [64]. ... 33
Figure 32: Experimental setup from [9]... 34
Figure 33: SKLMF supercritical flow reactor setup [66]. ... 35
Figure 34: Continuous reactor system in the PNNL TEES process [49]; (1) pump, (2) reactor, (3) furnace, (4) filter, (5) condenser, (6) back pressure valve, (7) condenser, (8) liquid collection tank, (9) liquid sample port, (10) gas/liquid separator, (11) filter, (12) gas flow meter, (13) liquid trap [49]. ... 36
Figure 35: Tubular SCWG reactor submerged in metal salt bath [60]. ... 37
Figure 36: Fluidized bed heated tubular reactor system; U is the control unit, T is a thermocouple, a-d are bed heaters [74]. ... 37
Figure 37: Batch reactor setup at Pacific Northwest Laboratory [66]. ... 38
Figure 38: Continuous stirred-tank reactor system setup by the NABC [32]. ... 39
Figure 39: Fluidized bed SCWG reactor; 1 feedstock tank; 2,3 feed pump; 4 fluidized bed reactor; 5,6 heat exchanger; 7 chiller; 8,9,10 back-pressure regulator; 11 high pressure separator; 12 low pressure separator; 13,14 wet test meter; 15,16,17,18 high pressure pump; 19,20,21,22 mass flow meter; 23 water tank. ... 39
Figure 40: Fluidized bed SCWG system from [41]. ... 40
Figure 41: Effect of reactor temperature on product gas composition and gas yield of supercritical gasification of 4.4 wt.% dry starch in a pilot scale facility (24.5 kg/hr) [41]. ... 43
Figure 42: VERENA pilot-plant setup [67]. ... 45
Figure 43: Sparqle International B.V. gasification setup [4]. ... 45
Figure 44: Schematic diagram of the BTG pilot plant at the University of Twente in Enschede [58]. ... 46
Figure 45: Delft UT/Gensos semi-pilot scale setup [41]. ... 47
Figure 46: Pilot scale system [68]. ... 49
Figure 47: Solar driven SCWG pilot plant [69] ... 50
Figure 48: SCWO pilot scale setup at the University of Valladolid [70]. ... 51
Figure 49: Corrosion rates of general corrosion caused by HCl solutions at different pressures ([O2] = 0.5 mol/kg, [HCl] = 0.05 mol/kg) [75]. ... 54
Figure 50: SEM backscatter image of corrosion product on the inner diameter of used Hastelloy reactor. Unaltered tube material is the brightest layer at the top of the image [16]. ... 55
Figure 51: Illustration of material creep caused by a constant stress. Adapted from [72] ... 55
Figure 52: Temporal distribution of supercritical water gasification patents ... 59
Figure 53: Top patent affiliations in supercritical water gasification ... 59
Figure 54: Temporal distribution of supercritical water oxidation patents... 60
Figure 55: Top patent affiliations in supercritical water oxidation ... 60
Figure 56: Temporal distribution of supercritical water gasification publications ... 61
Figure 57: Top publishing countries in supercritical water gasification ... 62
Figure 58: Temporal distribution of supercritical water oxidation publications ... 62
Figure 59: Top publishing countries in supercritical water oxidation ... 63
Figure 60: Top subject groups in supercritical water publications ... 64
Figure 61: Research momentum of subject groups in supercritical water publications ... 65
Figure 62: Emerging research subject groups from research momentum analysis shown in full in Figure 61. ... 66
Figure 63: Reaction mechanism for the sub-critical decomposition of glucose based on a compilation of results (Kruse, 2008) ... 79
Introduction
Waste-to-energy processes can be a solution to the dual problems of waste management and GHG reduction from energy production. Growing resistance from communities towards the construction of large landfills and an increasing awareness of the effects of plastic pollution on the environment require a more effective solution to waste-management than landfilling. High moisture waste streams such as sewage sludge and organic food waste require de-watering and drying prior to disposal in landfills, an energy intensive process. Conventional incineration or gasification of these wastes would also require a high energy input to dry the wastes prior to conversion. Anaerobic digestion can be utilized to convert these high moisture waste streams to gaseous fuels, but has a high capital cost, very large footprint and still produces a high moisture solid by-product requiring disposal.
Supercritical Water Gasification (SCWG) is a promising process for converting high moisture waste into a gaseous fuel with minimal solid by-product. Hydrothermal gasification avoids the high energy penalty from drying high moisture feedstocks required for air/steam/oxygen gasification. Significant heat input is still required and the energy required to heat water to 600°C at 30 MPa is only slightly less than heating at 0.1 MPa where evaporation occurs; however, in the case of supercritical water the heat is entirely sensible and is more easily recovered than the latent heat of vapourization [1]. Supercritical water rapidly decomposes carbohydrates through hydrolysis and an excellent solvent for intermediate and gaseous products of biomass decomposition [1] [2]. Figure 1 shows the phase diagram of water and its critical point.
Figure 1: Phase diagram of water, critical point: 364°C, 22.1 MPa.
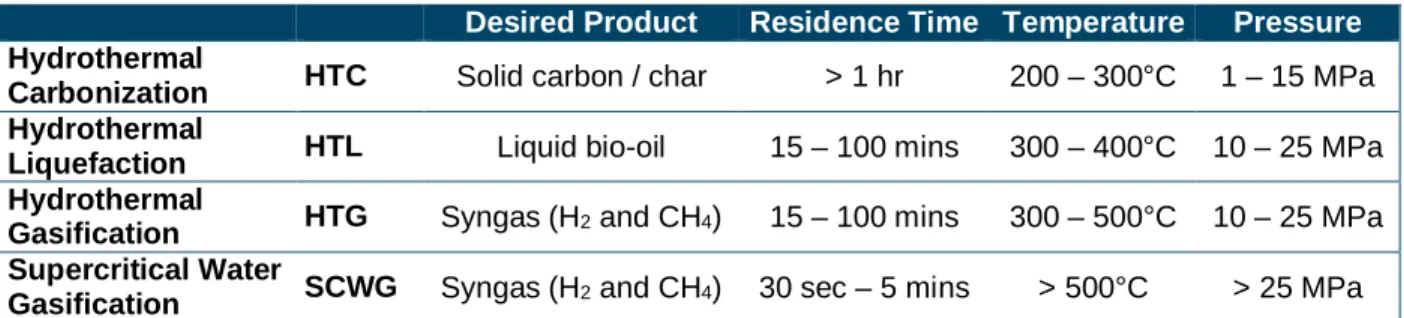
Supercritical water gasification belongs to the hydrothermal conversion family, where high moisture feedstock is heated and pressurized to produce different products. These processes are differentiated by the desired products, the residence time of the process and the severity of the reaction conditions, both temperature and pressure. The desired products and reaction conditions of different hydrothermal processes are compared in Table 1.
Table 1: Hydrothermal conversion processes desired products and severity of conditions
Desired Product Residence Time Temperature Pressure
Hydrothermal
Carbonization HTC Solid carbon / char > 1 hr 200 – 300°C 1 – 15 MPa Hydrothermal
Liquefaction HTL Liquid bio-oil 15 – 100 mins 300 – 400°C 10 – 25 MPa Hydrothermal
Gasification HTG Syngas (H2 and CH4) 15 – 100 mins 300 – 500°C 10 – 25 MPa Supercritical Water
Gasification SCWG Syngas (H2 and CH4) 30 sec – 5 mins > 500°C > 25 MPa
The relationship between the different processes in terms of severity of conditions (Temperature and pressure) and residence time is depicted visually in Figure 2.
Figure 2: Relationship between different hydrothermal conversion techniques
HTG is often interchangeable with SCWG with primary difference in literature is HTG’s use of a catalyst to shift the products from a liquid bio-oil to a syngas. For our purposes HTG will be differentiated from SCWG by severity of conditions, with HTG operating in sub-critical conditions and SCWG in supercritical conditions.
System for pumping and containing Supercritical Water (SCW) are well understood as it has been used as a coolant in nuclear reactors and advanced fossil fuel power plants for many years [3]. However, these systems utilize pure water, whereas SCWG is conducted with a wide variety of contaminants. One of the main disadvantages of SCWG is the high system costs resulting from the extreme conditions require in the reactor. SCWG can cost 1.86 times bio-methanation; however, has a higher efficiency up to 64.8% [1]. At supercritical conditions corrosion from the Supercritical Water (SCW) is severe necessitating costly reactor materials and frequent replacement. This makes SCWG unattractive except for feedstocks with a very high cost of disposal such as sewage sludge [1]. Conventional sewage treatment plants utilize large, costly anaerobic digesters and ultimate de-watering and disposal of the produced sludge from these plants consumes considerable amounts of energy and creates a disposal problem. For example, the European Union currently has 25 larger Sewage Treatment Plants (STPs) that consume large amounts of energy and generate 10 Million tons of sewage sludge (2009) [4]. Current plants recover only 25%-40% of the energy used in anaerobic digestion [4]. In Europe de-watered sludge is currently set to agriculture (32%), composting (13%), land-filling (25%), incineration (13%) and other (17%) [4].
SCWG’s main advantage is the extremely short residence time of < 5 min as compared to 14 – 40 days for Anaerobic Digestion (AD). This makes it a competitive alternative to these, drastically reducing the size of the plants. As well, AD cannot breakdown endocrine disruptors, micro plastics or other
pharmaceuticals that are present in waste water, whereas SCWG indiscriminately breaks down all organics.
As of 2018 there was only one SCWG demonstration plant in operation by Hydromethans AG in Switzerland [3]. Petrochemical companies are investigating SCW for upgrading heavy oil as hydrocarbons are soluble in SCW due to low dielectric constant.
The severity of conditions in SCW also makes Supercritical Water Oxidation (SCWO) an attractive option for the treatment of highly toxic substances like chlorinated dioxins or sulphur or phosphorous containing explosives or chemical weapons [5]. However, corrosion issues and salt plugging would be significant in these situations.
Significant research has been conducted on bench scale supercritical water gasification with model compounds to better understand the reaction mechanism and define the kinetics, the research challenge now is in process design, scale-up and gasification of complex waste feedstocks. The following review summarizes the latest knowledge in the area of supercritical water gasification with a focus on real biomass feedstocks, results from lab scale or larger system, a discussion of the challenges to implementation of SCWG on the full scale and finally, a review of the research landscape.
Properties of Supercritical Water
Above its critical point of 22.12 MPa and 374.12°C, shown in Figure 3, water is in the supercritical state where there is no distinguishing between gas and liquid phases and the properties of each converge at the critical point in the single phase [6]. Supercritical water has the density of liquid water at the critical point (300 kg/m3) shown in Figure 3 and, and the viscosity of steam at the critical point (49x10−6 Pa*s).
The density and specific enthalpy of supercritical water at 25 MPa are tabulated in Table 8 of Appendix A. The structure of supercritical water differs from liquid water in that the polar water molecules are further apart, leading to a decrease of the static dielectric constant, shown in Figure 4 [1]. With a lower dielectric constant, the solubility of organic polar molecules increases and the solubility of inorganic ionic molecules are reduced, giving unique solvent properties. The solubility of gases also increases.
Figure 3: Density of water at different temperatures and pressures [5]
Figure 4: Dielectric constant of water at different temperatures
oxidizing carbon atoms to form CO2 and to a lesser extent CO [7]. Hydrogen atoms from the reduced
water as well as from the feed form H2. The main components in the produced gas are H2, CH4, and CO2.
CO production is typically low since it is consumed by both the water-gas shift and methanation reactions [7]. Tar and coke formation is inhibited by the rapid dissolution of produced gases in the supercritical water. At reaction temperatures below 450°C, CH4 is the main component in the produced gas, whereas
at reaction temperatures above 600°C hydrogen is dominant [7].
Supercritical water gasification has a number of advantages over hydrothermal gasification operating in subcritical conditions. The reaction mechanism changes from ionic in subcritical to free radical in
supercritical, which has a number of advantages [8]. One of the main advantages is reduced tar and char formation by [1]:
· Dilution of the organic molecules, reducing the collision tendency that leads to polymerization o Dilution suppresses reactions of high reaction order
· Promotion of hydrocarbon chain de-polymerization by hydrolysis · Being a good medium for free radical reactions
· Having a high ion product leading to a higher concentration of hydroxyl radicals [1] o Can be used for reactions with intermediate ionic steps
Supercritical water has a number of other benefits [2]:
· SCW is an excellent solvent for intermediates and product gases
· SCW promotes hydrolysis and water-gas shift reactions producing increased H2 and CO · Allows for a more compact reactor system due to high density of SCW and low residence times · Easy separation of CO2 due to its high solubility at high pressure
Some of the major challenges, to be discussed in a later section, include: · Reactor material corrosion
o Leads to high system costs · Solid formation (plugging)
o Char, ash and insoluble salts
· Heat transfer to high pressure reactor at a high heating rate
o Slow heating of feed causes decomposition in heat exchanger o Potential for supercritical water formation in the heat exchanger · Low solid concentrations (un-necessary heating of large volume of liquid) [9]
Biomass Decomposition in SCW
There have been a number of studies looking at the reaction mechanism of the decomposition of idealized compounds in supercritical water. Glucose is the most studied as it is soluble in water making pumping easier, and is the monomer of cellulose, the most abundance organic molecule in biomass of any kind. Glycerol decomposition in sub- and super-critical water is also undertaken to study the reaction mechanism of a simple organic molecule. Cellulose decomposition has also been studied, but to a lesser extent. The decomposition of glucose SCWG reactions [2]:
Glucose reforming: 6 12 6→ 6 2+ 6 ΔH298K = +608 kJ/mol (1)
Water-gas shift: + ↔ + ΔH298K = -41 kJ/mol (2)
CO methanation: + 3 ↔ + ΔH298K = -206 kJ/mol (3)
CO2 methanantion: 2+ 4 2↔ 4+ 2 2 ΔH298K = -165 kJ/mol (4)
Combining these equations yields the two overall glucose gasification reactions [1]:
6 12 6+ 6 2 → 14 2+ 6 ΔH298K = -363 kJ/mol ∆n = 13 (5)
6 12 6→ 3 4+ 3 2 ΔH298K = 134 kJ/mol ∆n = 5 (6)
Equations 5 and 6 show that hydrogen production is favoured at high temperatures due to the high enthalpy of formation of hydrogen as compared to methane. As well, the increase in moles is greater for the production of hydrogen from glucose hydrothermal gasification and lower pressure would favour the production of hydrogen over methane. Kruse et al. (2008) visualized the relation between temperature and pressure and the products hydrothermal processes, shown in Figure 5 where subcritical conditions are marked by the dotted lines [1].
Figure 5: Effect of temperature and pressure on the products of hydrothermal conversion
Figure 6 shows experimental data (points) and model results (dashed lines) of the gaseous products of glucose decomposition in supercritical water [10]. If hydrogen production is preferred, a reactor
Figure 6: Gas composition of hydrothermal glucose decomposition as a function of temperature, 28 MPa, 30 s residence time and 0.6 M glucose feed [10].
Char formation in supercritical water reactors is undesired and can lead to plugging and pressure increases. The primary char formation reactions from glucose pyrolysis as well as from the reaction of products are [2]:
Pyrolysis: 6 12 6→ + 2+ + + 2+ ℎ (7)
Boudard reaction: 2 ↔ + ΔH298K = -172 kJ/mol (8)
CO hydrogenation: + ↔ + ΔH298K = -131 kJ/mol (9)
CO2 hydrogenation: 2+ 2 2↔ + 2 2 ΔH298K = -90 kJ/mol (10)
Glucose decomposition has a number of intermediate products at sub-critical conditions including shown in Table 2 [1].
Table 2: Intermediate products of glucose decomposition [1].
Erythrose Saccharinic acid Pyruvaldehyde Levulinic acid
Glyceraldehyde Furfural 5-hydroxymethylfurfural Trihydroxybenzene
Of the intermediate compounds, phenols are mostly inert to gasification and their decomposition is one of the main barriers to complete gasification [1]. Amino acids (glycine) are even more resistant to
gasification than phenols, but are of a lower concentration [1].
3.1 Reaction Mechanism
In studies of glycerol degradation, Bühler et al. (2002) postulated that there were two competing reaction mechanisms [12]. At high pressures and low temperatures, polar and ionic reaction steps dominate and at high temperatures above the critical point, low-density range free radical reactions are preferred; the latter lead to the formation of gases. Two competing kinetic models describe this reaction behavior: an ionic or polar reaction network typical of liquid-phase chemistry at low temperature and a free radical reaction network typical of gas-phase reactions at high temperature. Kruse (2008) proposed a
mechanism for the sub-critical decomposition of glucose which is worth mentioning, shown in Appendix B [1]. It’s applicability to SCWG is limited, but could be relevant during heating or pressurization of
feedstock before super-critical conditions are reached.
Hydrolysis of cellulose and hemi-cellulose is fast in supercritical water, as such SCWG can be studied using the model products of hydrolysis including cellulose, glucose, glycerol, etc. [1]. Glucose and cellulose SCWG produce a very similar product distributions of syngas, oil and coke, proving that hydrolysis may be the first step in SCWG of cellulose [1]. The dominant reactions of cellulose hydrothermal gasification are [1]:
· Hydrolysis reactions
· Water elimination from double bonds or ethers · Aldol splitting or aldol condensations
· Rearrangement reactions, usually catalyzed by acids or bases
Minowa et al. 1998 conducted subcritical gasification experiments at 18 MPa, of cellulose to determine the reaction mechanism [13]. At 200°C cellulose decomposed only slightly and produced water soluble products, primarily sugars with no gas or water-insoluble bio-oils [13]. This is further evidence that hydrolysis is the first step in hydrothermal gasification of glucose. Cellulose degradation initially begins at 180°C. This temperature can be lowered through the addition of an alkali catalyst. At 250°C cellulose decomposition increased sharply, again forming primarily water-soluble products, but now with some gas, oil and char. Above 300°C char production increased sharply and no cellulose was left in the reactor. The products at this temperature were: 60% char, 10% gas (mostly CO2), 15% non-sugar water soluble
products. Oil is produced from water soluble compounds and once produced are not further gasified. Kabyemela et al. (1999) found fructose and erythrose to be the primary products of glucose decomposition at sub- and super-critical, low temperature (300 - 400°C) conditions and short residence times of 0.2 – 2 s [14]. Both formed through ring opening of glucose. Fructose formed from the open chain form with 25-30% selectivity. Eytherose formed via aldol splitting between the 4th and
5th C with 70% selectivity. Their proposed reaction pathways is shown in
Figure 7: Proposed mechanism of glucose decomposition in sub and super-critical water by [14].
Sinag et al. 2004 proposed a simplified glucose decomposition mechanism to show the effect of catalysts and heating rate on product formation, shown in Figure 8 [15]. The primary decomposition products are furfurals and organic acids. Organic acids are then converted into permanent gases. Furfurals and further decomposed into phenols, organic acids or directly into solid char particles. It can be seen that the presence of catalysts or a high heating rate will lead to increased gas formation and decreased char formation.
Figure 8: Glucose decomposition pathways and the effect of catalysts and heating rate [15].
Waldner and Vogel (2005) attempted to define a simplified reaction mechanism for supercritical
gasification of woody biomass (fir and spruce sawdust) in the presence of a catalyst (Rainey Nickel). This was accomplished by comparing the composition of the liquid produced during hydrothermal liquefaction to SCWG. The biomass was heated in a batch reactor to sub-critical conditions (300°C and 12 MPa) and rapidly quenched, and heated to super-critical conditions (400°C and 29 MPa) and the reaction allowed to go to completion. Waldner and Vogel (2005) found that glucose, formic acid, levulinic acid, methanol, ethanol, and 5-hydroxymethylfurfural (5-HMF) and the main components produce in sub-critical conditions that are degraded during SCWG [16]. The stable degradation products were: oxalic acid, acetic acid, acetaldehyde and phenol. With this they proposed the simplified reaction mechanism shown in Figure 9.
Table 3: Species detected in the aqueous phase after hydrothermal liquefaction (300°C and 12 MPa) and SCWG (400°C and 29 MPa) [16].
Species Concentration (mg/L) Change (%) After Liquefaction After SCWG
D-glucose 4688 0 -100% Pyruvic acid 57 3 -95% Oxalic acid 0 220 --Methylglyoxal 133 92 -31% Glycerol 1288 0 -100% Formaldehyde 8 15 88% Formic acid 1092 155 -86% Acetic acid 749 2730 264% Ethylene glycol 665 0 -100% Levulinic acid 700 80 -89% Acetaldehyde 1701 5360 215% Methanol 4420 160 -96% Ethanol 133 0 -100% 5-hydroxymethylfurfural 133 0 -100% Furfural 14 0 -100% Phenol 42 290 590%
Figure 9: A simplified reaction mechanism for the hydrothermal gasification of woody biomass, “cat.” refers to the use of a catalyst; 5-NHF to hydroxymethyl furfural [16].
3.2 Feedstocks
A wide variety of feedstocks have been tried in SCWG experiments, primarily in small batch tubular quartz or diamond cell reactors. As mentioned, model feedstocks such as glucose and glycerol have been most studied; this section will focus on studies involving real biomass feedstocks.
The composition of the feedstock has a large influence on the kinetic of the gasification reaction and the product yield. As discussed in the previous section, inorganic components in “real” biomass feedstocks. This inorganic / ash fraction can also cause issues in the reactor including reactor plugging due to salts precipitation out of solution in the supercritical water or excessive corrosion of the reactor walls from halogenated compounds [5]. On the contrary, ash content can be beneficial for gas composition and biomass with higher ash yield shows lower CO yield [1].
In “real” feedstocks, no beneficial interaction between cellulose and hemi-cellulose was found to occur in supercritical water [17]. Lignin had a negative effect on gasification efficiency with mixtures including lignin showed lower gas yield and in particular lower hydrogen and methane yields [1, 17]. Lignin gasification requires more severe conditions than cellulose or glucose [1].
Proteins present in biomass feeds have a negative effect on super-critical water gasification of biomass. Baby food with meat products gave a lower gas yield that plant only baby food and glucose [1]. Protein degradation products likely reacted with carbohydrate degradation products in the Millard reaction forming free radical scavengers [18].
Resende et al. (2008) used cellulose and lignin as model biomass feedstocks in SCWG [19]. They found 56% of the chemical energy stored in lignin was present in the syngas after SCWG. H2, CH4, and CO2
increased with water density, CO decreased. H2 and CO are higher for cellulose SCWG vs. lignin, CH4 is
· Temperature at which water gas shift reaction shows significant impact is 500C for cellulose and 600C for lignin
· The gasification of lignin needs much more severe conditions than gasification of carbohydrates Garcia et al gasified sawdust suspended in a starch gel for delivery to the reactor, in supercritical water [20]. A cement pump was used to feed the slurry. They found that a minimum temperature of 650°C was needed for complete gasification, 100°C higher than for glucose gasification. Antal et al. (2000) found that potato waste required no pre-treatment prior to gasification; however, Plugging at the reactor entrance was observed due to char formation [21].
3.2.1 Sewage Sludge
Municipal sewage sludge presents a significant environmental burden. Sludge or biosolids, is the
byproduct of conventional waste water treatment and must be disposed of either by land application as a fertilizer, landfilling or incineration. Approximately 55% of biosolids produced in the US is land applied [22]. Sludge contains a high moisture (96.5% - 99%) content and dewatering to lower moisture content (60% - 85%) is required to reduce the transportation costs of biosolids and make it acceptable for all disposal techniques [23] [24]. Sludge dewatering is a highly energy intensive process and it is estimated that up to 0.5% of the total electricity consumed in the United States is used for sludge treatment [25] [26] resulting in GHG emissions of more than 40 million tons annually [27].
Sludge contains a wide range of hazardous organic compounds, including polychlorinated biphenyls (PBCs), polycyclic aromatic hydrocarbons (PAHs), dioxins, pesticides and endocrine disrupting chemicals (EDCs) [28]. There are over 800 EDCs that have been identified and are associated with numerous health problems including cancer and issues with neurodevelopment and reproduction [29]. EDCs primarily include synthetic chemicals such as: industrial solvents/lubricants and their byproducts (polychlorinated biphenyls (PCBs), polybrominated biphenyls (PBBs), dioxins), plastics (bisphenol A (BPA)), plasticizers (phthalates), pesticides (methoxychlor, chlorpyrifos, dichlorodiphenyltrichloroethane (DDT)), fungicides (vinclozolin), and pharmaceutical agents (diethylstilbestrol (DES)) [30]. Current waste water treatment infrastructure is often not effective at the removal of many EDCs [31].
While still in development, SCWG has the potential to treat high moisture sludge, eliminating the need for dewatering, while at the same time thermo-chemically decomposing EDCs and other potentially harmful organics in the sludge, while at the same time efficiently producing hydrogen-rich syngas. Due to the severe conditions of supercritical processes, EDCs may be destroyed, which has been shown for other contaminants such as organics [32] and explosives [33]. Unlike other rapid conversion methods, SCWG can utilize high moisture feedstocks because the entrained water in the sludge itself can be used as a solvent medium for gasification at high temperature and pressure, avoiding energy intensive dewatering and the high quality syngas can be used directly for heat and power generation or for the production of transportation biofuels. Raw sludge is preferable to dewatered sludge for SCWG processes as increasing organic matter content leads to increasing solid char residue and phenols [34]. Therefore, SCWG is a process with immense potential to reduce GHG emissions as well as eliminate persistent environmental contaminants. Table 4 shows the results of SCWG of sewage sludge (80% moisture) [32].
Table 4: Effect of temperature on gaseous products of SCWG of sewage sludge [32]
Temperature (°C) 400 450 500 550 600 H2(mol%) 19.0 27.8 36.1 45.4 44.4
Temperature (°C) 400 450 500 550 600 CO (mol%) 5.2 2.2 1.3 0.8 0.5
CH4(mol%) 15.3 23.0 18.5 14.9 9.9
Total gas yield (mol/kg) 3.5 7.0 10.9 16.4 21.3
GE* (%) 10.4 17.2 24.9 32.9 37.0
CE** (%) 9.8 17.2 23.8 30.7 32.7
* Gasification Efficiency ** Carbon Conversion Efficiency
Effective destruction of organic components in supercritical water will require partial oxidation or the use of catalysts as SCWG alone has could leave upwards of 30% of organics in the water after treatment, for dewatered sludge [34]. Lin et al. (2017) found that even with the use of oxygen at a stoichiometric ratio of 1 (actual oxygen added: theoretical oxygen demand) the EDC Diethyl Phthalate was persistent after Supercritical Water Oxidation (SCWO) treatment [35]. A ratio of 1.5 is needed for complete conversion of organic molecules [36]. At a stoichiometric ratio of 1.0, hydrogen production is nearly zero [32], [35]. For effective treatment of sludge in SCWG, it is likely that both catalysts and partial oxidation will be necessary, or a sequential SCWG and SCWO process as proposed by Qian et al. (2015) and shown in Figure 10. SCWG of sewage sludge at 550°C followed by SCWO at 600°C and with a total stoichiometric ratio of 11.8 (based on the feed to SCWG), the Chemical Oxygen Demand (COD), Total Organic Content (TOC) and ammonia nitrogen (NH3-N) were reduced to 30 mg/L, 18 mg/L and 14 mg/L respectively from
pre-SCWO concentrations of 10876 mg/L, 6126 mg/L and 7209 mg/L [32]. It was also found that this combined process was more effective at removing organics than SCWO alone [32].
Figure 10: Schematic of a proposed sequential SCWG and SCWO process for treatment of waste water and generation of hydrogen rich gas: (1) feedstock tank; (2) high pressure meter pump; (3) natural gas furnace; (4) SCWG tubular reactor; (5) SCWG heat exchanger; (6) SCWG gas–liquid separator; (7) liquid oxygen tank;
(8) liquid oxygen pump; (9) vaporizer; (10) SCWO tubular reactor; (11) SCWO heat exchanger; (12) SCWO gas–liquid separator; (13) back pressure valve.
3.2.2 Pre-treatment
Pumping of non-slurry feedstocks to super-critical pressures can be a challenge making pre-treatment a necessity. Pre-treatment can include:
· Grinding / milling into very fine particles · Suspension in a gel
Hydrothermal liquefaction (HTL) is an advantageous method of pretreatment as the conditions are similar to SCWG, but can be undertaken at a lower pressure (4-22 MPa) [37], facilitating pumping of non-ideal feedstocks. HTL breaks down the structure of the hemi-cellulose dissolved in water, destroying the cell structure. Once the feedstock is liquefied, it can be more easily pumped to the high pressures required for SCWG. If the feed has a low water content or absorbs water, leaving only a small amount of “free-water” then thermal pre-treatment is necessary [38].
Particle size does not have a large effect on HTL and particles of 4-10 mm are suitable [39]. This is much larger than would be acceptable for SCWG. Minimizing the size reduction reduces energy input and cost of the system with grinding cost almost doubling with size reduction from 3.2 mm to 0.8mm [40].
Kato and Matsumura (2003) used mild hydrothermal liquefaction pre-treatment as a pretreatment for supercritical gasification of cabbage [41]. Pre-treatment at 150-200°C for 30 mins at 1.2 - 1.3 MPa. They found an inverse effect of the HTL pre-treatment temperature with pre-treatment at 150°C leading to improved gasification rate and efficiency, while pre-treatment at 200°C had a reverse effect, when subsequently gasified at 400°C, 25MPa.
There are possible disadvantages to hydrothermal pre-treatment in terms of conversion efficiency and gas yield. Yoshida and Matsumura (2001) found that more severely processed wood residue showed lowest activity and raw sewage sludge was best feedstock for SCWG [17].
3.3 Conditions
The products and conversion efficiency of SCWG are influenced primarily by: · Reactor temperature,
· Residence time, and · The system heating rate.
Table 5: Effect of key parameters on SCWG
Conversion Efficiency H2 CH4 CO Tar‡ Char‡
Temperature ↑ ↑ ↑ ↓ ↑↓† ↓‡ ↓‡
Pressure* ↑ -- ↑ ↑ -- --
--Feedstock Concentration ↑ ↓ ↓ -- ↑ ↑ ↑
Residence Time ↑ ↑ ↑ ↑ ↓ ↓‡ ↓‡
Heating Rate ↑ ↑ ↑ ↑ ↓ ↑‡ ↓‡
* For pressures above the critical point
† Increases then decreases
‡ There are conflicting results in literature about the effect of operating parameters on tar and char production
Lu et al. (2012) conducted a parametric study of SCWG operating conditions in a continuous flow tubular reactor SCWG systems. They found the order of significance of the parameters on H2 yield of SCWG of
corncob husks was: temperature (600 – 700°C) > pressure (22.5 – 27.5 MPa) > feedstock concentration (2 – 4 wt.%) > residence time (20 – 40 s) [42]. The ranges for the parameters in this study are limited, making definitive conclusions about the effects of these parameters difficult. As, well the greater
significance placed on the effect of pressure is likely due to its proximity to the critical point, around which significant changes to the reaction mechanism occur.
From the present analysis of literature on SCWG the order of significance is postulated to be: temperature > residence time > feedstock concentration > heating rate > pressure.
3.3.1 Pressure
Reactor pressure, above the critical point, has a smaller effect than other parameters. The primary effect of pressure is in the transition from sub to super critical conditions. The typical pressure range for SCWG experiments is 25-30 [43].
Pressure has minimal influence on product gas composition or gasification efficiency, including both sub and super critical pressures [44]. Lu et al. (2012) found that pressure caused an initial increase in H2 and
CH4 from 22.5 to 25 MPa and then decrease from 25 to 27.5 MPa [42]. The initial increase is likely due to
the shift from free-radical reactions around the critical point which favour pyrolysis reactions to ionic reaction mechanisms above the critical point which favour hydrolysis (gas forming) reactions [42]. The density of supercritical water increases with pressure reducing the interactions between reactant
molecules and forming a “cage” of solvent molecules [42]. This has the effect of reducing the interactions that lead to coking and polymerization reactions while favouring reforming and water-gas shift reactions [45].
3.3.2 Temperature
Gasification and carbon conversion efficiency increase with temperature [46]. These is no dramatic effect of increasing the temperature around the supercritical point of water where the temperature is relatively low (375°C) [17]. Low temperatures (< 280°C) lead to incomplete decomposition of biomass components [39]. As temperature increases (>350°C) tar production decreases due to secondary decompositions and Boudard gas reactions becoming active, and re-combination of free radical reactions leads to char formation due to high free radical concentration [39].
Below temperatures of 600°C very low carbon conversion / gasification efficiencies occur (Chakinala, 2010). Gasification efficiency steadily increases to asymptotic values around 700°C. Carbon conversion was near 100% at 725C, 4.6 wt.% glycerol feed [47]. Unconverted carbon typically becomes solid carbon deposits and lower temperatures lead to increases in carbon deposits [38]. Complete gasification at low temperature (300-600°C) is difficult without the use of catalysts [38].
Temperature has a large effect of product gas composition in the supercritical regime with the largest changes in compositional changes occurring between 500 and 700°C. Below 500°C CO2 and C2-C3
decrease with increasing temperature, CH4 and H2 slightly increase [46]. Figure 11 shows the effect of
temperature above 500°C on the product gas yield from simulations [44]. Above 660°C, it has been found that hydrogen yield increase sharply and at 700°C, carbon gasification efficiency reached 100% for a wide range of residence times (10 to 50 s) [10].
Figure 11: Simulated effect of temperature on gas yield at 25 MPa with 5 wt.% dry biomass content [44].
Sustani et al. (2012) found that increasing the temperature significantly increased the gas yield [48]. Hydrogen gas yield increased from 7.9 mol/mol glucose to 11.5 mol/mol glucose when the temperature was increased from 650 to 767°C. High hydrogen yields (10.5-11.2 mol/mol glucose) were found with 1.8 wt.% at 740°C, and yields were not significantly changed with a change in residence time. The maximum hydrogen yield (11.5 mol/mol glucose) was obtained at 1.8 wt.%, 25 MPa, and 767°C, with a gas
composition of 68.0 mol% H2, 29.4 mol% CO2, 1.7 mol% CH4, 0.9 mol% CO, and 0.09 mol% C2H6.
Glucose was nearly completely converted.
Ferreira-Pinto et al. (2015) observed that increasing the temperature increased the hydrogen produced and decreased the CO [49]. Increasing the temperature was important for the efficient reduction of TOC; increasing from 550 to 700°C increased the efficiency from 50% and 96%.
Antal et al. (2000) found that the reaction temperature had a significant effect on the gas composition and yield [21]. High entrance temperature resulted in a hydrogen-rich gas. Other parameters, such as
pressure and residence time, had less influence on the results.
Low temperatures (350-500°C) favours methane formation and high temperatures (500-800°C) favour hydrogen formation [2]. From Figure 11 it can be seen that hydrogen yield increases significantly when temperature is increased from 500 to 700°C at which point it hits an asymptotic value. As well, CO yield increases from 510 – 550°C, then slightly decreases to 600°C and decreases sharply above 650°C [47, 10]. D’Jesús et al. found that between 500 and 600°C, propane and butane were formed [50]. Increasing the temperature above 600°C led to the production of hydrogen and carbon dioxide or methane and ethane. Increasing temperature led to a decrease in the amount of carbon monoxide.
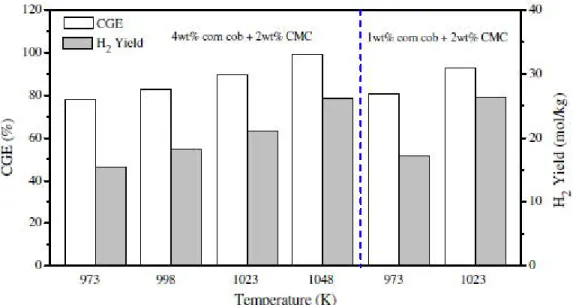
If hydrogen is desired temperatures above 600°C and pressure above 30 MPa are required [1]. The affinity for hydrogen production from SCWG makes it an attractive process for the sustainable production of hydrogen fuel. Hydrogen yield continues to increase with temperature, shown in Figure 12; however, the material constraints of the reactor and difficulty of heat transfer are likely to limit the temperature of industrial units to about 700°C.
Figure 12: Effect of high temperatures on the CGE and H2 yield of corn cob gasification (Lu et al. 2012)
In tubular reactors that are externally heated at low temperatures, endothermic reactions take place along reactor walls (treated SS) [8]. At high temperatures, endothermic reactions take place at the entrance and exothermic reactions along the wall [8].
3.3.3 Feedstock Concentration
Feedstock concentration has a large impact on gas yield and composition, with increasing dry biomass content leading to reduced gas yield, reduced hydrogen concentration and increased CO concentration shown in Figure 13 [44]. In a lower concentration / more dilute mixture there is a lower chance of intermediate products colliding and polymerizing to for char and tars. Hydrogen yield is maximum at the lowest feedstock concentration, shown in Figure 14 [42].
Figure 14: Effect of feedstock concentration on CGE and H2 yield from corn cob gasification [42].
Increasing feed concentration has shown to decrease gasification efficiency in tubular reactors with the opposite true for stirred reactors [51]. This is possibly due to faster heating rate of the stirred reactor or the presence of hydrogen back-mixing inhibiting unwanted polymerization via saturation of free-radicals [51].
3.3.4 Residence time
Residence time is defined as the time the feed stream is exposed to the desired SCWG conditions. The residence time for SCWG is in the range of 5 – 60 s. Often this does not include the time the feed stream in the pre-heater; however, the duration of pre-heating can have a significant impact on the products of SCWG. The residence time can be calculated based by equation 11 [46].
=
=
̇ (11)
Where V is the volume of the process unit, A is the cross sectional area, L is the length, Q is the
volumetric flow rate of the feed, and ṁ is the mass flow rate. The density of the solution will change along the length of the process unit due to the increasing temperature from the entrance to the exit and the changing composition of the solution; therefore, equation 11 becomes:
=
̇
∫
(12)Typically changes in solution composition are not taken into account and the density is only a function of temperature along the length of the reactor [46] and often this temperature is considered to be constant [43]. Yakaboylu et al. (2015) assume a linear temperature profile along the length of the reactor based on the inlet and outlet solution temperatures [46]. This assumption could also be used to calculate the density gradient due to changing solution composition in the reactor if the inlet and outlet compositions are known.
To remove the dependence of liquid density space time can be used. It is independent of reactor conditions and better reflects the operation of a full scale system. It is calculated by:
Where V is the reactor volume and V̇ is the flow rate under ambient conditions.
The Liquid Hourly Space Velocity (LHSV) is the inverse of the space time given by the volumetric flow rate of feed solution at ambient temperature and pressure divided by the volume of the reactor. This gives a feed flow rate independent of the conditions in the reactor is the Liquid Hourly Space Velocity (LHSV). As with space time, LHSV allows for easy comparison of different systems and better reflects the operation of a full scale system. Its effect on SCWG operation is the same as flow rate. LHSV is calculated by:
LHSV =
̇ (14)When a catalyst bed is used is the Weight Hourly Space Velocity (WHSV) which is the mass flow rate of the reactant in the aqueous feed per mass of catalyst in the reactor (gfeed / gcatalyst / hr) with units of hr-1
[52]. This variable requires that a heterogeneous catalyst bed is used, so limits the potential for
comparison with other studies. The effect of the WHSV on SCWG is the similar to the effect of flow rate; however, it is dependent on the catalyst loading, and can be used to measure the effectiveness of the catalyst. WHSV is calculated by:
WHSV =
̇ (14)Generally, gasification and carbon conversion efficiency increase with increasing residence time as the reactions go further to completion. The gas production and gas yield were improved with increasing residence time, but only up to a certain value (depending on temperature), after which the gas yield stops increasing, shown in Figure 15 [50]. Shorter residence times led to increased hydrogen and carbon monoxide concentrations in the produced gas, and decreased methane and ethane contents.
Figure 15: Gas yield as a function of increasing residence time / space time [50].
Lue et al. (2012) found the effect of residence time was minimal in the range between 20 – 60 s [53]. H2
increases and CO decreases with increased residence time [53]. These are considered long residence times for SCWG (> 20s), which in conjunction with high temperatures (> 600°C) are required for high gasification efficiency [54]. These residence times are much shorter than those required for hydrothermal liquefaction which are in the range of 20-60 mins [39].
Amrullah & Matsumura (2018) conducted SCWG of sewage sludge at 500-600°C and 25 MPa in a tubular reactor of 2.17 mm I.D. They found that increased residence time improved the conversion rate and efficiency in the range of 5 - 60 s; the cold gas efficiency increased from 59% to 73% [43]. Hydrogen composition decreases and methane increases with residence time, shown in Figure 16. The reason given was that longer residence time favoured the methanation reaction in equation 3. Carbon dioxide increases slightly with residence time.
CO + H2 ↔ CH4 + H2O Equation 1
Figure 16: Gas composition during SCWG of sewage sludge as a function of residence time at temperature of 600°C and pressure of 25 MPa [43]
500 °C, (b) 550 °C, and (c) 600 °C.
Yakaboylu et al. (2018) found an increase in residence time from 10 s (8.3 s in pre-heater, 1.7 s in reactor, 35 kg/h feed rate) to 16 s (13.5 s in preheater, 2.5 s in reactor, 24.5 kg/hr feed rate) increased carbon conversion efficiency from 47.4 to 73.9% and gasification efficiency from 46.6 to 72.9% in a pilot scale SCWG system [46]. As well, H2, CH4 and CO2 concentrations increased and CO decreased
significantly with decreasing flow rate, i.e. increasing residence time, as shown in Figure 17.
Figure 17: Effect of feed flow rate (residence time) on product gas composition, yield and conversion efficiency in a pilot scale SCWG system [46].
In practice achieving these high residence times could be accomplished by using a tubular reactor downstream of a fluidized bed reactor or a fluidized bed reactor with a larger diameter [46].
3.3.5 Heating Rate
For hydrothermal processes, a high heating rate is desired to increase gas yield and decrease tar and char yield [15] [39] [55]. Slow heating rates increase polymerization reactions leading to the formation of char and tar by-products and reducing gas production.
Gas yield increases with heating rate from 1K/min to 3 K/min [15]. Studying the SCWG of glucose Sinag et al. (2004) found that H2 production increased by 95%, CH4 by 21%, CO2 by 59% and CO decreased by
74% without the presence of a catalyst. This was determined to be the result of higher heating rates causing a decrease in intermediate liquid i.e. furfurals and phenols, as can be seen in Figure 8. Antal et al. (2000) also found that increased heating rate favoured hydrogen formation [21]. Slower heating rate favours the formation of refractory compounds, i.e. acetic acid, resulting in higher methane production and reduced hydrogen production. In this study heating rate was dependent on the peak temperature, high peak temp = higher heating rate, so results may be confounded.
Matsumura et al. (2006) suggested that very high heating rates of 10 – 30 K/s (600 – 1800 K/min) are needed to achieve sufficiently high carbon conversion efficiencies (>80%), shown in Figure 18 [56].
Figure 18: Effect of heating rate on carbon conversion efficiency of cabbage slurry, adapted from [56].
Hendry et al. (2010) instantaneously heated a glucose feed stream by mixing it with supercritical water [57]. The gasification of glucose was almost six times faster than previous experiments. Increasing the temperature from 750 to 800°C increased the gasification efficiency by 29%, increased the gasification rate by 8 g/Ls, and increased the hydrogen and methane yields. Increasing the feed concentration from 10 to 15 wt. % decreased the efficiency by 30% and the hydrogen and carbon yields but did not
significantly change the gasification rate. Decreasing the residence time from 6.5 s to 4 s in the reactor had no effect on the yield, but decreased the efficiency by 9% and increased the gasification rate by approximately 8 g/Ls.
Heating rate is effected by the maximum temperature, method of heating and flow rate of liquid feed. In practical applications the heating rate would be controlled by adjusting the feed flow rate into the reactor or pre-heater. Thus there would be a balance between heating rate and residence time for a given reactor volume, with increased flow increasing the heating rate but decreasing the residence time for a given reactor size. Thought must be given during reactor design to this balance.
3.3.6 Catalysts
The use of catalysts allows for the use of lower temperatures to achieve the same conversion efficiency, gas yield and low char/tar formation [2]. Catalysts inhibit the polymerization of intermediates and promotes their conversion to gas [58, 13].
Heterogeneous catalysts are preferred as they can be easily extracted from the liquid product; however, the range of available catalysts is limited as metals are readily oxidized [59]. Stable metals can be used and some potential heterogeneous catalysts include:
· Ruthenium · Nickel · Zirconia · Carbon
Ruthenium on rutile titania extrudate has been found to be particularly effective [58]. At near supercritical conditions (21 MPa, 350°C) total conversion of organic matter to gases has been performed using a ruthenium catalyst [60]. Zirconia catalyst doubled gasification efficiency, but was not as effective as a sodium carbonate homogeneous catalyst [61].
Nickel catalyst increased the reaction rate by 3.3 times from 0.0003 to 0.001, during phenol gasification at 600°C in a quartz capillary tube [62]. Higher phenol loading accelerated the degradation rate.
When using a very low heating rate (1 K/min), the use of a nickel based catalyst (1wt.% Raney Nickel) decreased CO to zero, increased H2 by 67%, CO2 by 74% and CH4 by 95% at 500°C and 30 MPa;
however, the effect of the nickel based catalyst is reduced or eliminated at higher heating rates (3 K/min), shown in Figure 19 [15]. Sinag et al. 2004 suggested a change in the reaction mechanism dependent on the presence of catalysts or heating rate on product formation, shown in Figure 8.
a) b)
Figure 19: Effect of catalysts on the product yield from SCWG of glucose at 500C and 30 MPa at a heating rate of a) 1 k/min and b) 3 K/min [15].
Carbon reacts with water at high temperature and pressure, but the rate is sufficiently low under typical SCWG conditions that it can be used as a catalyst [63]. Carbon catalysts improved gasification efficiency for all feed compounds tested [64].
In near supercritical experiments nickel based catalyst have shown mixed results and in one study did not lower the temperature at which cellulose decomposition occurred [13]. The nickel based catalyst did have other beneficial effects including: increased CH4 production, no CO production, minimal oil and tar yields,
and increased gas yield. Gas yield was found to increase linearly with catalyst loading between 5 and 20 wt.% [13].
In addition to catalyst selection, attention must be paid to selection of the catalyst support. Silica and alumina catalyst supports are severely degraded in high pressure hot wat and cannot be used as catalyst supports [65]. Supports such as titania, zirconia or carbon are more stable.
Homogeneous catalysts have also been extensively investigated with homogeneous alkali catalysts such as sodium carbonate of particular interest. Sodium carbonate was found to inhibit char formation at 350°C [66]. The use of alkaline catalysts (NaOH and KOH) and carbonate (Na2CO3) at low temperatures
reduced char formation and promoted hydrogen production [49]. KOH increased hydrogen yield and decreased CO during catechol (lignin model compound) during SCWG at 400°C [67]. 99% of catechol was gasified at 600°C and 2 min reaction time or 700°C and 1 min and the resulting gas composition was close to the predicted equilibrium.
Alkali salts (KCO3, Na2CO3) catalyze the water gas-shift reaction, leading to increased gas yields,
increased H2 and CO2 yields, drastically reduced furfural formation and decreased coke / char formation
[1]. Other researchers have found similar results with no only added alkali salts, but salts present in the biomass increases gas yield, reduces CO and increasing H2 and decreases coke formation [68]. The
presence of minerals in the feedstock can have a similar catalytic effect on SCWG of biomass. This leads to some of the large differences in results seen between SCWG experiments conducted with glucose and biomass feedstocks.
The main challenge with homogeneous catalysts is recovering the catalyst. Other challenges of using alkali catalysts is increased corrosion of the reactor walls [1] and potential plugging of the reactor as some alkali salts will come out of solution in supercritical water [68]. Also, the presence of salts in the feedstock can damage heterogeneous catalysts.
Another consumable homogeneous catalyst being explored is hydrogen peroxide. Gasification efficiency improved with the addition of hydrogen peroxide as an oxidizer; however, cold gas efficiency decreased when hydrogen peroxide was too high [17].
3.4 By-Products
For SCWG the desired product is a gaseous mixture with a significant concentration of combustible gases: H2, CH4 and CO. This mixture can then be used as is for conversion to electrical energy in a
turbine or internal combustion engine generator or further refined / separated to produce gaseous or liquid fuels. The undesired products of this process are liquid tars and condensable hydrocarbons, and solid char. This is contrary to HTL processes which aim to produce tar and condensable hydrocarbons that can be refined to liquid fuels. At temperatures below the critical point there are low gas yields and high furfural yield, gas yields increase and furfurals decrease above the critical point [69].
There are conflicting results in the literature as to the effect of different parameters on tar and char yield, often depending on the reactor type and scale. Yakaboylu et al. (2018) found that tar yield increases with increasing reactor temperature in a pilot scale system; char yield does not show a clear relationship with temperature (500-600°C, 24.4 MPa), shown in Figure 20 [46]. This is likely an artifact of the system design. When the temperature is high in the reactor, the pre-heater section operates at near-critical
conditions (350°C - 375°C), ideal conditions for hydrothermal liquefaction [46]. A high heating rate from ambient to supercritical temperatures is needed to avoid the feed dwelling at conditions ideal for HTL.
Figure 20: Effect of reactor conditions on char and oil yield from a demonstration scale SCWG system [46].
These results conflicts with other studies that show that increased temperature reduces tar formation. This is the intuitive result, as an increase in temperature should favour endothermic tar reforming reactions. Many of the published studies investigate SCWG in electrically heated batch reactors. These systems lead to very slow heating rates that vary with maximum temperature, producing excess tar and confounding the results of heating rate and maximum reactor temperature.
As can be seen in Figure 20, tar yield also increases significantly with decreased residence time; char yield is somewhat increased [46]. Longer residence time allows char and oil pre-cursors to spend more time at higher temperature and get converted to gaseous products. Higher heating rates also lead to increased tar and decreased char production [46]. These results are similar to findings from reactions at sub-critical conditions where high heating rates and low residence times promote tar production [37]. One of the more difficult tars to decompose once it has formed is phenol. It has been found that phenol yield increase with increasing temperature [12]. So, to avoid tar production, phenol formation pathways should be avoided, see Figure 8 and Figure 9.
Reactor
There are a wide variety of reactor types used for experimental studies on SCWG including diamond anvil cells, micro-capillaries reactors, high pressure batch reactors and tubular semi-continuous systems. Due to the lack of commercial operations, the optimal reactor design for commercial application has not yet been determined [38]. This section discusses bench scale and lab scale reactor design benefits and disadvantages. Individual reactor designs used in current experimental trials can be found in section 5.
4.1 Bench Scale
Diamond Anvil Cells (DACs) provide a safe and relatively easy method to study supercritical systems at very high pressures up to 3000 MPa and temperatures up to 800°C [70]. The small scale and
transparency of DACs make them well suited for in-situ optical analysis i.e. electron microscopy, high speed cameras, high energy particle analysis, for studying structural changes and reaction mechanisms in real time. Figure 21 shows the schematic of a DAC.
Figure 21: Hydrothermal diamond anvil cell schematic [70].
Sealed, quartz micro-capillaries allow high speed and inexpensive batch testing with possible visual observations [56]. Their small size allows for rapid heating through submersion in a heated bath or furnace and makes the experiments very save. They are typically used to determine the kinetics or reaction mechanism of different feedstocks or homogeneous catalysts. Quartz is inert and has little effect on the reaction kinetics unlike metal reactors [38]. As well, the reaction products are clearly visible. Their main drawback is that pressure inside the capillary cannot be measured, but it is derived from the implied temperature. Product gas is very difficult to capture and measure. As well, the feed must be in solution or very finely ground to load into the capillary.
Small, batch Continuous Stirred Tank Reactors (CSTRs) are the favoured reactor for SCWG experiments, but their large thermal inertia limits the heating rate significantly [56]. If the heating rate is slower than the gasification rate then the conversion will take place at undefined temperatures. Stirred tank reactors have not been considered for scale-up as a stirred tank reactor requires a larger volume than a tubular reactor [38]. One benefit of batch reactors is that carbon conversion increases at lower biomass concentrations, which would be found in stirred tank reactors; however, this could affect results and make them less applicable for scale-up.
![Figure 6: Gas composition of hydrothermal glucose decomposition as a function of temperature, 28 MPa, 30 s residence time and 0.6 M glucose feed [10].](https://thumb-eu.123doks.com/thumbv2/123doknet/13983503.454457/17.918.261.667.108.440/figure-composition-hydrothermal-glucose-decomposition-function-temperature-residence.webp)
![Figure 7: Proposed mechanism of glucose decomposition in sub and super-critical water by [14].](https://thumb-eu.123doks.com/thumbv2/123doknet/13983503.454457/20.918.120.803.109.788/figure-proposed-mechanism-glucose-decomposition-super-critical-water.webp)
![Figure 8: Glucose decomposition pathways and the effect of catalysts and heating rate [15].](https://thumb-eu.123doks.com/thumbv2/123doknet/13983503.454457/21.918.194.726.109.389/figure-glucose-decomposition-pathways-effect-catalysts-heating-rate.webp)
![Figure 9: A simplified reaction mechanism for the hydrothermal gasification of woody biomass, “cat.” refers to the use of a catalyst; 5-NHF to hydroxymethyl furfural [16].](https://thumb-eu.123doks.com/thumbv2/123doknet/13983503.454457/22.918.131.800.117.443/simplified-reaction-mechanism-hydrothermal-gasification-catalyst-hydroxymethyl-furfural.webp)
![Figure 11: Simulated effect of temperature on gas yield at 25 MPa with 5 wt.% dry biomass content [44].](https://thumb-eu.123doks.com/thumbv2/123doknet/13983503.454457/27.918.247.677.117.412/figure-simulated-effect-temperature-yield-mpa-biomass-content.webp)
![Figure 14: Effect of feedstock concentration on CGE and H 2 yield from corn cob gasification [42].](https://thumb-eu.123doks.com/thumbv2/123doknet/13983503.454457/29.918.214.707.108.373/figure-effect-feedstock-concentration-cge-yield-corn-gasification.webp)
![Figure 15: Gas yield as a function of increasing residence time / space time [50].](https://thumb-eu.123doks.com/thumbv2/123doknet/13983503.454457/30.918.242.665.630.916/figure-gas-yield-function-increasing-residence-time-space.webp)
![Figure 16: Gas composition during SCWG of sewage sludge as a function of residence time at temperature of 600°C and pressure of 25 MPa [43]](https://thumb-eu.123doks.com/thumbv2/123doknet/13983503.454457/31.918.285.637.284.548/figure-composition-sewage-sludge-function-residence-temperature-pressure.webp)
