HAL Id: hal-02509638
https://hal.archives-ouvertes.fr/hal-02509638
Submitted on 17 Mar 2020
HAL is a multi-disciplinary open access
archive for the deposit and dissemination of
sci-entific research documents, whether they are
pub-lished or not. The documents may come from
teaching and research institutions in France or
abroad, or from public or private research centers.
L’archive ouverte pluridisciplinaire HAL, est
destinée au dépôt et à la diffusion de documents
scientifiques de niveau recherche, publiés ou non,
émanant des établissements d’enseignement et de
recherche français ou étrangers, des laboratoires
publics ou privés.
The influence of the recycling stress history on LDPE
waste pyrolysis
João Vitor F. Duque, Márcio F. Martins, Gérald Debenest, Marcos Tadeu
D’azeredo Orlando
To cite this version:
João Vitor F. Duque, Márcio F. Martins, Gérald Debenest, Marcos Tadeu D’azeredo Orlando. The
influence of the recycling stress history on LDPE waste pyrolysis. Polymer Testing, Elsevier, 2020,
86, pp.106460. �10.1016/j.polymertesting.2020.106460�. �hal-02509638�
OATAO is an open access repository that collects the work of Toulouse
researchers and makes it freely available over the web where possible
Any correspondence concerning this service should be sent
to the repository administrator:
tech-oatao@listes-diff.inp-toulouse.fr
This is an author’s version published in:
https://oatao.univ-toulouse.fr/25715
To cite this version:
Duque, João Vitor F. and Martins, Márcio F. and Debenest,
Gérald and Orlando, Marcos Tadeu d’Azeredo The influence
of the recycling stress history on LDPE waste pyrolysis.
(2020) Polymer Testing, 86. 106460. ISSN 0142-9418
Official URL:
https://doi.org/10.1016/j.polymertesting.2020.106460
Open Archive Toulouse Archive Ouverte
Material Behaviour
The influence of the recycling stress history on LDPE waste pyrolysis
João Vitor F. Duque
a,b,c, Márcio F. Martins
b,∗, Gérald Debenest
c,
Marcos Tadeu D’Azeredo Orlando
daFederal Institute of Education, Science and Technology of Espírito Santo, Serra, 29173-087, Brazil
bLaboratory of Combustion and Combustible Matter (LCC), PPGEM, Federal University of Espírito Santo, Vitória, 29075-910, Brazil cInstitut de Mécanique des Fluides de Toulouse (IMFT) - Université de Toulouse, CNRS-INPT-UPS, Toulouse, 31400, France dFederal University of Espírito Santo, Vitória, 29075-910, Brazil
A B S T R A C T
It is elementary to recognize the benefits and the negative impacts of the use of plastic materials on modern societies. Polyethylene (PE) is the major plastic component present in the municipal solid waste. In this paper, two types of low-density PE (LDPE) waste with different mechanical recycling stress histories were used to investigate the influence of recycling cycles on pyrolysis. The kinetic triplet and thermal degradation study were obtained using TGA data.To determine the sample composition and hydrocarbon arrangements, ultimate, proximate and X-ray diffraction analyses were carried out. Taking advantage of these analyses and combining them with differential scanning calorimetry (DSC) data, a series–parallel pyrolysis pathway was formulated. The waste of recycled polyethylene presented low enthalpy of pyrolysis, at about 205 J/g against 299 J/g for a virgin PE. The DSC analyses evidenced a multi-step reaction behavior of the pyrolysis, confirmed by the kinetic study using different isoconversional methods: the waste of recycled polyethylene presented a higher variation of activation energies as a function of the fraction reacted. The main conclusion is that the results suggest that the recycling stress history promotes the increase of long carbon chains while weakening the boundary among the compounds. This explains the fact that recycled waste needs less activation energy than other samples to degrade thermally. Finally, different categories of low-density polyethylene wastes must be considered when dealing with either kinetics or modeling of the product recovery process.
1. Introduction
It is elementary to recognize the benefits and, of course, the negative impacts of the use of plastic materials on modern societies. The global production of plastic materials has grown drastically. According to a European report [1], world plastic production has increased by around 40% in the last 10 years and polyethylene (PE) is the major plastic component present in municipal solid waste (MSW) streams. In general, polyethylene accounts for 43% of the total plastic fraction present in MSW [2]. This is the reason for the rising processes of converting polyethylene waste into useful products [3 9]. Since these processes are supposed to convert waste plastics, some characteristics such as density and additives are well known to affect i.e. the rate of conversion and yields of products recovered [10 12]. Another characteristic might play an important role in the conversion processes: the physical stress history experienced by the waste in mechanical recycling. This process typically involves mechanical (separation, grinding, washing, aggluti nation) and thermal stress (drying, extrusion, and quenching) [3,13,
14].
The polyethylene materials entering the mechanical recycling pro cess can be described by the stream in Fig. 1. The virgin PE (VPE) pellets are used as raw material where noble plastic products are man ufactured. Inside the industry is generated plastic residue that is well suited for the mechanical recycling process. The main part of plastic wastes is mostly generated by the final consumer. Depending on the infrastructure of each country, the plastic wastes can follow different paths (solid waste management cycle, landfills or waste pickers). The recycled material returns to manufacturing as feedstock producing less noble plastic products such as garbage bags and various packaging. Therefore, two categories of wastes are commonly generated: waste of virgin polyethylene (WVPE) and waste of recycled polyethylene (WRPE). In that way, the mechanical recycling process continues until the plastic waste previously recycled cannot be reused anymore.
Isoconversional methods are commonly used to evaluate the de composition kinetics of polyethylene. The best known methods rec ommended by the International Confederation for Thermal Analysis
Table 1
Experimentation details of PE samples.
Name of experiment Make Operating conditions Reference TGA STA 449F3 — NETZSCH Sample mass: 10–15 mg ISO 11358
Crucible: Al2O3 DIN 51006
Carrier gas: N2, Air, 60 ml/min
Temperature range: 20–670◦C
Heating rates 𝛽: 5, 10, 15, and 20◦C/min
XRD ULTIMA IV — RIGAKU CuK alpha radiation: average length 𝜆 = 0.15419
Souza et al. [36] Theta/2-theta Bragg–Brentano
geometry
2-theta data range: 5.00◦to
125.00◦
Step size: 0.02◦
CuK alpha doublet: wavelengths of 0.154056 (65%) and 0.154439 (35%) nm.
Radiation detector: LiF monochromator
Ultimate analysis EA 1110 — CE Default settings aASTM D5373-16
Proximate analysis Muffle furnace Moisture and ash: Weight loss ASTM D3173/D3173M-17a/D3174-12 Volatile matter:bby difference –
DSC SDT Q600 — TA Sample mass: 20 mg ASTM E-2160 Crucible: Al2O3
Carrier gas: N2, Air, 50 ml/min
Temperature range: 20–570◦C
Heating rate 𝛽: 20◦C/min aThere is no specific standard for PE.
bBased on the assumption that all the carbon and hydrogen, except for the moisture and ash contents, form the volatile matter matrix.
2.3. Data processing
The rate of non isothermal solid decomposition, 𝑑𝛼∕𝑑𝑡, registered by TGA can be expressed in terms of the rate constant, 𝑘(𝑇 ), and the reaction model, 𝑓 (𝛼), Eq. (1). The rate constant represents the dependence of the process rate on temperature and is parametrized through the Arrhenius equation, Eq.(2). The reaction model represents the dependence on the fraction reacted, 𝛼, Eq.(3), which is determined experimentally as a fraction of the total mass loss during the process.
𝑑𝛼 𝑑𝑡 = 𝑘(𝑇 )𝑓 (𝛼) (1) 𝑘(𝑇 ) = 𝐴𝑒𝑥𝑝(− 𝐸 ℜ𝑇 ) (2) 𝛼= 𝑚0− 𝑚𝑖 𝑚0− 𝑚𝑓 (3) where 𝐴 and 𝐸 are kinetic parameters, the pre exponential factor, and the apparent activation energy, respectively, ℜ is the universal gas constant, 𝑇 is the absolute temperature, and 𝑚𝑖, 𝑚0, and 𝑚𝑓 represent
the instantaneous, initial, and final masses of the sample, respectively. Combining Eqs. (1) and (2) leads to Eq. (4), that is limited to describe the rate of decomposition of a single step process [33,37]. For constant heating rate non isothermal conditions (𝛽 = 𝑑𝑇 ∕𝑑𝑡), Eq.(4)
can be written in the form of Eq.(5).
𝑑𝛼 𝑑𝑡 = 𝐴𝑒𝑥𝑝 ( − 𝐸 ℜ𝑇 ) 𝑓(𝛼) (4) 𝛽𝑑𝛼 𝑑𝑇 = 𝐴𝑒𝑥𝑝 ( − 𝐸 ℜ𝑇 ) 𝑓(𝛼) (5)
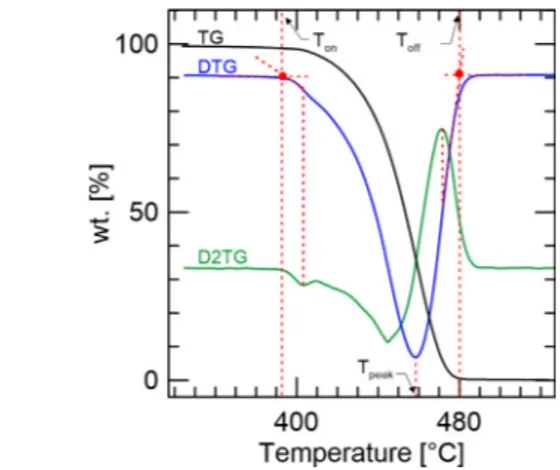
The degradation characteristics of VPE, WVPE, and WRPE were quantified through several parameters. Onset and offset temperatures, T𝑜𝑛 and T𝑜𝑓 𝑓, related to the start and end of the sample thermal conversion, were obtained from the TGA, its derivatives, DTG, and second time derivatives curves as the scheme demonstrated inFig. 3.
Fig. 3. Method used to determine the onset, offset, and peak temperatures.
The onset temperature was determined by extrapolating the slope of the DTG curve in correspondence with the first peak in second time derivatives curves and up to the zero levels of the DTG axis. The same procedure was used to determine the offset temperature, in this case, picking up the last peak in second time derivatives curves [28,38 40]. The peak temperatures, T𝑝𝑒𝑎𝑘, related to the maximum rate of sample degradation, were obtained from DTG curves and correspond to the temperature of their peaks. The total mass losses, 𝛥𝑚, were
obtained from the difference between the initial mass and the mass after pyrolysis.
From the DSC data, the enthalpies of reactions were calculated by integrating the areas of the curves (heat flux versus time interval) using scientific graphing and data analysis software [41]. For that, an isothermal baseline was constructed based on the second derivative of the DSC signal; ergo, the onset and end temperatures of melting and pyrolysis were determined [38].
The diffraction patterns were analyzed using Fityk software, ver sion 0.9.8.57 [41]. Phase identification was performed through the
Hanawalt method [42 44] using the Crystallography Open Database (COD) [45] and PDF 2 database [46]. The quantification of the phases
was performed with Rietveld refinement using the FullProf program [47].
2.4. Isoconversional methods
Isoconversional methods are an effective tool that can be used to solve Eq. (4)or Eq. (5)and determine the kinetic parameters as a function of the fraction reacted. These methods are based on the assumption that the rate of decomposition, at a constant value of 𝛼, is only a function of the temperature [37]. Taking into account the methodology adopted, the isoconversional methods can be separated into two main categories: differential and integral.
A widely used differential isoconversional method, based on the logarithm of Eq. (4) or Eq. (5), is the Friedman method [15], Eq. (6). By plotting ln (𝛽𝑑𝛼∕𝑑𝑇 ) against 1∕𝑇 , the kinetic parameters can be calculated from the slope at each given 𝛼. It is important to point out that, although the differential methods do not use any approximation, they are very sensitive to experimental noises.
ln(𝑑𝛼 𝑑𝑡 ) = ln(𝛽𝑑𝛼 𝑑𝑇 ) = ln [𝐴𝑓 (𝛼)] − 𝐸 ℜ𝑇 (6)
On the other hand, the variables in Eq.(5)can be separated and on integration gives Eq.(7)
𝑔(𝛼)≡ ∫ 𝛼 0 𝑑𝛼 𝑓(𝛼)= 𝐴 𝛽∫ 𝑇 0 𝑒𝑥𝑝(− 𝐸 ℜ𝑇 ) 𝑑𝑇 (7)
where 𝑔(𝛼) is the integral form of the reaction model. The integral in Eq.(7)does not have an analytical solution and several approximations can be found in the literature [33,37]. Generally, the approximate solutions are represented by the general equation:
ln ( 𝛽 𝑇𝐵 ) = 𝑐𝑜𝑛𝑠𝑡 − 𝐶( 𝐸 ℜ𝑇 ) (8) where 𝐵 and 𝐶 are the parameters determined by the type of tempera ture integral approximation. Worth noting that the approximation used is directly related to the accuracy of the integral method.
Three different approaches, integral isoconversional methods, were considered in the present work: Starink, Eq.(9)[22]; Kissinger Akahira Sunose, Eq. (10) [20,21]; and Ozawa Flynn Wall, Eq.(11)[16 19]. ln ( 𝛽 𝑇1.92 ) = 𝑐𝑜𝑛𝑠𝑡 − 1.0008( 𝐸 ℜ𝑇 ) (9) ln ( 𝛽 𝑇2 ) = ln ( 𝐴ℜ 𝐸𝑔(𝛼) ) − 𝐸 ℜ𝑇 (10) ln (𝛽) = ln ( 𝐴𝐸 ℜ𝑔(𝛼) ) − 5.331 − 1.052 𝐸 ℜ𝑇 (11)
The left hand side of each method was plotted against 1∕𝑇 for each experimental TGA data and the kinetic parameters were calculated from the slope of the straight lines fitted at each common value of 𝛼.
2.5. Reaction model
The dependence of the decomposition process on the fraction re acted can be expressed by using a wide variety of reaction models, each of these with a characteristic reaction profile [37]. The Criado method [28,33,48,49] was used to determine the kinetic model able to describe the pyrolysis of each material investigated. The method is based on an approximate solution of the integral in Eq.(7)and leads to the construction of a generalized master plot. The relationship between the experimental data recorded under non isothermal conditions, the generalized reaction rate, and the differential and integral forms of
Table 2
Algebraic expressions of the most widely used theoretical solid-state reaction models.
Model Code 𝑓(𝛼) 𝑔(𝛼) Power-law 𝑃𝑛a 𝑛𝛼(𝑛−1∕𝑛) 𝛼(1∕𝑛) Zero-order 𝐹0 1 𝛼 First-order 𝐹1 1 − 𝛼 −𝑙𝑛(1 − 𝛼) Second-order 𝐹2 (1 − 𝛼)2 [1∕(1 − 𝛼)] − 1 Third-order 𝐹3 (1 − 𝛼)3 [1∕(1 − 𝛼)2] − 1 Avrami–Erofeev 𝐴𝑛b 𝑛(1 − 𝛼)[−𝑙𝑛(1 − 𝛼)]1−1∕𝑛 [−𝑙𝑛(1 − 𝛼)]1∕𝑛 Contracting geometry 𝑅𝑛c 𝑛(1 − 𝛼)1−1∕𝑛 1 − (1 − 𝛼)1∕𝑛 One-dimensional diffusion 𝐷1 (1∕2)𝛼−1 𝛼2 Two-dimensional diffusion 𝐷2 [−𝑙𝑛(1 − 𝛼)]−1 (1 − 𝛼)𝑙𝑛(1 − 𝛼) + 𝛼 Three-dimensional diffusion 𝐷3 (3∕2)(1 − 𝛼)2∕3[1 − (1 − 𝛼)1∕3]−1 [1 − (1 − 𝛼)1∕3]2 Ginstling– Brounshtein 𝐷4 (3∕2)[(1 − 𝛼)−1∕3− 1]−1 1 − (2𝛼∕3) − (1 − 𝛼)2∕3 Prout–Tompkins 𝐵1 𝛼(1 − 𝛼) 𝑙𝑛[𝛼∕(1 − 𝛼)] Exponential-law 𝐸1 𝛼 𝑙𝑛(𝛼) a𝑛= 2∕3, 2, 3, 4. b𝑛= 2, 3, 4. c𝑛= 2, 3.
the theoretical solid state reaction models,Table 2[33,37,50], can be described by Eq.(12). ( 𝑇 𝑇0.5 )2 (𝑑𝛼∕𝑑𝑡) (𝑑𝛼∕𝑑𝑡)0.5 = 𝑓(𝛼) 𝑔 (𝛼) 𝑓(0.5) 𝑔 (0.5) (12) The equation above is normalized taking 𝛼 = 0.5 as a reference, being 𝑇0.5 and (𝑑𝛼∕𝑑𝑡)0.5, at the left hand side, and 𝑓 (0.5) and 𝑔(0.5),
at the right hand side, the temperature, the reaction rate and the conversion functions corresponding to 50% conversion.
The most suitable kinetic model is determined by the best match between the plot of the generalized reaction rate vs. the fraction reacted and the plots of the theoretical models. The Root Mean Square Error (RMSE), Eq. (13), was used to measure how much error there is between the curves, assisting identify the best correspondence.
𝑅𝑀 𝑆𝐸= √∑ 𝑛 𝑖=1 [ (𝑑𝛼∕𝑑𝑡)𝑒𝑥𝑝− (𝑑𝛼∕𝑑𝑡)𝑚𝑜𝑑𝑒𝑙 ]2 𝑛 (13)
3. Results and discussion
3.1. Thermogravimetric analysis (TGA)
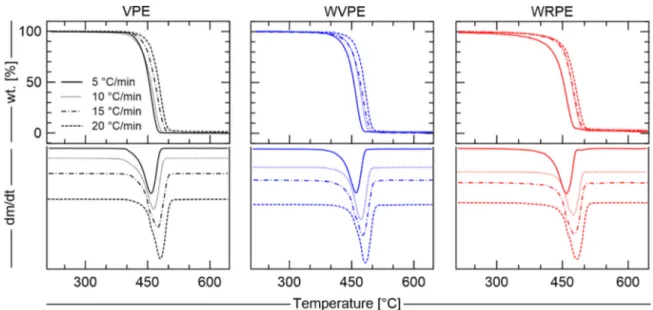
TGA and DTG results under inert atmosphere are summarized in
Fig. 4. In this figure, each column contains the respective decom position profile of VPE, WVPE, and WRPE at four different heating rates.
The heating rates were strategically chosen to cover the influence of a wide range of temperatures on PE degradation. The samples of virgin and recycled PE when subjected to pyrolysis, at all heating rates, lose almost all the mass in a single step. The heating rate increase resulted in a lateral shift of the curves along the abscissa without changing its shape. The initial mass, onset temperature, offset temperature, peak temperature at maximum degradation rate, and the total mass losses after pyrolysis are presented inTable 3.
3.2. X ray diffraction analysis
Fig. 5shows the X ray powder diffraction patterns for all samples. The compounds quantification was performed based on the volumetric proposition of the structures found in a sample volume of 1 mm x 10 mm x 0.005 mm. The mass proportion of the phases depends on the determination of the true density (crystallographic) of the phases
Fig. 4. Polyethylene thermogravimetric analysis under inert atmosphere and its derivatives.
Fig. 5. X-ray powder diffraction pattern. Table 3
Polyethylene thermogravimetric analysis: initial mass, onset, offset, and peak temperatures and total mass losses.
Sample 𝛽[◦C/min] m 𝑖[mg] T𝑜𝑛[◦C] T𝑜𝑓 𝑓 [◦C] T𝑝𝑒𝑎𝑘[◦C] 𝛥𝑚[wt.%] VPE 5 13.3 392 480 458 99.9 10 12.3 387 488 465 99.9 15 13.2 396 500 475 99.9 20 12.7 405 504 481 99.9 WVPE 5 14.6 376 484 461 98.8 10 10.9 384 496 473 99.7 15 14.0 388 502 477 99.9 20 14.1 394 506 483 99.8 WRPE 5 13.4 357 480 459 98.9 10 13.1 367 497 475 96.8 15 13.4 367 502 477 98.0 20 12.9 367 507 483 97.7
present. The uncertainty volume value proposed for each phase found, as considered the volume measured by XRD, is limited to 2% taken into account the copper radiation (CuKa, 0.15419 nm), the Bragg Brentano geometry, 0.5◦ divergent slit, 0.5◦ scattering slit and LiF
monochromator.
It was possible to identify and quantify the chemical compounds of all samples without considering the amorphous phase. The average crystallinity was 48%, 51%, and 54% for VPE, WVPE, and WRPE
Table 4
All samples content available by X-ray diffraction pattern analysis, values in vol.%.
Compound name VPE WVPE WRPE
n-Paraffin (CH2)𝑥 10.1 – – Paraffin wax (C - H) 4.9 – – n-Heptadecane (C17H36) – 2.3 – n-Tricosane (C23H48) – – 4.8 n-Nonacosane (C29H60) 4.2 15.8 16.4 Pentatriacontane (C35H72) 80.8 – – n-Tetracontane (C40H82) – 81.9 78.8
Uncertainty volume value is limited to 2%.
respectively. The analysis indicated that the main chemical compounds of crystalline phase of VPE were pentatriacontane (C35H72) and n
paraffin (CH2)𝑥, while the main compounds of the recycled samples
were n tetracontane (C40H82) and n nonacosane (C29H60) (Table 4).
The data collection details can be shown as supplementary material, Appendix A.
As one can observe inTable 4, the results suggest that the recycling stress history promotes the increase of long carbon chains in WVPE and WRPE compared to VPE. The cause might be the combination of thermal and extrusion stress experienced by the PE in the cycles of recycling.
3.3. Ultimate and proximate analyses
The results indicate mainly the presence of carbon and hydrogen for all samples. Small percentages of other elements, apart from CHNS, are present in the recycled samples: 0.3 and 2.0 wt% in WVPE and WRPE, respectively. The samples were found to be non hygroscopic materials and only a small amount of moisture, around 0.2 wt%, was found in WVPE and WRPE. When compared to VPE, the WRPE samples presented an approximately threefold relative increase in ash content, from 0.3 to 1.0 wt%. The results of ultimate and proximate analyses are listed inTable 5.
3.4. Differential Scanning Calorimetry (DSC)
Analyzing the DSC curves under pyrolysis conditions,Fig. 6, two en dothermic peaks are observed for all samples. The first one is assigned to the melting point and confirmed by checking TGA under nitrogen where no mass loss is identified in the temperature range of the first
Fig. 6. Polyethylene differential scanning calorimetry under inert and oxidative atmospheres at 20◦C/min, the heat flows.
Table 5
Polyethylene samples ultimate and proximate analyses, values in wt.%.
Component VPE WVPE WRPE
C 85.7 ± 0.8 85.4 ± 0.1 84.3 ± 0.1 H 14.3 ± 0.2 14.3 ± 0.3 13.7 ± 0.3 N 0.0 0.0 0.0 S 0.0 0.0 0.0 Other elementsa 0.0 0.3 ± 0.3 2.0 ± 0.3 Moisture 0.0 0.2 0.2 Ash 0.3 0.4 1.0 Volatile mattera 99.7 99.4 98.8
aObtained by difference/Proximate analysis (mean ± 0.1).
endothermic peak. The second peak is attributed to PE degradation reactions, which are associated with the complete mass loss on TGA.
The integration of the DSC curves can be used to estimate the magnitude order of the enthalpies of melting and pyrolysis. The values of enthalpies of melting were 75, 74, and 65 J/g for VPE, WVPE, and WRPE respectively. The values of 299, 332, and 205 J/g for enthalpies of pyrolysis of VPE, WVPE, and WRPE were respectively obtained. Since the majority of the work does not categorize their type of residues, the values of enthalpies reported in [35,51] for melting at about 90 J/g, and in [52] for pyrolysis at about 258 J/g provide a rough indication of the expected order of magnitude. Looking at the effect of the physical stress on these categories of polyethylene waste, the results suggest that WRPE suffered some modification in its structure leading to weakening of the material, see Section3.2.
To complement the result analysis of the inert atmosphere, DSC under air was carried out. Through the oxidation of the PE samples, it can be observed one endothermic peak related to the one found under an inert atmosphere , and various exothermic peaks indicating that competing reactions are taking place. These reactions with some overlapping degree can be attributed to the key compounds forming the samples, seeTable 4. Therefore, by simplifying the analysis, one can attribute mainly four oxidation reactions for VPE (𝑟1, 𝑟3, 𝑟4, and
𝑟5) and three for WVPE and WRPE (𝑟1, 𝑟3, and 𝑟4) according to the
number of the compounds of each sample. The reaction 𝑟2is attributed
to endothermic phenomena such as phase change and pyrolysis re actions. As the degree of recycling increases (WVPE and WRPE), the endothermic phenomena 𝑟2become stronger extending through a wider
range of temperatures. The TGA under the oxidative atmosphere can be visualized as supplementary material, Appendix B.
By integrating the DSC curves under air for VPE, WVPE, and WRPE, in the temperature range of reactions (𝑟), the combustion enthalpies of the respective samples were about 2765, 3237, and 3665 J/g.
3.5. Kinetic analysis
The plots obtained by the left hand side of the equation of each isoconversional method considered against 1∕𝑇 are shown inFig. 7
for VPE, WVPE, and WRPE. The corresponding lines are obtained at different fraction reacted and different heating rates. It can be seen fromFig. 7that two groups of straight lines are formed depending on the degree of fraction reacted and method: one with smaller slope and lower fraction reacted degree (𝛼
<
0.25) and the other steeper lines and 0.25<
𝛼<
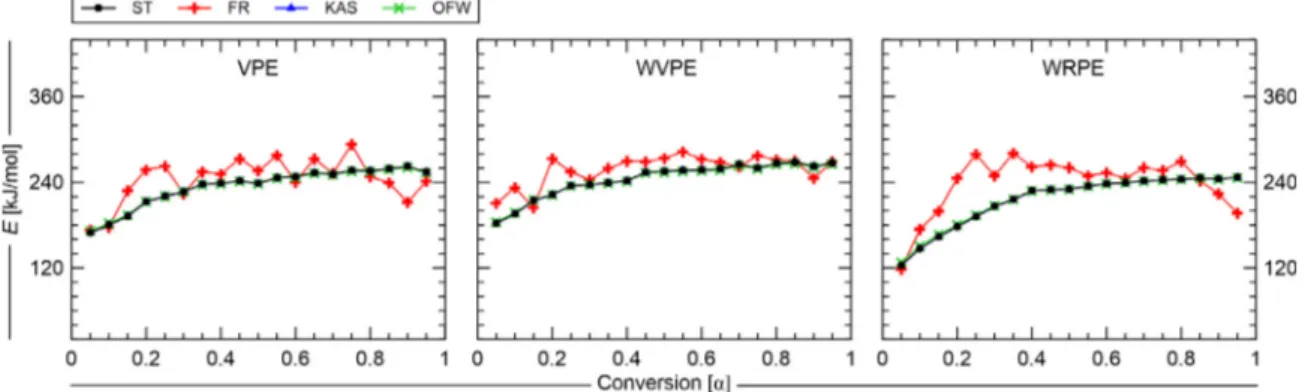
0.95. A different tendency was observed when Friedman’s isoconversional method was used.For comparison, the values of the activation energy were deter mined in a wide range of 𝛼 = 0.05 − 0.95 with a step of 0.05 and the dependence was reported in a plot 𝐸 vs. 𝛼,Fig. 8. This dependence is a warning about multi step kinetics existence in a given process [33]. As can be seen from the curves presented inFig. 8, from 0.05 to 0.95 of fraction reacted, the average activation energy (𝐸𝑎𝑣𝑔), varies in a range
of 216.0 ± 46.3 kJ/mol, 225.5 ± 42.9 kJ/mol, and 185.5 ± 61.6 kJ/mol for VPE, WVPE, and WRPE, respectively. In percentage terms, the difference between the maximum (𝐸𝑚𝑎𝑥) and minimum (𝐸𝑚𝑖𝑛) values of the average are respectively 42.8%, 38.0%, and 66.4%.
Although the literature shows that a strong dependence of 𝐸 within a wide range of 𝛼 means that a given process cannot be considered as a single step one, just one work pointed out the acceptable degree of this dependence, [53]. That author considers that the ratio (𝐸𝑚𝑎𝑥−
𝐸𝑚𝑖𝑛)∕𝐸𝑎𝑣𝑔 should be less than 10%, which constitutes noteworthy
impasse because many authors have been using a single step reaction to describe multi step ones with a relative degree of success [23 28] in rebuild thermogravimetric curves. On the other hand, if the preliminary results from isoconversional methods are used as a tool of diagnostic toward detailed kinetics related to the necessity of controlling the products yields at different reaction velocities , a multi step treatment should be performed.
The generalized master plots are shown inFig. 9. At the top part of the figure, each column contains the respective master plot of VPE, WVPE, and WRPE with all theoretical models investigated. At the bottom part, only the most suitable models are presented. The RMSE between the experimental data and the theoretical reaction models, used to identify the best correspondence, are shown inFig. 10.
Fig. 7. Isoconversional plot of Starink, Friedman, Kissinger–Akahira–Sunose and Ozawa–Flynn–Wall methods in a range of 𝛼 = 0.5 − 0.95 - from the TG under inert atmosphere data.
Fig. 9. At the top: theoretical masterplots of different reaction models; bottom: the best master plots vs. experimental data calculated by Eq.(12).
Fig. 10. Sum of the RMSE between the experimental TG curve and each reaction model listed inTable 2. (a) for VPE, (b) for WVPE, and (c) for WRPE.
The master plots results suggest that the thermal degradation of VPE could be governed by Avrami Erofeev models (A2, A3, and A4), as well
as, by a first order model (F1). The same trend was obtained for the recycled samples, which, in addition, can also be approximated by the contracting geometry (R3) and three dimensional diffusion (D3) mod
els. These model equivalences were already expected since according to [48], it is not possible to distinguish between the models R3and D3, and also is impossible to discern the differences between a first order and Avrami Erofeev models.
It is noteworthy that, although a number of experimental curves at different heating rates result in a series of master plots, a single dependence on 𝛼 can be observed, which is practically independent of
𝛽, see inFig. 9.
The values of the pre exponential factor were determined using the reaction model predicted by Criado master plots and Eq.(4). The range of calculated values of 𝐸 and 𝐴 are summarized inTables 6 and7, organized by sample and by the method. The dependence of the pre exponential factor on the conversion is reported inFig. 11. In general, the dependence of ln𝐴 on 𝛼 increase as more recycled is the sample, which follows the same trend of 𝐸(𝛼).
The kinetic parameters obtained from the different isoconversional methods were used to reconstruct the conversion profiles in comparison with the experimental data,Fig. 12, and then the RMSE was calculated to check the accuracy of each method,Fig. 13. From this analysis, the Starink method showed to be the most accurate approach to determine the kinetic parameters of the pyrolysis process of polyethylene virgin and wastes. On the other hand, the reconstruction of the conver sion profiles using KAS and OFW methods did not match well the experiments, as already reported by [27].
For the values obtained from the Starink method, the logarithmic form of the pre exponential factor was plotted against 𝐸. A linear rela tionship is observed between them,Fig. 14. The correlation coefficient, close to 1, indicates that for all heating rates the values of 𝐴 are in accordance with the distributed activation energy along the conversion process.
3.6. Pyrolysis pathway
According to the results presented above, the significant variation of the kinetics values indicated that polyethylene pyrolysis is indeed
Table 6
Range of activation energy, 𝐸 [kJ/mol], for the pyrolysis of VPE, WVPE, and WRPE obtained from isoconversional methods at various heating rates.
Sample 𝛽[◦C/min] ST FR KAS OFW
VPE 5 169.7 – 262.2 173.1 – 293.0 169.3 – 261.9 172.0 – 260.9 10 15 20 WVPE 5 182.6 – 268.3 204.1 – 283.1 182.3 – 268.1 184.3 – 266.7 10 15 20 WRPE 5 123.9 – 247.1 118.4 – 280.9 123.6 – 246.7 128.3 – 246.5 10 15 20 Table 7
Range of pre-exponential factor, 𝐴 [1/min], for the pyrolysis of VPE, WVPE, and WRPE obtained from isoconversional methods at various heating rates.
Sample 𝛽[◦C/min] ST FR KAS OFW
VPE 5 2.51 × 10¹²– 1.15 × 10¹⁸ 7.65 × 10¹²– 2.35 × 10²⁰ 5.52 × 10¹⁰– 9.86 × 10¹⁷ 9.79 × 10¹⁰– 8.66 × 10¹⁷ 10 5.65 × 10¹²– 1.47 × 10¹⁸ 15 5.13 × 10¹²– 8.23 × 10¹⁷ 20 4.03 × 10¹²– 1.08 × 10¹⁸ WVPE 5 2.16 × 10¹³– 2.98 × 10¹⁸ 4.30 × 10¹⁴– 5.93 × 10¹⁹ 5.03 × 10¹¹– 2.06 × 10¹⁸ 7.76 × 10¹¹– 1.73 × 10¹⁸ 10 1.82 × 10¹³– 2.88 × 10¹⁸ 15 3.86 × 10¹³– 2.88 × 10¹⁸ 20 2.58 × 10¹³– 2.94 × 10¹⁸ WRPE 5 9.61 × 10⁸– 9.57 × 10¹⁶ 3.90 × 10⁸– 9.87 × 10¹⁹ 1.98 × 10⁷– 7.32 × 10¹⁶ 6.16 × 10⁷– 7.30 × 10¹⁶ 10 7.36 × 10⁸– 8.65 × 10¹⁶ 15 1.14 × 10⁹– 9.23 × 10¹⁶ 20 1.25 × 10⁹– 8.24 × 10¹⁶
Fig. 11. Distribution of pre-exponential factor from isoconversional methods in a range of 𝛼 = 0.5 − 0.95.
kinetically complex. The evidence was also observed using the charac terization results, where the XRD analysis shows that PE is composed of bonded compounds, and a strong degree of overlapping was identified in DSC analysis. Therefore, a multi step pathway is delineated below:
• Pre heating. The stage in which the sample absorbs heat. At this stage, only increases in the sample temperature take place. • Melting. The heat promotes changes from the solid phase, PE(𝑠),
to the liquid phase, PE(𝑙), in an endothermic process.
• Bond breaking. After the melting, the bonds linking the com pounds forming the PE are thermally broken in an endothermic process. The result is a multi compound liquid mixture in which compounds with diverse molecular properties are present [54]. From this stage onwards, the liquid phase pyrolysis of the main compounds can take place.
• Evaporation. Once the boiling point of each compound is reached, the liquid phase starts to be vaporized.
• Pyrolysis reaction. Once a compound starts evaporation, it can be thermally cracked in series with respect to the evaporation, and in parallel with respect to the other compounds pyrolysis. The pyrolysis products formed in the individual reactions are grouped in P𝑝.
Note that, the phase change PE(𝑠)to PE(𝑙) does not account for
mass losses; negligible mass losses can be attributed to the bond breaking [55]; the multi compound mixture in the liquid phase is formed only by the compounds identified by XRD. Even if the com pounds n paraffin(𝑔)and paraffin wax(𝑔)are mixtures of hydrocarbons,
Fig. 12. Fitness of the thermogravimetric analysis (fraction reacted, 𝛼) under inert atmosphere using the kinetic parameters obtained from isoconversional methods at various heating rates.
phases can be considered fractions of irregular groups remaining at tached in each separated rigid structure (crystalline phase) identi fied [58]. Also, the pyrolysis products may include oil, wax, and gas [25,29,32,59], and their yields are not investigated in the present work.
The pyrolysis pathways for VPE, WVPE, and WRPE are shown in the schemes inTable 8.
To implement the reaction mechanism shown in Table 8 in nu merical modeling, the stoichiometric and kinetic parameters of each reaction must be quantified, as well as, the amorphous phase may be
Fig. 13. Comparison of different isoconversional methods based on the sum of the RMSE between the experimental and reconstructed fraction reacted (𝛼).
Fig. 14. Estimated ln 𝐴 versus 𝐸 from the Starink method.
incorporated in the solid phase definition. It is necessary to reformulate the kinetic parameter estimation process as an optimization problem in terms of an objective function [32,60,61]. This procedure is beyond the scope of the present study, and for this reason, the kinetic parameters are not determined.
4. Conclusion
In this paper, two types of PE wastes with different degrees of recycling were used to investigate the influence of recycling stress history on the pyrolysis. The main results suggest that the thermal and mechanical stress promotes the increase of long carbon chains while weakening the boundaries among the compounds. This might explain the fact that recycled waste needs less activation energy than recycled samples to degrade thermally. The waste of recycled polyethylene presented the lowest enthalpy of pyrolysis, at about 205 J/g.
The DSC trials evidenced a multi step reaction behavior. This be havior was confirmed by using different isoconversional methods for the kinetic study. Large variations around the average activation energy values were observed. The waste of recycled polyethylene presented a higher variation of about 66% in the range of 185.5 ± 61.6 kJ/mol. Also, it needs less activation energy than VPE and WVPE to degrade thermally. The degradation of all samples can follow Avrami Erofeev (A2, A3, and A4) and first order (F1) models, also, the recycled can be
described by contracting geometry (R3) and three dimensional diffusion
(D3) models.
The pyrolysis pathway is a series parallel phenomenon dominated mainly by the competition of evaporation and pyrolysis reactions.
We recommend that the physical stress history between different categories of polyethylene waste should be considered for kinetics purposes, as well as, for the modeling of the product recovery process.
Data availability
The raw/processed data required to reproduce these findings cannot be shared at this time as the data also forms part of an ongoing study.
Declaration of competing interest
The authors declare that they have no known competing finan cial interests or personal relationships that could have appeared to influence the work reported in this paper.
CRediT authorship contribution statement
João Vitor F. Duque: Conceptualization, Methodology, Software,
Validation, Formal analysis, Resources, Data curation, Writing original draft, Visualization.Márcio F. Martins: Conceptualization, Methodol
ogy, Data curation, Writing review & editing, Supervision, Project administration, Funding acquisition. Gérald Debenest: Conceptual
ization, Software, Methodology, Data curation, Writing review & editing, Supervision. Marcos Tadeu D’Azeredo Orlando: Software,
Methodology, Data curation.
Acknowledgments
The authors acknowledge the Robert S. McNamara Fellowship Pro gram (RSMFP), USA for financial support. We are grateful to Prof. Emanuel Negrão Macêdo and Prof. Kinglston Soares for their assistance through out the project.
Appendix A. Supplementary data
Supplementary material related to this article can be found online athttps://doi.org/10.1016/j.polymertesting.2020.106460.
Table 8
Schemes of the pyrolysis pathways for VPE, WVPE and WRPE.
Melt. and Evap. means melting and evaporation phase changes/ Pyr. means pyrolysis reactions/P𝑝may include oil, wax, and gas.
References
[1] PlasticsEurope, The facts 2018, 2018, arXiv:arXiv:1011.1669v3 http://dx.doi. org/10.1016/j.marpolbul.2013.01.015.
[2] M. Calero, M.Á. Martín-Lara, V. Godoy, L. Quesada, D. Martínez, F. Peula, J.M. Soto, Characterization of plastic materials present in municipal solid waste: preliminary study for their mechanical recycling, Detritus (2018) 104, http: //dx.doi.org/10.31025/2611-4135/2018.13732.
[3] S.M. Al-Salem, P. Lettieri, J. Baeyens, Recycling and recovery routes of plastic solid waste (PSW): A review, Waste manag. 29 (10) (2009) 2625–2643,http: //dx.doi.org/10.1016/j.wasman.2009.06.004.
[4] B. Zhang, Z. Zhong, K. Ding, Z. Song, Production of aromatic hydrocarbons from catalytic co-pyrolysis of biomass and high density polyethylene: Analytical py–GC/MS study , Fuel 139 (2015) 622–628.
[5] F. Obeid, J. Zeaiter, A.H. Al-Muhtaseb, K. Bouhadir, Thermo-catalytic pyrolysis of waste polyethylene bottles in a packed bed reactor with different bed materials and catalysts , Energy Convers. Manage. 85 (2014) 1–6.
[6] X.-C. Tan, C.-C. Zhu, Q.-K. Liu, T.-Y. Ma, P.-Q. Yuan, Z.-M. Cheng, W.-K. Yuan, Co-pyrolysis of heavy oil and low density polyethylene in the presence of supercritical water: The suppression of coke formation , Fuel Process. Technol. 118 (2014) 49–54.
[7] J. Mosio-Mosiewski, M. Warzala, I. Morawski, T. Dobrzanski, High-pressure catalytic and thermal cracking of polyethylene , Fuel Process. Technol. 88 (4) (2007) 359–364.
[8] F. Bai, C.-C. Zhu, Y. Liu, P.-Q. Yuan, Z.-M. Cheng, W.-K. Yuan, Co-pyrolysis of residual oil and polyethylene in sub- and supercritical water , Fuel Process. Technol. 106 (2013) 267–274.
[9] L. Yermán, D. Cormier, I. Fabris, J. Carrascal, J.L. Torero, J.I. Gerhard, Y.-L. Cheng, Potential bio-oil production from smouldering combustion of faeces, Waste Biomass Valorization (ISSN: 1877-2641) 8 (2) (2017) 329–338, http: //dx.doi.org/10.1007/s12649-016-9586-1.
[10] M. Sarker, M. Rashid, M. Rahman, M. Molla, Low and high density polyethylene waste plastics conversion into liquid hydrocarbon fuel, chim. Oggi/Chem. Today 30 (6) (2012).
[11] M. Sarker, M.M. Rashid, M. Molla, M.S. Rahman, Thermal conversion of waste plastic (hdpe, pp, PS) to produce mixture of hydrocarbons, Am. J. Environ. Eng. 2 (5) (2012) 128–136.
[12] A. Villanueva, P. Eder, End-of-Waste Criteria for Waste Plastic for Conversion, Institute for Prospective Technological Studies, 2014.
[13] K. Ragaert, L. Delva, K. Van Geem, Mechanical and chemical recycling of solid plastic waste, Waste Manag. 69 (2017) 24–58.
[14] M. Grigore, Methods of recycling, properties and applications of recycled thermoplastic polymers, Recycling 2 (4) (2017) 24.
[15] H.L. Friedman, Kinetics of thermal degradation of char-forming plastics from thermogravimetry. application to a phenolic plastic, J. Polym. Sci. Part C 6 (1) (1964) 183–195,http://dx.doi.org/10.1002/polc.5070060121.
[16] O. Takeo, A new method of analyzing thermogravimetric data, Bull. Chem. Soc. Japan 38 (11) (1965) 1881–1886,http://dx.doi.org/10.1246/bcsj.38.1881. [17] J.H. Flynn, L.A. Wall, A quick, direct method for the determination of activation
energy from thermogravimetric data, J. Polym. Sci. Part B 4 (5) (1966) 323–328, http://dx.doi.org/10.1002/pol.1966.110040504.
[18] J.H. Flynn, L.A. Wall, General treatment of the thermogravimetry of polymers, J. Res. Nat. Bureau Stand. Sect. A 70A (6) (1966) 487,http://dx.doi.org/10.6028/ jres.070A.043.
[19] J.H. Flynn, The isoconversional method for determination of energy of activation at constant heating rates, J. Therm. Anal. 27 (1) (1983) 95–102,http://dx.doi. org/10.1007/BF01907325.
[20] H. Kissinger, Reaction kinetics in differential thermal analysis, Anal. Chem. 29 (11) (1957) 1702–1706,http://dx.doi.org/10.1021/ac60131a045.
[21] T. Akahira, T. Sunose, Method of determining activation deterioration constant of electrical insulating materials, Res. Rep. Chiba Inst. Technol. (Sci. Technol.) 16 (1971) 22–31.
[22] M. Starink, The determination of activation energy from linear heating rate experiments: a comparison of the accuracy of isoconversion methods, Ther-mochim. Acta 404 (1–2) (2003) 163–176, http://dx.doi.org/10.1016/S0040-6031(03)00144-8.
[23] P. Grammelis, P. Basinas, a. Malliopoulou, G. Sakellaropoulos, Pyrolysis kinetics and combustion characteristics of waste recovered fuels, Fuel 88 (1) (2009) 195–205,http://dx.doi.org/10.1016/j.fuel.2008.02.002.
[24] A. Aboulkas, K. El harfi, A. El Bouadili, Thermal degradation behaviors of polyethylene and polypropylene. part i: Pyrolysis kinetics and mechanisms, Energy Convers. Manage. 51 (7) (2010) 1363–1369,http://dx.doi.org/10.1016/ j.enconman.2009.12.017.
[25] S.S. Park, D.K. Seo, S.H. Lee, T.-U. Yu, J. Hwang, Study on pyrolysis character-istics of refuse plastic fuel using lab-scale tube furnace and thermogravimetric analysis reactor, J. Anal. Appl. Pyrolysis 97 (2012) 29–38,http://dx.doi.org/10. 1016/j.jaap.2012.06.009.
[26] L. Diaz Silvarrey, A. Phan, Kinetic study of municipal plastic waste, Int. J. Hydrogen Energy 41 (37) (2016) 16352–16364, http://dx.doi.org/10.1016/j. ijhydene.2016.05.202.
[27] S. Khedri, S. Elyasi, Kinetic analysis for thermal cracking of HDPE: A new isoconversional approach, Polym. Degrad. Stab. 129 (2016) 306–318, http:// dx.doi.org/10.1016/j.polymdegradstab.2016.05.011.
[28] P. Das, P. Tiwari, Thermal degradation kinetics of plastics and model selection, Thermochim. Acta 654 (June) (2017) 191–202,http://dx.doi.org/10.1016/j.tca. 2017.06.001.
[29] J. Conesa, R. Font, A. Marcilla, J. Caballero, Kinetic model for the contin-uous pyrolysis of two types of polyethylene in a fluidized bed reactor, J. Anal. Appl. Pyrolysis 40–41 (1997) 419–431, http://dx.doi.org/10.1016/S0165-2370(97)00033-8.
[30] O. Gutiérrez, H. Palza, Effect of carbon nanotubes on thermal pyrolysis of high density polyethylene and polypropylene, Polym. Degrad. Stab. 120 (2015) 122–134,http://dx.doi.org/10.1016/j.polymdegradstab.2015.06.014. [31] P.A. Costa, F.J. Pinto, A.M. Ramos, I.K. Gulyurtlu, I.A. Cabrita, M.S. Bernardo,
Kinetic evaluation of the pyrolysis of polyethylene waste, Energy Fuels 21 (5) (2007) 2489–2498,http://dx.doi.org/10.1021/ef070115p.
[32] S. Al-Salem, P. Lettieri, Kinetic study of high density polyethylene (HDPE) pyrolysis, Chem. Eng. Res. Des. 88 (12) (2010) 1599–1606.
[33] S. Vyazovkin, A.K. Burnham, J.M. Criado, L.A. Pérez-Maqueda, C. Popescu, N. Sbirrazzuoli, ICTAC Kinetics committee recommendations for performing kinetic computations on thermal analysis data, Thermochim. Acta 520 (1–2) (2011) 1–19,http://dx.doi.org/10.1016/j.tca.2011.03.034.
[34] Y. Badr, Z. Ali, A. Zahran, R. Khafagy, Characterization of gamma irradiated polyethylene films by DSC and x-ray diffraction techniques, Polym. Int. 49 (12) (2000) 1555–1560,http://dx.doi.org/10.1002/1097-0126(200012)49:12<1555:: AID-PI478>3.0.CO;2-R.
[35] S. Ikhlef, S. Nekkaa, M. Guessoum, N. Haddaoui, Effects of alkaline treatment on the mechanical and rheological properties of low-density polyethylene/ spartium junceum flour composites, ISRN Polym. Sci. 2012 (2012) 1–7,http://dx.doi.org/ 10.5402/2012/965101.
[36] F.G. Souza Jr, M.T. Orlando, R.C. Michel, J.C. Pinto, T. Cosme, G.E. Oliveira, Effect of pressure on the structure and electrical conductivity of cardanol–furfural–polyaniline blends, J. Appl. Polym. Sci. 119 (5) (2011) 2666–2673.
[37] M.E. Brown (Ed.), Introduction to Thermal Analysis, in: Hot Topics in Thermal Analysis and Calorimetry, vol. 1, Kluwer Academic Publishers, Dordrecht, 2004, http://dx.doi.org/10.1007/0-306-48404-8.
[38] E.M. Barrall, Precise determination of melting and boiling points by differential thermal analysis and differential scanning calorimetry, Thermochim. Acta 5 (4) (1973) 377–389,http://dx.doi.org/10.1016/0040-6031(73)80016-4.
[39] D. Dollimore, T.A. Evans, Y.F. Lee, G.P. Pee, F.W. Wilburn, The significance of the onset and final temperatures in the kinetic analysis of TG curves, Thermochim. Acta 196 (2) (1992) 255–265, http://dx.doi.org/10.1016/0040-6031(92)80089-F.
[40] M.G. Grønli, G. Várhegyi, C. Di Blasi, Thermogravimetric analysis and de-volatilization kinetics of wood, Ind. Eng. Chem. Res. 41 (17) (2002) 4201–4208, http://dx.doi.org/10.1021/ie0201157.
[41] M. Wojdyr, Fityk : a general-purpose peak fitting program, J. Appl. Crystallogr. 43 (5) (2010) 1126–1128,http://dx.doi.org/10.1107/S0021889810030499. [42] J.D. Hanawalt, H.W. Rinn, L.K. Frevel, Chemical analysis by X-ray diffraction,
Ind. Eng. Chem. Anal. Ed. 10 (9) (1938) 457–512,http://dx.doi.org/10.1021/ ac50125a001.
[43] J.D. Hanawalt, Phase identification by X-ray powder diffraction evaluation of various techniques, Adv. X-ray Anal. 20 (1976) 63–73,http://dx.doi.org/10. 1154/S037603080001171X.
[44] J. Hanawalt, History of the powder diffraction file, Crystallogr. North Amer.-Appar. Methods (1983) 215–219.
[45] S. Gražulis, A. Daškevič, A. Merkys, D. Chateigner, L. Lutterotti, M. Quirós, N.R. Serebryanaya, P. Moeck, R.T. Downs, A. Le Bail, Crystallography open database (COD): an open-access collection of crystal structures and platform for world-wide collaboration, Nucleic Acids Res. 40 (D1) (2012) D420–D427, http://dx.doi.org/10.1093/nar/gkr900.
[46] S. Kabekkodu, PDF-2 2007, ICDD Database (2007).
[47] J. Rodríguez-Carvajal, Recent advances in magnetic structure determination by neutron powder diffraction, Physica B 192 (1–2) (1993) 55–69,http://dx.doi. org/10.1016/0921-4526(93)90108-I.
[48] J. Criado, Kinetic analysis of DTG data from master curves, Thermochim. Acta 24 (1) (1978) 186–189,http://dx.doi.org/10.1016/0040-6031(78)85151-X.
[49] P.E. Sánchez-Jiménez, L.A. Pérez-Maqueda, A. Perejón, J.M. Criado, Generalized master plots as a straightforward approach for determining the kinetic model: The case of cellulose pyrolysis, Thermochim. Acta 552 (2013) 54–59, http: //dx.doi.org/10.1016/j.tca.2012.11.003.
[50] J.P. Elder, Reconciliation of arrhenius and iso-conversional analysis kinetics parameters of non-isothermal data, Thermochim. Acta 272 (1996) 41–48,http: //dx.doi.org/10.1016/0040-6031(95)02605-3.
[51] V. Selikhova, Y. Zubov, N. Bakeyev, G. Belov, Melting temperature, heat of melting and crystallinity determinations on polyethylene by differential scanning calorimetry, Polym. Sci. U.S.S.R. 19 (4) (1977) 879–886,http://dx.doi.org/10. 1016/0032-3950(77)90243-X.
[52] A. Brems, J. Baeyens, C. Vandecasteele, R. Dewil, Polymeric cracking of waste polyethylene terephthalate to chemicals and energy, J. Air Waste Manage. Assoc. 61 (7) (2011) 721–731,http://dx.doi.org/10.3155/1047-3289.61.7.721. [53] S. Vyazovkin, Isoconversional Kinetics of Thermally Stimulated Processes,
Springer International Publishing, Cham, 2015, http://dx.doi.org/10.1007/978-3-319-14175-6.
[54] S.A. Deshmukh, G. Kamath, V.G. Pol, S.K.R.S. Sankaranarayanan, Kinetic path-ways to control hydrogen evolution and nanocarbon allotrope formation via thermal decomposition of polyethylene, J. Phys. Chem. C 118 (18) (2014) 9706–9714,http://dx.doi.org/10.1021/jp4109317.
[55] S.E. Levine, L.J. Broadbelt, Detailed mechanistic modeling of high-density polyethylene pyrolysis: low molecular weight product evolution, Polym. Degrad. Stab. 94 (5) (2009) 810–822, http://dx.doi.org/10.1016/j.polymdegradstab. 2009.01.031.
[56] W.R. Turner, D.S. Brown, D.V. Harrison, Properties of paraffin waxes, Ind. Eng. Chem. 47 (6) (1955) 1219–1226,http://dx.doi.org/10.1021/ie50546a049. [57] S. Himran, A. Suwono, G.A. Mansoori, Characterization of alkanes and paraffin
waxes for application as phase change energy storage medium, Energy Source 16 (1) (1994) 117–128,http://dx.doi.org/10.1080/00908319408909065. [58] J. Chmelař, R. Pokorný, P. Schneider, K. Smolná, P. Bělský, J. Kosek, Free and
constrained amorphous phases in polyethylene: Interpretation of 1h NMR and SAXS data over a broad range of crystallinity, Polymer 58 (2015) 189–198, http://dx.doi.org/10.1016/j.polymer.2014.12.036.
[59] J. Conesa, A. Marcilla, J. Caballero, R. Font, Comments on the validity and utility of the different methods for kinetic analysis of thermogravimetric data, J. Anal. Appl. Pyrolysis 58–59 (2001) 617–633, http://dx.doi.org/10.1016/S0165-2370(00)00130-3.
[60] M.A.B. Zanoni, H. Massard, M.F. Martins, Formulating and optimizing a combus-tion pathways for oil shale and its semi-coke , Combust. Flame 159 (10) (2012) 3224–3234,http://dx.doi.org/10.1016/j.combustflame.2012.05.005.
[61] G. Rein, C. Lautenberger, A.C. Fernandez-Pello, J.L. Torero, D.L. Urban, Appli-cation of genetic algorithms and thermogravimetry to determine the kinetics of polyurethane foam in smoldering combustion, Combust. Flame 146 (1) (2006) 95–108.