HAL Id: inserm-00770809
https://www.hal.inserm.fr/inserm-00770809
Submitted on 7 Jan 2013
HAL is a multi-disciplinary open access archive for the deposit and dissemination of sci-entific research documents, whether they are pub-lished or not. The documents may come from teaching and research institutions in France or abroad, or from public or private research centers.
L’archive ouverte pluridisciplinaire HAL, est destinée au dépôt et à la diffusion de documents scientifiques de niveau recherche, publiés ou non, émanant des établissements d’enseignement et de recherche français ou étrangers, des laboratoires publics ou privés.
Glycemia, Insulin Resistance, Insulin Secretion, and
Risk of Depressive Symptoms in Middle Age.
Tasnime Akbaraly, Meena Kumari, Jenny Head, Karen Ritchie, Marie-Laure
Ancelin, Adam Tabák, Eric Brunner, Isabelle Chaudieu, Michael Marmot,
Jane Ferrie, et al.
To cite this version:
Tasnime Akbaraly, Meena Kumari, Jenny Head, Karen Ritchie, Marie-Laure Ancelin, et al.. Glycemia, Insulin Resistance, Insulin Secretion, and Risk of Depressive Symptoms in Middle Age.: Glycemia, insulin secretion & depressive symptoms. Diabetes Care, American Diabetes Association, 2012, epub ahead of print. �10.2337/dc12-0239�. �inserm-00770809�
September 2012
Glycemia, insulin resistance, insulin secretion and risk of depressive symptoms in middle-age
Running Title: Glycemia, insulin secretion & depressive symptoms
Tasnime N Akbaralya,b,c PhD, Meena Kumaria Ph.D, Jenny Heada MSc, Karen Ritchieb,c,d
PhD, Marie-Laure Ancelinb,c PhD, Adam G Tabak a,e MD PhD, Eric Brunner a PhD, Isabelle
Chaudieub,c PhD, Michael G Marmot a MD PhD, Jane E Ferriea PhD, Martin J. Shipleya MSc,
Mika Kivimäkia PhD
(a)
Department of Epidemiology and Public Health, University College London, WC1E6BT,
UK
(b)
Inserm U1061, Montpellier F-34093, France.
(c)
University Montpellier I, F-34000, France.
(d)
Faculty of Medicine, Imperial College, London, UK
(e)
Semmelweis University Faculty of Medicine, 1st Department of Medicine, Budapest,
Hungary
Corresponding author:
Tasnime Akbaraly INSERM U 1061, Hôpital La Colombière, 39 avenue Charles Flahault, BP
34493, 34093 Montpellier cedex 05, France.
Tel +33(0) 499 614 694 Fax: +33 (0) 499 614 579
Address correspondence and reprint requests to: Tasnime Akbaraly
KEYWORDS:depressive symptoms, type 2 diabetes, fasting glucose, fasting insulin, insulin
secretion, HOMA, prospective epidemiological study
Word count: 3047 in text; 200 in abstract; 1 Figure, 2 Tables; Supplemental
ABSTRACT
Objective: The extent to which abnormal glucose metabolism increases the risk of depression
remains unclear. In this study we investigated prospective associations of fasting glucose,
fasting insulin and indices of insulin resistance and secretion with subsequent new-onset
depressive symptoms (DepS).
Research Design and Methods: Prospective cohort study of 3145 adults from the Whitehall
II Study (23.5% women, 60.6±5.9 years). Baseline examination included fasting glucose and
insulin, homoeostasis model assessment insulin resistance (HOMA2-%IR) and HOMA
beta-cell insulin secretion (HOMA2-%B). DepS (Center for
Epidemiologic-Studies-Depression-Scale ≥16 or use of anti-depressive drugs) were assessed at baseline and at 5-year follow-up.
Results: Over the 5-year follow-up, 142 men and 84 women developed DepS. Women in the
lowest quintile of insulin secretion (HOMA2-%B ≤55.3 %) had 2.18 (95%CI: 1.25-3.78)
times higher odds of developing DepS compared to those with higher insulin secretion. This
association was not accounted for by inflammatory markers, cortisol secretion, or menopausal
status and hormone replacement therapy. Fasting insulin measures were not associated with
DepS in men and fasting glucose was not associated with new-onset DepS in either sex.
Conclusion: Low insulin secretion appears to constitute a risk factor for DepS in middle-aged
Type 2 diabetes (T2D) is associated with depression (1, 2). Plausible mechanisms
underlying this association include the depressogenic effect of treatment and management of
T2D (3-6) and influence of the T2D diagnosis itself, as it can be viewed as a stressful life
event (7, 8). Recently, the hypothesis that the link between diabetes and depression may also
result from a direct biological impact of diabetes-related biological changes has raised
particular interest. More specifically, it has been proposed that hyperglycemia and
hyperinsulinemia may alter hypothalamic-pituitary-adrenal axis function, which, in turn,
increases the risk of depressive symptoms (DepS) (9, 10).
To date, the results from observational studies investigating the association between
fasting glucose and depression are mixed. Some investigations found that impaired fasting
glucose (11) and high glycated haemoglobin (12) were associated with increased DepS, but
others failed to observe this association (4, 13-15) or suggested that the association varied by
sex (16, 17). Similarly, evidence of an association between hyperinsulinemia, insulin
resistance and depression is equivocal with findings from 6 studies showing a positive
association between insulin resistance and DepS (17-23), two reporting a null effect (24, 25),
and one suggesting that insulin resistance is inversely associated with DepS (26).
Methodological limitations, such as cross-sectional study design and small sample size, may
have contributed to these inconsistencies. Furthermore, the possibility of a nonlinear
relationship between levels of fasting glucose (7) or insulin and DepS may explain these
inconsistencies.
To dissect the effect of T2D diagnosis/treatment from the influences of biomarkers, it
is crucial to examine associations prospectively between insulin and glucose levels and DepS
and controlling for T2D status. It is also crucial to take into account the wide range of factors
DepS may be explained by common causes, such as obesity, low socioeconomic status, or
stroke.
In the present large-scale longitudinal study, we examined whether measures of
glucose and insulin were prospectively associated with new-onset DepS over 5 years of
follow-up. In order to minimize the depressogenic effects of T2D diagnosis/treatment,
analyses were performed taking into account T2D status at study baseline and repeated in a
subgroup of non-diabetic participants. We tested the strength of the findings by controlling for
a wide range of potential confounders and mediators, including socio-demographic
characteristics, health behaviors, inflammatory markers, cortisol, and health factors, such as
RESEARCH DESIGN AND METHODS
Population and Study Design
Data were from the Whitehall II Study(27), a large-scale prospectivecohort study of
10308 civil servants (6895 men and 3413 women) aged 35 to 55 years at the start of the study
(phase 1: 1985–1988). Since phase 1, follow-up examinationshave taken place approximately
every 5 years: phase 3 (1991–1993),n=8104; phase 5 (1997–1999), n=7263; phase 7 (2003–
2004),n=6943, and phase 9 (2008–2009), n=6354. After complete description of the study to
the subjects, written informed consent was obtained; the University College London ethics
committee approved the study.
Phase 7, when DepS were first measured using the Center for Epidemiologic Studies
Depression Scale (CES-D), serves as the baseline for the current analysis. As described in the
study flow-chart (Appendix- Figure A), 3145 participants (2406 men, and 739 women) of the
4978 participants free from DepS at phase 7, were included in the analysis. Compared to
those excluded, participants included were younger, less likely to be women and from the
lowest occupational grades (all p<0.001). They were also less likely to have prevalent T2D
(p<0.001) and less likely to develop DepS at phase 9 (p=0.03), in addition to having lower
levels of fasting glucose, fasting insulin, insulin secretion and insulin resistance (all p<0.001)
at Phase 7.
Data Collection
Measurement of fasting glucose and fasting insulin at phase 7 (baseline) and phase 9 (follow-up). Blood samples were taken in the morning from participants after ≥8 hours of
fasting or after ≥5 hours if afternoon sampling was done. Glucose samples were drawn into
fluoride monovette tubes and insulin samples into native tubes, which were centrifuged on
moved into microtubes and stored at −70°C. Blood glucose was measured with the glucose
oxidase method on YSI model 2300 STAT PLUS analyzer (YSI Corporation, Yellow Springs,
OH, USA), and serum insulin was measured with a DAKO insulin ELISA kit
(DakoCytomation Ltd, Ely, UK) following standard procedures detailed elsewhere(28). Based
on the updated homoeostasis model assessment (HOMA) methods, HOMA insulin resistance
(HOMA2-%IR) and HOMA beta-cell insulin secretion (HOMA2-%B) were calculated by the
HOMA2 calculator version 2.2 (http://www.dtu.ox.ac.uk/homacalculator/index.php)(29).
Prevalent cases of T2D at phase 7. Diabetes was defined by a fasting glucose
≥7.0mmol/L or a 2h postload glucose ≥11.1 mmol/L during a 75g oral glucose tolerance test
(8) assessed at phase 3, 5 and 7, use of anti-diabetic drugs, or self report of a doctor’s
diagnosis.
Assessment of DepS at phases 7 and 9. At both waves, participants with DepS were
defined either by a score ≥16 on the CES-D scale or the use of antidepressants. After
excluding participants with prevalent or unknown DepS at phase 7 (n=1965), incident DepS
over the 5-year follow-up was defined by the presence of DepS at phase 9.
Assessment of covariates at phase 7. Socio-demographic variables consisted of sex,
age, ethnicity (White/ South Asian/ Black), marital status (married, cohabiting / single,
divorced, widowed), civil service employment grade (3 levels with grade 1 representing the
highest level and grade 3 the lowest in terms of salary, social status and level of
responsibility). Health status was ascertained using a number of measures: prevalence of
Coronary Heart Disease (CHD) based on clinically verified non-fatal myocardial infarction or
definite angina; self-reported stroke or transient ischemic attack; hypertension (systolic or
diastolic blood pressure 140 or 90 mm Hg respectively or use of hypertensive drugs); high density lipoprotein (HDL) cholesterol and use of lipid-lowering drugs; smoking status (non /
in women); and cognitive impairment defined by a score ≤27 in the Mini Mental State
Examination (MMSE).
At phase 7, we additionally assessed inflammatory markers interleukin 6 (IL-6) and
C-reactive protein (CRP) (30) and cortisol secretion (31), as previously described. Women’s
health factors included menstruation status (still menstruating versus natural menopause) and,
for women with natural menopause, use of hormone replacement therapy (HRT)
(never/past/current use).
Statistical Analyses
Logistic regression models were performed to assess the association between quintiles
of fasting glucose and fasting insulin at phase 7 and new-onset DepS at phase 9. The
statistical evidence of sex differences in the insulin-DepS association led us to conduct all
these analyses separately in men and women (p for sex interaction=0.004). Odds ratios were
sequentially adjusted for age and ethnicity (Model 1), T2D status at phase 7 (Model 2),
occupational grade, marital status, smoking behavior, stroke, CHD, hypertension, use of lipid
lowering drugs, decreased HDL-cholesterol, central obesity and cognitive impairment
(MMSE) (Model 3). Similar logistic regression models were performed to assess the
association between indices of insulin resistance (HOMA2-%IR) and insulin secretion
(HOMA2-%B) categorized in quintiles at phase 7 and new-onset DepS at phase 9. To assess
the extent to which the associations were driven by biological processes involved in T2D or
the depressogenic effect of treatment and management of T2D, analyses were repeated after
excluding participants with T2D at phase 7.
To examine the robustness of the associations studied and to obtain information on
sets of supplementary analyses which were adjusted successively for inflammatory markers, women’s health measures and cortisol secretion variables.
All analyses were conducted using SAS software, version9 (SAS Institute, Cary, NC,
RESULTS
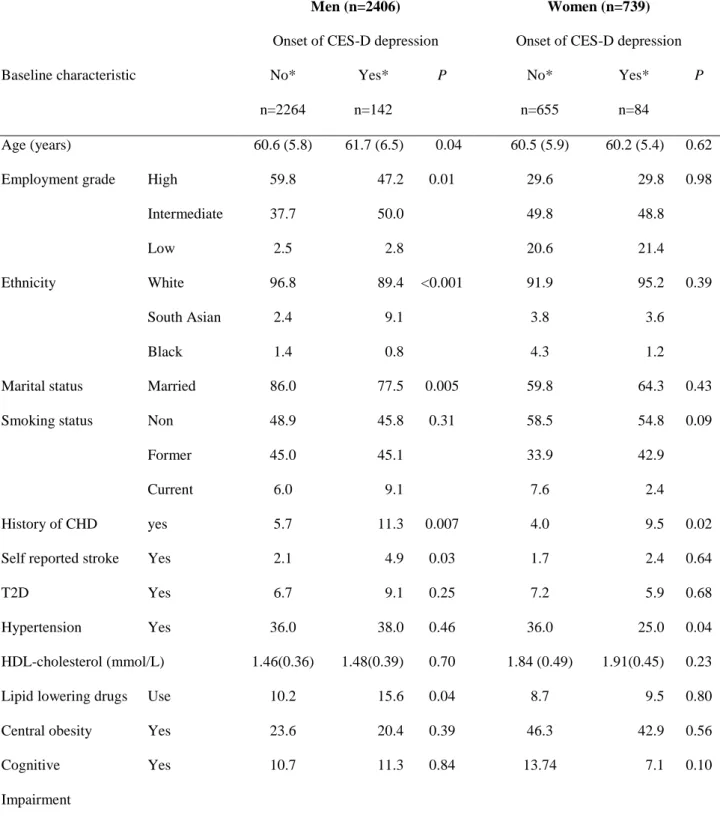
Over the 5-year follow-up, 142 men (5.9%) and 84 women (11.4%) developed DepS.
Table 1 presents the characteristics of participants as a function of new-onset DepS separately
for men and women. Means (SD) of fasting insulin and fasting glucose were significantly
higher in men (insulin: 9.26 (6.27) uIU/mL, glucose: 5.45 (0.76) mmol/L) compared to
women (insulin: 8.51 (5.38) uIU/mL, glucose: 5.19 (0.60) mmol/L).
Analyses of the associations of quintiles of fasting glucose and fasting insulin with
new-onset of DepS over the 5-year follow-up were performed separately for men
(Appendix-Table A1) and women (Appendix-(Appendix-Table A2). No association between fasting glucose and
onset of DepS was observed before or after taking into account T2D status and other
covariates at baseline.
Women in the lowest quintile of the insulin distribution tended to show higher odds of
new onset of DepS compared to those in other quintiles although the overall heterogeneity
between quintiles did not reach statistical significance (p = 0.09). Compared to women in the
first insulin quintile, the fully-adjusted odds of developing DepS was reduced by 51%, 56%,
43% and 62% for women in the 2nd , 3rd, 4th and 5th quintiles, respectively (Appendix-Table
A2, Model 3). Similar analyses carried out in 2929 non-diabetic participants showed that
while the direction and magnitude of associations were similar, the results in the non-diabetic
women were attenuated. No significant association between insulin and DepS was observed
in men (Appendix-Table A1).
To further examine insulin metabolism in women, we analyzed the associations of
insulin resistance (assessed by %IR) and insulin secretion (assessed by
HOMA2-%B) with new-onset of DepS in women (Figure 1). The first quintile of HOMA2 -%IR (i.e.
women with lower level of insulin resistance or higher level of insulin sensitivity) tended to
reach statistical significance. In contrast, women in the first quintile of HOMA2-%B (i.e.
women with lower levels of insulin secretion) showed significantly increased odds of
developing DepS compared to those in the other quintiles (Figure 1). This association was not
attenuated after adjustment for T2D and other potential confounders or when analyses were
confined to non-diabetic women only. Figure 1 also shows that the odds of developing DepS
did not differ significantly between women with insulin secretion in the 2nd, 3 rd, 4th or 5th
quintile, suggesting that low insulin secretion may be a risk factor for DepS in women.
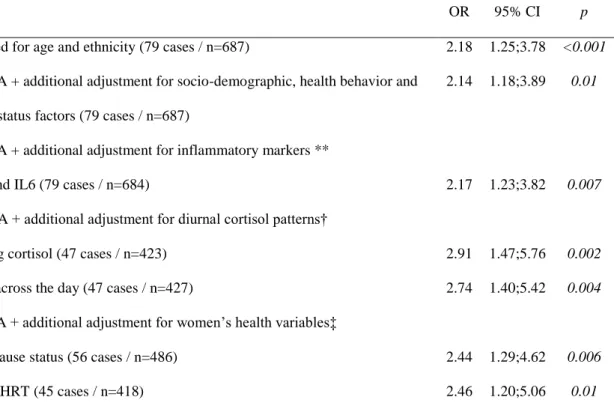
To examine the robustness of this finding, we performed a set of logistic regression
models comparing risk of DepS between women in the lowest insulin secretion group
(HOMA2-%B ≤ 55.3%) with those with higher insulin secretion levels (HOMA2-%B >55.3
%)(Table 2). Even after adjustment for socio-demographic, health behavior and health status
factors, women with low insulin secretion had a 2-fold increased odds of developing DepS
over the 5-year follow-up, compared to those with higher insulin secretion levels (Models A
and B). This association was not accounted for by the inflammatory markers IL6 and CRP
(Model C); HPA axis related indicators, such as diurnal slope of cortisol secretion and waking cortisol (Model D); or women’s health factors, such as menopausal status and use of HRT
(Model E). Supplementary analyses showed that women in the first quintile of insulin
secretion (HOMA2-%B ≤ 55.3%) were more likely to have higher fasting glucose and insulin
sensitivity and a lower level of insulin than other women (results not shown, but available
upon request).
To examine the robustness of our findings, we repeated analyses 1) after defining
DepS by a CES-D score ≥23 or use of anti-depressive drugs, a measure indicating more
severe DepS, 2) after excluding participants who had DepS at phase 3 or phase 5 (i.e. prior to
depression subscale of the 30-item General Health Questionnaire (GHQ) (32). The results
changed little in these sensitivity analyses (results not shown but available upon request).
No associations of indices of insulin resistance and insulin secretion with new-onset
DISCUSSION
In the present report we investigated the prospective association between glucose
metabolism and DepS in a large cohort of pre-elderly participants. While no longitudinal
association was found between fasting glucose and DepS in either sex, we found that women
with low insulin secretion (HOMA2-%B ≤ 55.3%) had a 2-fold increased odds of developing
DepS over the 5-year follow-up compared to those with higher insulin secretion
(HOMA2-%B >55.3%). This association was independent of TD2 status and associated common
metabolic disorders, coronary heart disease and cognitive impairment. The association was
also robust to adjustment for inflammatory markers, cortisol secretion profiles, menopausal
status and hormone replace therapy.
Some previous studies have suggested that disturbed glucose homeostasis per se is an
implausible cause of DepS (3, 4). One investigation found an increased prevalence of DepS
among participants aware of their T2D status but not among undiagnosed diabetic subjects
(4). Another study provided evidence that treated T2D patients but not untreated participants
with impaired fasting glucose had a higher incidence of DepS, suggesting that DepS may be a
consequence of the treatment regime (3). The lack of evidence supporting an association
between fasting glucose and DepS in our findings accords with these studies and suggests that
the process linking T2D to depression may not involve a direct path between hyperglycemia
and related glucose transport alteration and depression risk.
Previous findings on the association between insulin levels, indices of insulin
resistance and DepS are mixed and mostly come from cross-sectional studies (17-26). By
investigating these associations prospectively in a large pre-elderly population including both
men and women, our analyses make a contribution to this area of research. Women with low
insulin secretion and low insulin resistance appeared to have an increased risk of developing
our understanding of the trajectories of insulin secretion leading to T2D development (7), the
biomarker profile of these women - characterized by a decrease in insulin secretion together
with an increase in glucose levels - could actually correspond to women in the non-diabetic
range but very close to the onset of T2D and thus unable to increase their insulin secretion in
response to increasing glucose levels.
Our finding is in accordance with the cross-sectional data from the British Women’s
Heart and Health Study in which prevalence of depression was inversely associated with
insulin resistance in 4286 women aged 60-79 years(26). Our results are also in agreement
with a prospective study reporting that accumulation of factors related to high insulin
sensitivity was associated with an increased risk of suicide in a Finnish population (33).
The reason why this association was found in women only remains unclear. To study
whether this sex difference might reflect sex-specific characteristics of insulin metabolism,
we performed additional analyses in which menopausal status and HRT were taken into
account. We found no evidence to suggest that menopausal status or HRT mediate the
association between insulin secretion and DepS, making these factors an unlikely explanation
of our results. A further possible explanation, although untestable with the present dataset, is
that the instrument we used to assess DepS may be less sensitive to male depression; it has
been suggested that the CES-D scale may measure different phenomena in men and women
(34, 35). Further prospective studies using clinical interview or other sensitive measures to
detect depression both in men and women are needed to understand the underpinning of these
sex differences.
The present analysis took into account a large range of clinical characteristics and
health behaviors. Inflammatory markers, such as CRP and IL6, and activation of the HPA
axis have previously been linked with both development of T2D (11, 36) and DepS (11, 37)
inflammatory factors measured, CRP and IL6, or diurnal cortisol patterns were driving the
observed association between insulin metabolism and DepS.
Further investigations are needed to better understand the mechanism underlying the
low insulin secretion-DepS association. In particular, we suggest that future research should
consider the possible physiologic pathway between inadequate insulin action and and DepS
via increased central serotonin production, proposed by Golomb et al. (33). Briefly, as insulin
action may suppress postprandial mobilization of non-esterified fatty acids from adipose
tissue, lower postprandial free fatty acid levels are expected in a state of low insulin secretion.
This would translate into lower availability of the free fraction of tryptophan, which is a rate
limiting substrate of serotonin production and is associated with mood disorders, as illustrated
in Appendix-Figure B.
Limitations of the present findings include, first, the use of the CES-D scale to assess
depressive symptoms, as it is not a measure of clinically recognized psychiatric disorder.
Although the CES-D scale has been validated in epidemiological studies carried out in the
general population, it does not indicate the severity or the chronicity of depression.
Furthermore, as the recall period for CES-D symptoms is over the past week, with only two
measures over a 5-year period, it is difficult to provide accurate information on incidence of
DepS. However, this is unlikely to cause a major bias in our results given that a similar
pattern of insulin secretion-DepS association was observed after excluding DepS cases
identified using the General Health Questionnaire over a 10-year period before the study
baseline.
A further limitation relates to HOMA models as measures of insulin resistance and
insulin secretion. As HOMA2-%IR and HOMA2-%B uses the same fasting values for
estimation, we were unable to calculate the disposition index which is a measure of insulin
interpret our findings cautiously. In the present study, the group of non-diabetic women with
low HOMA2-%B and increased risk of developing depressive symptoms tend to have low
HOMA2-%IR and elevated fasting glucose values. This suggests that these women were in
prediabetic state, although at this stage we do not have data to confirm this hypothesis.
A further drawback is related to the fact that participants of the Whitehall II study are
mainly office-based civil servants who are not fully representative of the British population.
This may limit the generalizability of our findings. We cannot exclude the possibility that we
observed the higher odds of DepS found in women with the lowest insulin and insulin
secretion levels by chance. In addition, with observational data the possibility remains that
unmeasured confounders may explain the observed association. However, the robustness of
the association between insulin levels and depressive symptoms after taking into account a
wide range of potential confounders and mediators including socio-demographic
characteristics, health behavior, health factors such as chronic diseases, inflammatory factors
and cognitive performance, makes less probable that the observed association between insulin
secretion and onset of depressive symptoms was an artifact.
In conclusion, our findings suggest that low insulin secretion is associated with
an increased risk of DepS in middle-aged women after taking into account potential
confounders, such as common cardio metabolic disorders, cognitive impairment,
inflammatory markers, cortisol secretion profiles, menopausal status and hormone
replacement therpy. This study
supports the hypothesis of a direct impact of insulin secretion on new-onset depression risk in
women. It does not exclude the possibility that depressive symptoms relate to type 2 diabetes
as in longstanding type 2 diabetes insulin secretion is decreasing. However, additional
arguments are needed to establish the exact biological mechanisms linking insulin metabolism
ACKNOWLEDGEMENTS
We thank all participating men and women in the Whitehall II Study; all participating Civil
Service departments and their welfare, personnel, and establishment officers; the
Occupational Health and Safety Agency; and the Council of Civil Service Unions. The
Whitehall II Study team comprises research scientists, statisticians, study coordinators,
nurses, data managers, administrative assistants and data entry staff, who make the study
possible.
Author Contributions:
TNA wrote the manuscript, carried out the statistical analyses and researched data. M Kumari
researched data, reviewed /edited the manuscript. JH researched data, reviewed /edited the
manuscript, KR reviewed /edited the manuscript, MLA reviewed/edited the manuscript, AGT
researched data, reviewed/edited the manuscript and contributed to discussion. EB researched
data, reviewed /edited the manuscript, IC reviewed /edited the manuscript, MGM researched
data, reviewed/edited the manuscript, JEF researched data, reviewed/edited the manuscript,
MJS researched data, reviewed/edited the manuscript and contributed to discussion. M
Kivimaki researched data and co-wrote the manuscript.
Dr. Akbaraly is the guarantor of this work and, as such, had full access to all of the data in the
study and takes responsibility for the integrity of the data and the accuracy of the data
analysis.
Financial Disclosures and Conflicts of interest: none reported.
Funding/Support: Funding/Support: The Whitehall II study is supported by grants from the
British Health and Safety Executive; the British Department of Health; the National Heart,
Lung, and Blood Institute (R01HL036310); the National Institute on Aging, NIH
(R01AG013196 and R01AG034454); and the Agency for Health Care Policy and Research
(grant HS06516). MK is supported by an ESRC professorial fellowship.
Role of the Sponsor: The funders had no role in study design, data collection and analysis,
decision to publish, or preparation of the manuscript.
REFERENCES
1. Ali S, Stone MA, Peters JL, Davies MJ, Khunti K. The prevalence of co-morbid depression in adults with Type 2 diabetes: a systematic review and meta-analysis. Diabet Med. 2006;23(11):1165-73. Epub 2006/10/24.
2. Mezuk B, Eaton WW, Albrecht S, Golden SH. Depression and type 2 diabetes over the lifespan: a meta-analysis. Diabetes Care. 2008;31(12):2383-90.
3. Golden SH, Lazo M, Carnethon M, Bertoni AG, Schreiner PJ, Diez Roux AV, et al. Examining a bidirectional association between depressive symptoms and diabetes. Jama. 2008;299(23):2751-9.
4. Knol MJ, Heerdink ER, Egberts AC, Geerlings MI, Gorter KJ, Numans ME, et al. Depressive symptoms in subjects with diagnosed and undiagnosed type 2 diabetes. Psychosom Med. 2007;69(4):300-5.
5. Musselman DL, Betan E, Larsen H, Phillips LS. Relationship of depression to diabetes types 1 and 2: epidemiology, biology, and treatment. Biol Psychiatry. 2003;54(3):317-29. Epub 2003/08/02.
6. Talbot F, Nouwen A. A review of the relationship between depression and diabetes in adults: is there a link? Diabetes Care. 2000;23(10):1556-62. Epub 2000/10/07.
7. Kivimaki M, Tabak AG, Batty GD, Singh-Manoux A, Jokela M, Akbaraly TN, et al. Hyperglycemia, type 2 diabetes, and depressive symptoms: the British Whitehall II study. Diabetes Care. 2009;32(10):1867-9.
8. Alberti KG, Zimmet PZ. Definition, diagnosis and classification of diabetes mellitus and its complications. Part 1: diagnosis and classification of diabetes mellitus provisional report of a WHO consultation. Diabet Med. 1998;15(7):539-53.
9. Cameron OG, Kronfol Z, Greden JF, Carroll BJ. Hypothalamic-pituitary-adrenocortical activity in patients with diabetes mellitus. Arch Gen Psychiatry. 1984;41(11):1090-5. Epub 1984/11/01.
10. Chan O, Inouye K, Riddell MC, Vranic M, Matthews SG. Diabetes and the
hypothalamo-pituitary-adrenal (HPA) axis. Minerva Endocrinol. 2003;28(2):87-102. Epub 2003/04/30.
11. Gale CR, Kivimaki M, Lawlor DA, Carroll D, Phillips AC, Batty GD. Fasting glucose, diagnosis of type 2 diabetes, and depression: the Vietnam experience study. Biol
Psychiatry.67(2):189-92.
12. Hamer M, Batty GD, Kivimaki M. Haemoglobin A1c, fasting glucose and future risk of elevated depressive symptoms over 2 years of follow-up in the English Longitudinal Study of Ageing. Psychol Med.1-8.
13. Aujla N, Abrams KR, Davies MJ, Taub N, Skinner TC, Khunti K. The prevalence of depression in white-European and South-Asian people with impaired glucose regulation and screen-detected type 2 diabetes mellitus. PLoS One. 2009;4(11):e7755.
14. Hamer M, Stamatakis E, Kivimaki M, Pascal Kengne A, Batty GD. Psychological distress, glycated hemoglobin, and mortality in adults with and without diabetes. Psychosom Med. 2010;72(9):882-6. Epub 2010/10/05.
15. Rhee MK, Musselman D, Ziemer DC, Vaccarino V, Kolm P, Weintraub WS, et al. Unrecognized glucose intolerance is not associated with depression. Screening for Impaired Glucose Tolerance study 3 (SIGT 3). Diabet Med. 2008;25(11):1361-5.
16. Adriaanse MC, Dekker JM, Heine RJ, Snoek FJ, Beekman AJ, Stehouwer CD, et al. Symptoms of depression in people with impaired glucose metabolism or Type 2 diabetes mellitus: The Hoorn Study. Diabet Med. 2008;25(7):843-9.
17. Holt RI, Phillips DI, Jameson KA, Cooper C, Dennison EM, Peveler RC. The
relationship between depression and diabetes mellitus: findings from the Hertfordshire Cohort Study. Diabet Med. 2009;26(6):641-8.
18. Adriaanse MC, Dekker JM, Nijpels G, Heine RJ, Snoek FJ, Pouwer F. Associations between depressive symptoms and insulin resistance: the Hoorn Study. Diabetologia. 2006;49(12):2874-7.
19. Pan A, Ye X, Franco OH, Li H, Yu Z, Zou S, et al. Insulin resistance and depressive symptoms in middle-aged and elderly Chinese: findings from the Nutrition and Health of Aging Population in China Study. J Affect Disord. 2008;109(1-2):75-82.
20. Pearson S, Schmidt M, Patton G, Dwyer T, Blizzard L, Otahal P, et al. Depression and insulin resistance: cross-sectional associations in young adults. Diabetes Care.33(5):1128-33. 21. Timonen M, Laakso M, Jokelainen J, Rajala U, Meyer-Rochow VB, Keinanen-Kiukaanniemi S. Insulin resistance and depression: cross sectional study. Bmj.
2005;330(7481):17-8.
22. Timonen M, Rajala U, Jokelainen J, Keinanen-Kiukaanniemi S, Meyer-Rochow VB, Rasanen P. Depressive symptoms and insulin resistance in young adult males: results from the Northern Finland 1966 birth cohort. Mol Psychiatry. 2006;11(10):929-33.
23. Timonen M, Salmenkaita I, Jokelainen J, Laakso M, Harkonen P, Koskela P, et al. Insulin resistance and depressive symptoms in young adult males: findings from Finnish military conscripts. Psychosom Med. 2007;69(8):723-8.
24. Lawlor DA, Ben-Shlomo Y, Ebrahim S, Davey Smith G, Stansfeld SA, Yarnell JW, et al. Insulin resistance and depressive symptoms in middle aged men: findings from the
Caerphilly prospective cohort study. Bmj. 2005;330(7493):705-6.
25. Roos C, Lidfeldt J, Agardh CD, Nyberg P, Nerbrand C, Samsioe G, et al. Insulin resistance and self-rated symptoms of depression in Swedish women with risk factors for diabetes: the Women's Health in the Lund Area study. Metabolism. 2007;56(6):825-9. 26. Lawlor DA, Smith GD, Ebrahim S. Association of insulin resistance with depression: cross sectional findings from the British Women's Heart and Health Study. Bmj.
2003;327(7428):1383-4.
27. Marmot M, Brunner E. Cohort Profile: the Whitehall II study. Int J Epidemiol. 2005;34(2):251-6.
28. Tabak AG, Jokela M, Akbaraly TN, Brunner EJ, Kivimaki M, Witte DR. Trajectories of glycaemia, insulin sensitivity, and insulin secretion before diagnosis of type 2 diabetes: an analysis from the Whitehall II study. Lancet. 2009;373(9682):2215-21.
29. Wallace TM, Levy JC, Matthews DR. Use and abuse of HOMA modeling. Diabetes Care. 2004;27(6):1487-95.
30. Collett D. Modelling survival data in research. In: hall Ce, editor. 2nd ed. ed. Florida2003.
31. Kumari M, Chandola T, Brunner E, Kivimaki M. A nonlinear relationship of
generalized and central obesity with diurnal cortisol secretion in the Whitehall II study. J Clin Endocrinol Metab.95(9):4415-23.
32. Goldberg DP, Hillier VF. A scaled version of the General Health Questionnaire. Psychol Med. 1979;9(1):139-45.
33. Golomb BA, Tenkanen L, Alikoski T, Niskanen T, Manninen V, Huttunen M, et al. Insulin sensitivity markers: predictors of accidents and suicides in Helsinki Heart Study screenees. J Clin Epidemiol. 2002;55(8):767-73. Epub 2002/10/18.
34. Callahan CM, Wolinsky FD. The effect of gender and race on the measurement properties of the CES-D in older adults. Med Care. 1994;32(4):341-56.
35. Love AS, Love RJ. Measurement suitability of the Center for Epidemiological Studies-Depression Scale among older urban black men. International Journal of Men's Health [Internet]. 2006.
36. Pradhan AD, Manson JE, Rifai N, Buring JE, Ridker PM. C-reactive protein, interleukin 6, and risk of developing type 2 diabetes mellitus. Jama. 2001;286(3):327-34. 37. Weiss LA, Pan L, Abney M, Ober C. The sex-specific genetic architecture of quantitative traits in humans. Nat Genet. 2006;38(2):218-22.
38. Tabak AG, Herder C, Rathmann W, Brunner EJ, Kivimaki M. Prediabetes: a high-risk state for diabetes development. Lancet. 2012;379(9833):2279-90. Epub 2012/06/12.
FIGURE LEGENDS
FIGURE 1: Association between indices of insulin resistance, insulin secretion and new onset
of CES-D depression over the 5-year follow-up in women
Figure 1 footnotes:
OR, Odds ratio for new onset of CES-D depression; HOMA, homeostasis model assessment;
Q, quintile.
Median and range for HOMA2 insulin resistance quintiles were for Q1: 0.45 (0.34- 0.52), Q2: 0.62 (0.53- 0.70), Q3 : 0.83 (0.71- 0.95), Q4: 1.12 (0.96- 1.35) and Q5: 1.87 (1.36- 7.69)
Median and range (%) for HOMA2 insulin secretion quintiles were: 48.8 (13.8- 55.3), Q2: 61.1 (55.4- 67.4), Q3 : 73.7 (67.5- 80.7), Q4: 89.6 (80.8- 100.7) and Q5: 122.9 (100.8- 416.5)
Model 1: Model adjusted for age and ethnicity
Model 2: Model 1 additionally adjusted for type 2 diabetes prevalence at baseline.
Model 3: Model 2 additionally adjusted for occupational grade, marital status, smoking,
stroke, coronary heart disease, hypertension, low HDL-cholesterol, use of lipid-lowering
drugs, central obesity, and cognitive impairment
TABLES
Table 1: Characteristics of participants according to onset of CES-D depression between phase 7 and phase 9
For each characteristic the % (for categorical variable) or mean (SD) (for continuous variable) are presented.
Men (n=2406) Women (n=739)
Onset of CES-D depression Onset of CES-D depression
Baseline characteristic No*
n=2264 Yes* n=142 P No* n=655 Yes* n=84 P Age (years) 60.6 (5.8) 61.7 (6.5) 0.04 60.5 (5.9) 60.2 (5.4) 0.62
Employment grade High 59.8 47.2 0.01 29.6 29.8 0.98
Intermediate 37.7 50.0 49.8 48.8
Low 2.5 2.8 20.6 21.4
Ethnicity White 96.8 89.4 <0.001 91.9 95.2 0.39
South Asian 2.4 9.1 3.8 3.6
Black 1.4 0.8 4.3 1.2
Marital status Married 86.0 77.5 0.005 59.8 64.3 0.43
Smoking status Non 48.9 45.8 0.31 58.5 54.8 0.09
Former 45.0 45.1 33.9 42.9
Current 6.0 9.1 7.6 2.4
History of CHD yes 5.7 11.3 0.007 4.0 9.5 0.02
Self reported stroke Yes 2.1 4.9 0.03 1.7 2.4 0.64
T2D Yes 6.7 9.1 0.25 7.2 5.9 0.68
Hypertension Yes 36.0 38.0 0.46 36.0 25.0 0.04
HDL-cholesterol (mmol/L) 1.46(0.36) 1.48(0.39) 0.70 1.84 (0.49) 1.91(0.45) 0.23
Lipid lowering drugs Use 10.2 15.6 0.04 8.7 9.5 0.80
Central obesity Yes 23.6 20.4 0.39 46.3 42.9 0.56
Cognitive Impairment
Table 2: Association between being in the low insulin secretion group and new onset of depressive symptoms in non diabetic women (n=687)
Abbreviations: Confidence interval, CI; CRP, C-reactive protein; HRT, Hormone replacement therapy; IL6, Interleukin 6; odds ratio, OR.
*Odds ratio for depressive symptoms in women with low insulin secretion (defined as having HOMA2-% B in the 1st quintile (HOMA2-%B ≤55.3 %) compared to those with higher insulin secretion (HOMA2-%B>55.3 %). Model A odds ratio in subgroups:
** 2.16, 95% CI: 1.24-3.76 in the 684 women with data on inflammatory markers,
† 2.89, 95% CI: 1.46-5.70 in the 423 women with data on waking cortisol and 2.80, 95% CI: 1.42-5.51 in the 427 women with data on cortisol slope.
‡ 2.48, 95% CI: 1.31-4.67 in the 486 women with data on menopausal status and 2.54, 95% CI: 1.24-5.19 in the 418 women with data on HRT.
Odds of developing CES-D depression for low vs. high insulin secretion *
OR 95% CI p
Model A: Adjusted for age and ethnicity (79 cases / n=687) 2.18 1.25;3.78 <0.001
Model B: Model A + additional adjustment for socio-demographic, health behavior and health status factors (79 cases / n=687)
2.14 1.18;3.89 0.01
Model C: Model A + additional adjustment for inflammatory markers **
CRP and IL6 (79 cases / n=684) 2.17 1.23;3.82 0.007
Model D: Model A + additional adjustment for diurnal cortisol patterns†
Waking cortisol (47 cases / n=423) 2.91 1.47;5.76 0.002
Slope across the day (47 cases / n=427) 2.74 1.40;5.42 0.004
Model E: Model A + additional adjustment for women’s health variables‡
Menopause status (56 cases / n=486) 2.44 1.29;4.62 0.006