https://doi.org/10.4224/20375392
READ THESE TERMS AND CONDITIONS CAREFULLY BEFORE USING THIS WEBSITE. https://nrc-publications.canada.ca/eng/copyright
Vous avez des questions? Nous pouvons vous aider. Pour communiquer directement avec un auteur, consultez la
première page de la revue dans laquelle son article a été publié afin de trouver ses coordonnées. Si vous n’arrivez pas à les repérer, communiquez avec nous à PublicationsArchive-ArchivesPublications@nrc-cnrc.gc.ca.
Questions? Contact the NRC Publications Archive team at
PublicationsArchive-ArchivesPublications@nrc-cnrc.gc.ca. If you wish to email the authors directly, please see the first page of the publication for their contact information.
NRC Publications Archive
Archives des publications du CNRC
For the publisher’s version, please access the DOI link below./ Pour consulter la version de l’éditeur, utilisez le lien DOI ci-dessous.
Access and use of this website and the material on it are subject to the Terms and Conditions set forth at
A Summary of the Findings of Recent Watermain Corrosion Studies in Ontario
Wakelin, R. G.; Gummow, R. A.
https://publications-cnrc.canada.ca/fra/droits
L’accès à ce site Web et l’utilisation de son contenu sont assujettis aux conditions présentées dans le site LISEZ CES CONDITIONS ATTENTIVEMENT AVANT D’UTILISER CE SITE WEB.
NRC Publications Record / Notice d'Archives des publications de CNRC:
https://nrc-publications.canada.ca/eng/view/object/?id=5140c339-2889-4b39-a58a-8c7d1ff057b3 https://publications-cnrc.canada.ca/fra/voir/objet/?id=5140c339-2889-4b39-a58a-8c7d1ff057b3
BIBLrOli1EQUE
IRC
CNRC -liifllT Consell national de recherches Canada Institut de recherche en constructionArlC-CArlC
National Research Council Canada Institute for Research in ConstructionA
Summary
01
the Findings
01
Recent Watermain Corrosion
Studies in Ontario
C
ana a
d'·'
1+1
/
A SUMMARY OF THE FINDINGS
OF RECENT W ATERMAIN CORROSION STUDIES IN ONTARIO
Robert G.
セ・ャゥョ
and Robert A. emmowKeywords
corrosion rates, watermains, galvanic effects, lead piping, copper piping, soil resistivity, chlorides, pH, failure rates
A SUMMARY OF THE FINDINGS
OF RECENT WATERMAIN CORROSION STUDIES IN ONTARIO
Robert O. Wakelin and Robert A. Oummow Corrosion Service Company Limited
369 Rimrock Road Downsview, Ontario
Canada M3J 302
ABSTRACT
This paper summarizes the findings of several recent watermain corrosion studies conducted for municipalities in Southern Ontario. The paper shows that where copper service piping is used, soil resistivity is the only soil characteristic which has a significant effect on the external corrosion rates. The corrosion rates of watermains connected to lead, galvanized iron, or ductile iron service piping, on the other hand, are found to be relatively independent ofsoil characteristics. Failure rates of iron watermains connected to lead or iron service piping are found to be consistently lower than those associated with copper service piping. Internal corrosion rates are found to decrease exponentially with time, with large diameter mains generally exhibiting higher rates than small diameter mains.
INTRODUCTION
In 1987, Ontario's Ministry of the Environment began to provide financial assistance to municipalities who wished to rehabilitate their water distribution systems. The initial stage of a rehabilitation programエケーゥcャャQャケ」ッョセゥウエウ ofa study ofsystem hydraulics and integrity, both of which are directly affected by watermain corrosion.
A total of thirteen watermain corrosion studies have been completed by Corrosion Service Company under this program to date, consisting ofthe analysis of approximately 120 corresponding pipe and soil samples, as well as the analysis of an additional 160 soil samples which were retrieved without pipe samples. The studies have also included a review of failure histories, repair methods, cathodic protection methods, etc. The objectives of such a study are to identify the factors which contribute to watermain corrosionfailures, and to determine the most effective means forrehabilitation.
METHODOLOGY
All soil and pipe samples were retrieved and submitted by the municipalities' waterworks crews. In some cases, samples were obtained on a random basis while the crews were conducting repairs or modifications to the piping, but in other cases the Sample locations were selectively chosen in order to examine the effects of specific environmental or structural factors.
Pipe samples were generally between two and three feet in length, and the corresponding soil samples were taken from undisturbed soil in contact with the pipe at the edge of the excavation.
Soil samples were analysed for electrical resistivity, pH, chloride ion concentration, and the presence of SUlphide ions. Soil moisture content and soil composition were observed qualitatively. Thepipesamples were inspected andphotographedin theasjoWldcondition, and werethen sandblasted to remove all earth, coating, and corrosion product adhering to the metal. The samples were then rephotographed, and evaluatedin terms ofmaximum pit depth, average pit depth, and percent surface area pitted.
RESULTS
In the discussion of the results which follows, the watermain corrosion rate is most often considered to be the rate at which the deepest pit penetrates the pipe wall (Le. the maximum pit depth divided by the age of the pipe). This shall be referred toas the MPPR,orthe maximum pitpenetration
rate.Furthermore, where soil resistivity is discussed, itis the "saturated" soilresistivity which is used (Le. the resistivity of the soil after the addition of a small amount of distilled water). As discussed below, the saturated resistivities are used since some soil samples had dried out before they were submitted for analysis, and moisture content was in most cases found to have only a minor effect on soil resistivity.
External Corrosion
Effect of Soil Resistivity and Water Service Material.
The external MPPRs for each of the pipe samples is plotted against soil resistivity in Figure 1.
The graph shows a tendency for external corrosion rates to decrease as soil resistivity increases. It is also apparent that the highest corrosion rates are experienced by watermains which are connected
to copper service piping, whereas watennains which primarily connect to lead, galvanized iron, or ductile iron services experience lower rates. This latter group includes those watennains whose original lead or galvanized iron services have been gradually replaced over the years with copper piping.
o Primarily Copper Services
• Primarily Leed, Galvanized Iron. or Ductile Iron Services
12000 14000
Figure 1 • External MPPR vs. Soil Resistivity and Service Type
'.
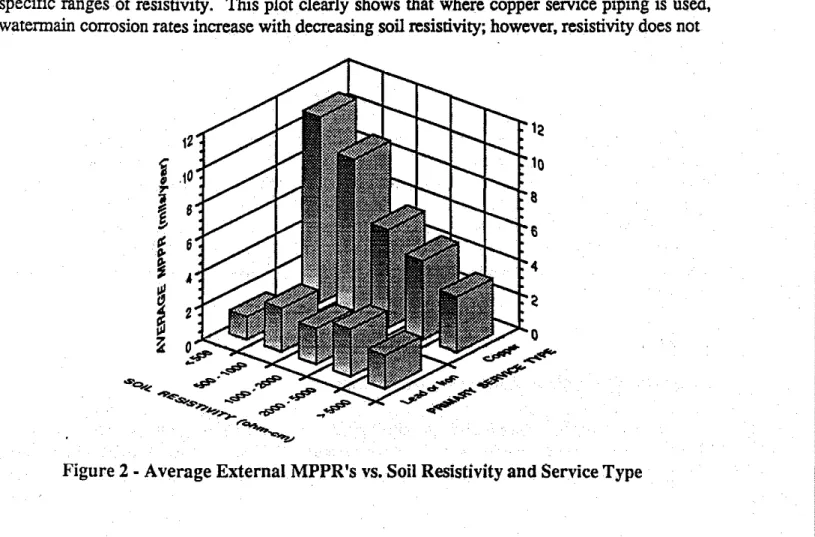
Inorder to more clearly show the effects of soU resistivity and galvanic coupling on corrosion rates, the average MPPRs associated with both types of service piping are plotted in Figure 2 for specific ranges of resistivity. This plot clearly shows that where copper service piping is used, watennain corrosion rates increase with decreasing soU resistivity; however, resistivity does not
12 12
j
.10 10.,..
8 セ §, 8 6 セ 6 p.セ
4 Iセ
2セ
2:;:
O,#' - . # , , # ' . - , ...--...,.. セNCG , ..#'" .#'" セNMャG^M -. LNNNセappear to affect the corrosion rates of watermains in the absence of strong galvanic coupling. It has been reported elsewhere soil resistivity is of importance only where macro-cell corrosion is present, such as in a galvanic couple(1).
Of the 120 pipe samples which were examined. the 40 samples associated with lead or iron service piping had an average MPPRof 2.1 mils/year. whereas the average MPPR of the 80 samples associated with copper service piping was nearly three times highe.. at6.0mils/year. Thirty pipe samples were obtained from soils having a resistivity of less than 1000
a-em.
and at these low resistivities. the average corrosion rate associated with copperservices (9.8 mils/year) was more than five times higher than that associated with lead and iron services (1.8 mils/year). Such information can be used to estimate the integrity of watermains. knowing only the soil resistivity and the service pipe material(2).Effect of Soil Chloride Ion Content
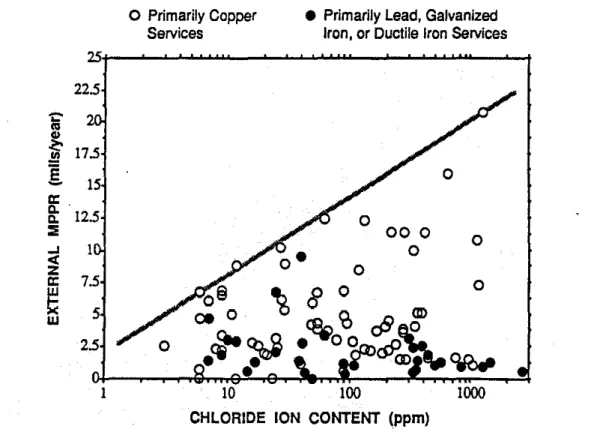
Southern Ontario municipalities make extensive use of de-icing salts during the winter months which can result in high concentrations ofchloride ions in a watermain trench. The external MPPRs for each of the pipe samples is plotted versus the chloride ion concentrations found in the soil samples in Figure 3. This graph shows a tendency for corrosion rates to increase with increasing chloride ion concentrations. but as in Figure1.this relationship seems to apply only where copper service piping is used. To clarify this. the average MPPRs associated with both types of service pipingareplotted in Figure4for specific ranges of chloride ion concentrations. This graph shows that the average MPPRs associated with copper service piping increase relative to the rates associated with lead and iron service piping, as the chloride ion content of the soil increases. The average MPPRs associated with the lead and iron services actually appear to decrease with increasing chloride ion content. but this is expected to be an anomaly resulting from the small sample group having high chloride concentrations.
o
Primarily Copper Services• Primarily Lead, GalvaniZed Iron, or Ductile Iron Services
o o
o
000 o o 25 22.5 'i:'..
セ 17.5 !!lE
15 -a: 0.. 12.5 0. :::;; ..J 1 <z
7.5 a:セ
5 w 2.5 0 1 10 100 1000CHLORIDE ION CONTENT (ppm)
10 9 8 7 6 5 4 3 :1 1
o
セセTGM-'
/ '
..;"/"
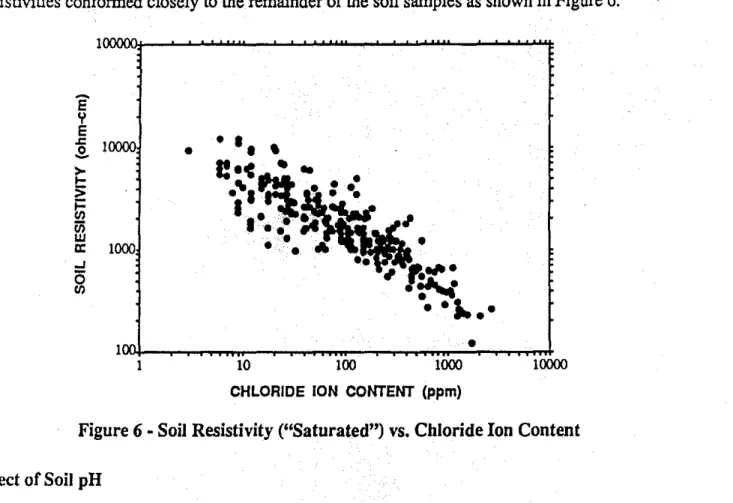
Figure 4 - Average External mpprセ VB.Soil Chloride Ion Content and Service Type Figure 5 shows that soil resistivity decreases with increasing chloride ion concentrations. This suggests that the relationship between corrosion rates and chloride ion concentrations observed in Figures 3 and 4 is not due toセッュ・ action of the chloride ion itself. but is primarily due rather to the effect of chlorides on soil resistivity.
• Wei Soil
o
MoislSoil X DrySoil10000'0:1---- - - ' - - - - "'1: o
I
.c 10000 ,g, o o o 10000 10 100 1000CHLORIDE ION CONTENT (ppm)
10000n_.-.-,..,..._.-.-,..,..._ ..._.;;...,...セ
1
Effect of Soil Water Content
The vast majority ofsoil samples examined were found to be either moist or wet, and there was little difference noticed between their "saturated" resistivities (measured after the addition of distilled water) and their "as-found" resistivities. The only notable exceptions were with about a dozen soil samples which were allowed todryout before they were submitted for analysis. These samples form the upper boundary of the data in Figure 5, but once they were saturated, their resistivities conformed closely to the remainder of the soil samples as shown in Figure 6.
1
-
E Y E r. 10000 .2-•
>セ
iii
iii w•
c: 1000 oJ5
l/) lOOI-...-...- ...-...,.,...--.-...-,;;,·... -..."'""..l-1 10 100 1000CHLORIDE ION CONTENT (ppm)
10000
Figure 6 • Soil Resistivity ("Saturated") vs. Chloride Ion Content Effect of Soil pH
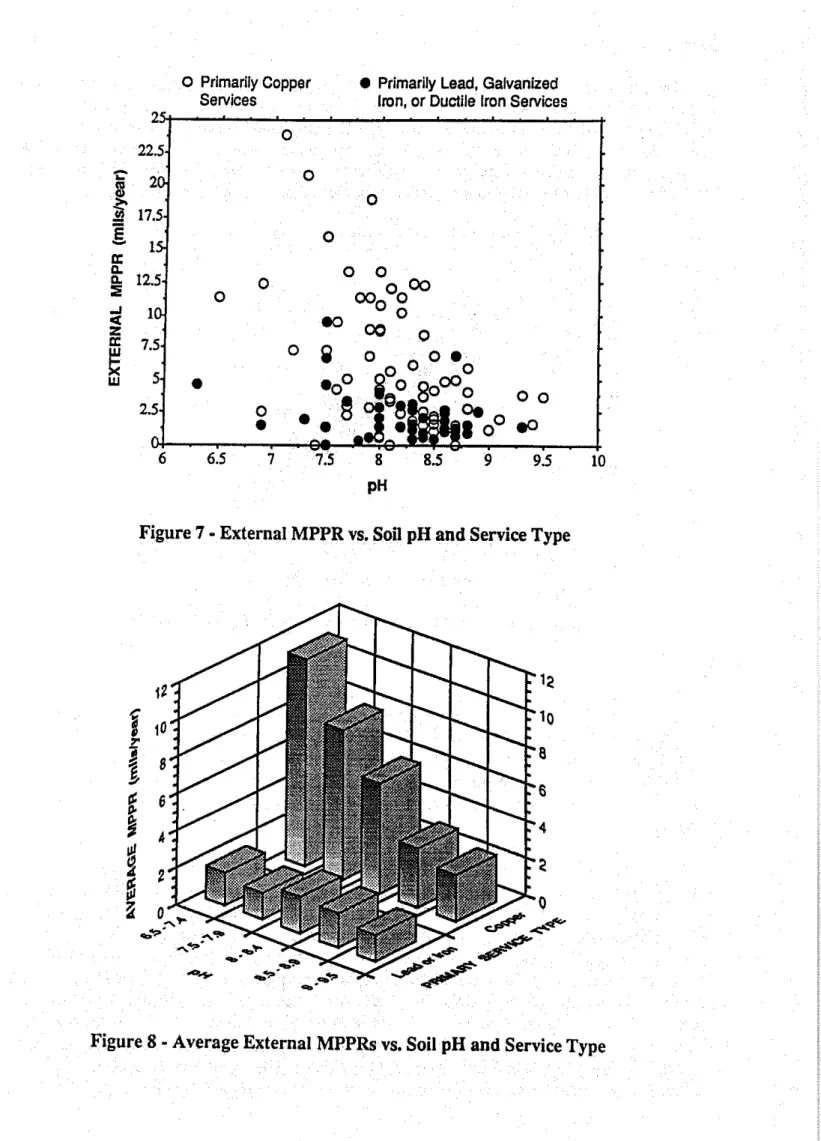
The external MPPRs for each of the pipe samples
are
plotted versus soil pHinFigure 7. This graph does not show a clear relationship between the two parameters, and so the average MPPRs for specific ranges ofpH are plottedinFigure 8. As was found to be the case with resistivity and chloride ion content, watermain corrosion rates are unaffected by pH where lead or iron service piping is involved, but corrosion z:ates associated with copper service piping decrease as the soil becomes increasingly alkaline.It is expected that the perceived effect of pH on corrosion rates is due to some relationship between pH and resistivity, rather than due to the pH itself. The average soil resistivities for several ranges of pH are plottedinFigure 9, and this graph does indeed show that soil resistivity increases with increasing pH, at least for this group of 120 soil samples which accompanied the pipe samples. Since there is no apparent reason why this should be so, the same relationship is examinedinFigure 10 after incI uding the data from an additional 160 soil samples which were retrieved without pipe samples. This plot shows that soils having a pH of less than 8.0 have an average resistivity which is about 35% lower than those soils having a pH of8.00rmore, but the relationship observedin Figure 9 is otherwise not found to hold true for soils in general. It is believed thatinthese sample groups, the soils exhibiting high resistivities often contained crushed limestone, which is alkaline in nature. The observed relationship between pH and soil resistivity is therefore probably mostly coincidental.
o
Primarily COPPer Services• Primarily Lead, Galvanized Iron, or Ductile Iron Services 2 22.5
-
..
J
E
-a: a. a. :E ..J 1 < Z a: 7.5セ
5 w 2.5 6o
o
o
0 0 0.a
0•
0 0 0•
.a
6.5 7 8.5 9.5 10Figure 7 • External MPPR vs. Soil pH and Service Type
12 1<
"
10 セ 10,..
e
セ
8 Eo 6セ
6セ
4 4セ
< it 2セ
?i
4000
'5
3500セ
3000 .c o - 2500セ
2000セ
1500 w セ 1000セ
500 6.5-7.4 7.5-7.9 8.0-8.4 8.5-8.9 9.0-9.5 pHFigure 9 • Average Soil Resistivities vs. pH (For Soil Samples Accompanying Pipe Samples Only)
4000
'5
3500セ
3000 .c o セ 2500 2: 2000セ
1500 w . セ 1000 (5 III 500 6.5-7.4 7.5-7.9 8.0-8.4 8.5-8.9 9.0-9.5 pHFigure 10 • Average Soil Resistivities vs. pH (For AIISoil Samples· 280 Samples Total)
Effect of Bare CCN Cables
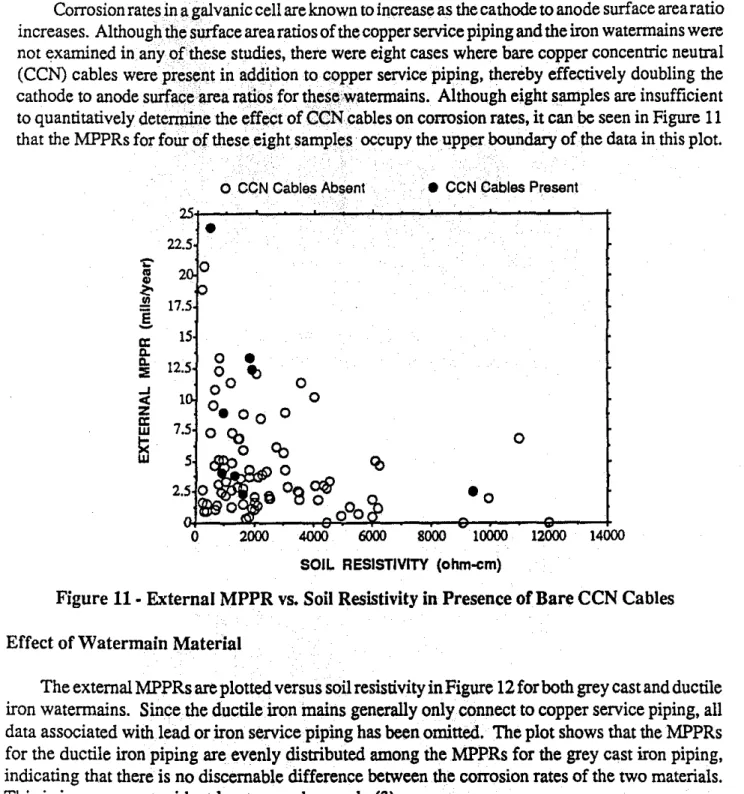
Corrosion ratesin 11galvanic cell are known to increase as the cathode to anode surface area ratio increases. Although we surface area ratios of the copper service piping and the iron waterrnains were not examined in any ()fthese studies, there were eight cases where bare copper concentric neutral (CCN) cables were present in 。セ、ゥエゥッョ to c()pper service piping. thereby effectively doubling the cathode to anode surfaqelirea ratios for t11ese\Vatennains. Although eight samples are insufficient to quantitatively detenpine the effeCt of CGNcables on corrosion rates, it can be seen in Figure11
that the MPPRs for four of these eight samples· occupy the upper boundary of the data in this plot.
o CCN Cables Absent • CCN Cables Present
2Si---'---__'-- ...
---''"---t
•
22.5 2 0 'i:'i
_ t7.5 E-
15 14000 12000 o 10000 8000o
o
2000 4000 6000o
•
o
セ 0 0 0 . 0 0 0Oeo
o
o
1 a:It
::E 12.5 セ z a:wE
SOil.. RESISTIVITY (ohm-cm)
Figure11 - External MPPR vs. Soil Resistivity in Presence of Bare CCN Cables Effect of Watermain Material
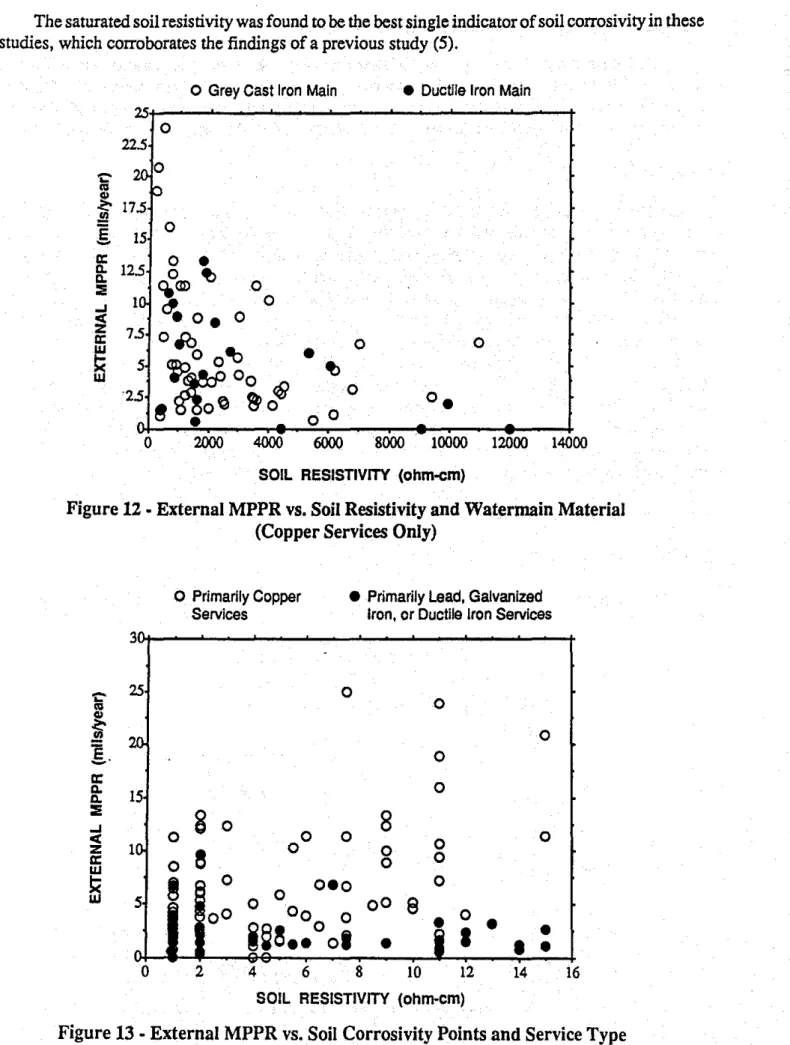
The external MPPRs are plotted versus soil resistivity in Figure12for both grey castand ductile iron waterrnains. Since the ductile ironinains generally only connect to copper service piping, all data associated with lead or iron service piping has been omitted. The plot shows that the MPPRs for the ductile iron piping are evenly distributed among the MPPRs for the grey cast iron piping, indicating that there is no discemable difference between the corrosion rates of the two materials. This is in agreement with at least one other study (3).
Effect of Soil Corrosivity (Ten-Point System)
The external MPPRs are plotted versus soil corrosivity as classified by the Ten-Point System(4) in Figure13. Points for redox potentials are not included in the point ratings, as this parameter was generally not measured in these studies. Although four of the five highest corrosion rates are found to occur in soils having a point rating of more than ten, no other correlation is evident. Other studies have also found poor correlation between corrosion rates and this point system (1,5). Some of the parameters in the ten point system are related primarily to micro-cell corrosion, which are of only minor importance in a macro-cell fonned by a copper-iron galvanic couple.
The saturated soil resistivity was found to be the best single indicator ofsoil corrosivity in these studies, which corroborates the findings of a previous study (5).
o
Grey Cast Iron Main • Ductile Iron Main 25·1---'----...- ...- -...- ...- - " " ' - - , o 22.5 200I
17.5P
o
§. 15 セo
0 0g:
12.5g •
!!!
ee
<ll)セo
セ
wセoNo
0 a: 7.5 0iO
セ
5セo
oセ
2.5セoセ
rS
・セッq
0'0 n ••
o oo
2000 4000 6000 8000 10000 12000 14000SOIL RESISTIVITY (ohm-em)
Figure 12 • External MPPR vs. Soil Resistivity and Watermain Material (Copper Services Only)
o
Primarily Copper Services• Primarily Lead. Galvanized Iron, or Ductile Iron Services 3 'I:'
..
25 0 0セ
20 0g.
0 a: 0 a. 15-a.::::
8
8
....l 0 0 0 0 < 10 0 0 ze
0 0 a: 0 0 0 wt<
8
0 0.0 0 w 5 0 0 008
00 0 0 0 0ゥセA
..
oo'
i
I
•
•
A•
•
•
0 2 4 6 8 10 12 14 16SOIL RESISTIVITY (ohm-em)
External Corrosion asa Cause ofWatermajn Failures
Some of the municipalities involved in these corrosion studies have maintained thorough break repair records for a number of years. By correlating watermain ages with break frequencies for each of these municipalities, it. was found that in every case, failure rates were significantly higher for the newer grey cast iron watermains (generally instalied after 1945) than they were for the older mains. Case History I
A municipality in the vicinity of Toronto recorded a total of 167 watermain failures between 1967 and 1989'for a specific study area within the city. Approximately 30% of the watermains in this study area were situated in a river valley, and the remaining 70% of the mains were located outside of the valley at a higher elevation. All of the mains were constructed of grey cast iron, although those in the valley were installed in the 1950's and were spun cast iron, whereas the mains outside the valley were installed in the 1920's and were pit cast. Surprisingly, 93% of the recorded failures occurred in the valley, corresponding to a failure rate of 0.88 breaks/kmlyear, compared to a rate of only 0.04 breaks/kmlyear outside of the valley. The municipality had reasoned that the higher water pressure in the valley was at least partially responsible for the high failure rate, and installed pressure reducers on the feeders running into the valley; however, this did not significantly affect the break rates. Soil testing revealed that there was no significant difference in the soil corrosivities of the two areas, however all of the mains in the valley had been installed with copper service piping, whereas the older piping outside of the valley had been installed with lead services. The high failure rate in the valley was concludedto be the result of extemal corrosion, resulting primarily from the copper-iron galvanic couple.
Case Histories II andill
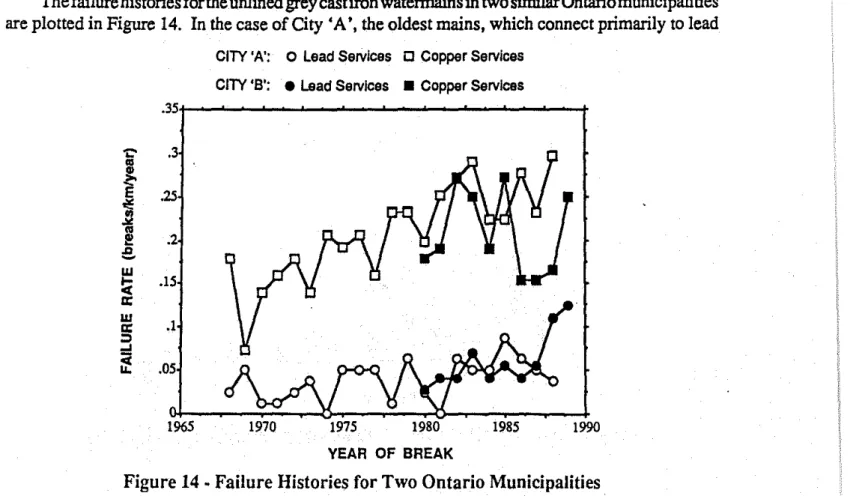
Thefailure histories forthe unlined grey cast iron watermains in two similarOntariomunicipalities are plotted in Figure 14. In the case of City 'A', the oldest mains, which connect primarily to lead
CITY 'A'; 0 Lead Services iJ copperServices
CITY 'B'; • Lead Services • Copperservices .35 'i:'
..
.3 セ E .25]
<Il l!! .2 .D-
W セ .15 II: w .1 II: :::l...
セ
.05 1965 YEAR OF BREAKservice piping, have consistently exhibited an average break rate of approximately 0.05 breakslkml year or less over the last 20 years. The break rate of the newer grey cast iron mains, however, which were installed with copper services, has steadily increased from roughly 0.10 breakslkm/yearto
about 0.25 breaks/kmlyear over this same period. City 'B' has experienced similar break rates on their watermains, although in the past few years the break rates for the older piping have approached those of the newer piping. Again, itwas concluded that the effect of the copper-iron galvanic couple was primarily responsible for this difference in break rates, but it was also found that in City'B',the ongoing replacement of lead services with copper services is resulting in increasing failure rates on the older watermains.
Internal Corrosion Effect of Watermain Age
The maximum internal MPPRs are plotted versus pipe age in Figure 15. These data form a band with well defined upper and lower limits which follow an exponential decay over time as predicted by Equation I (6):
P=kT" (1)
wherePis the depth of the deepest pit at timeT,andkandnare constants. This decreasing internal MPPR is the reason why internal corrosion is seldom responsible for watermain failures. Out of the 120 pipe samples which were examined in these studies, only one had failed by internal corrosion, this being a 45 year old cast iron watermain having an unusually thin 0.25" wall. Six-inch diameter grey cast iron pipe normally has a wall thickness of approximately 0.40", so internal perforations should be rare at the rates observed in these studies. However, the unlined ductile iron pipe which was commonly used in the early 1970's often had a wall thickness of only 0.25". Judging by the maximum internal MPPRs observedfor 20 year old watermains, it is predicted that internal corrosion failures of unlined Class 50 ductile iron pipe will become increasingly more common in the near future.
While the internal MPPRs are found to decrease with time, Figures 17 and 18 show that the percentage of internal surface area exposed to pitting continues to increase over time. Note that the pipe samples which were older than 80 years old appear to have only a small average surface area affected by pitting. This may be as a result of the small sample group size for this age range. Effect of Watermain Diameter
It is evident in Figure 15 that internal corrosion rates are greater for large diameter pipesセ 8") than small diameterpipesHセVBIN This is more apparent in Figure 16 which plots the average internal MPPRs over several ranges of pipe age for both large and small diameter pipes. Although it is not known with certainty what the reasons for the rate differences are, itisexpected that the larger volume of water carried by the larger diameter pipes results in a greater availability of oxygen at the cathode sites.
ComparisQn of Internal and ExternQI Corrosion Rates
For each of the pipe samples examined, an estimate was made of the average thickness of metal which was lost from the intemal and external surfaces. This was calculated as being the product of the average pit depth and the percent surface area pined. A frequency distribution of average metal losses for the unlined pipe samples have been plotted in Figure 19, and this shows that internal corrosion results in a much greater total metal loss than does external corrosion.
Figure 20 compares the MPPRs versus age for both the internal and external surfaces of the samples. The internal MPPRs occupy a relatively narrow band on this graph, compared to the external MPPRs which range from 0 to 24 mils/year. As previously discussed, the well. defined exponentially decreasing upper limit on internal MPPRs is consistent with the fact that watermain failures are seldom attributed to internal corrosion; however. no such limitis apparent for the external MPPRs. It might be argued that the external MPPRs also exhibitP=kT"behaviour. but the observed increase in corrosion rates with decreasing age is primarily due to increased use of copper service piping since the 1930's.
SUMMARY
Upon considering the information which has been accumulated in a number of recent water-main corrosion studies for Southern Ontario municipalities. it can be concluded that:
• External corrosion is the primary cause of failures on ductile and grey cast iron watermains.
• The use of copper service piping is the primary reason for high watermain corrosion rates, and hence, high watermain failure rates.
• Saturated soil resistivity is the best single indicator of soil corrosivity in cases where strong galvanic couples exist (i.e. copper services on iron watermains). • Chloride ion concentration is the primary factor controlling soil resistivity. • In the absence of strong galvanic coupling. no relationship could be found
between corrosion rates and the factors which are generally believed to affect soil
corrosivity. .
• Grey cast iron watermains corrode at the same rate as ductile iron watermains. all other factors being equal.
• Internal corrosion rates decrease with time. but increase with increasing pipe diameter.
o s 6" Diameter • セ S" Diameter 1 2 t - - -...- ...- - - -...- -...- - - t
•
2o
o
20 40 60 80 AGE (years) 100 120r
Figure 15 • Internal MPPR vs. Watermain Age and Diameter
9 II ? 6 5 4 3
<
,
o
o
s 6" Diameter • セ 8" Diameter 1 c 0 0 0セ
0 0 0 0 II. 0o.
< 0 W 0 a: < w 0 0 0 (.) < 0 0 0 0•
0 u. a: 0 ::l 0 0 0 0 en -J < COO • 00•
z
セᆱo 0 a:I!!
0 0 0•
00 0 3!: 0 セ 0.e
•
•
ceo ce
.,
00•
0 0 0 0 20 40 60 80 100 120 AGE (years)Figure 17 • Percent Internal Surface Area Pitted vs. Watennain Age and Diameter
ae
70 -cセ
60 II. < 50 w a:<
40 -J <z
30· a: wセ
20 w セ 10 <a:セ
0 <20 20-30 30-40 40-60 60-80 AGE (years) >80セッ 60 50 40 30
<a
10a
セセCG .;j><i!' セセO..
セFigure 19 • Distribution of Average Metal Losses from Internal and External Watermain Surfaces
o External Pitting • Internal Pitting
0 22.5 0 0 セ "-III 0 Gl セ !!!.
E
0-a:
11. 1 0 11. :Ii 7.5 0 5 2.5セ
0 80 100 120REFERENCES
1. Satomi Tsunoda, Tetsuro Akiba, "Some Problems in Evaluating Soil Corrosivity," Corrosion Engirteering, Vol. 36,nッNセL pp. 169-179, 1987.
2. R. G. WakeIin,R. A. GummO\v, "The Effect of Copper on the Corrosion of Iron Waterrnains," corrosionAセqL PaPi::i'.l"l'0'383, National Association of Corrosion Engineers, Houston, Texas, 1990.
3. P. J. De Rosa, R. W. Parkins9111 "CorrosionofDuctile Iron Pipe," Water Research Centre, Marlow, Bucks,lJrti@ Kingdom, QYXセN
4. American National Standard for Polyethylene Encasement of Ductile-Iron Piping for Water and Other Liquids. ANSI/AWWA Q05/A21.5-82. AWWA, Denver Colorado, 1982.
5. L. D. McMullen, "Advanced Concepts in Soil Evaluation for Exterior Pipeline Corro-sion," AWWA Seminar Proceedings: Corrosion Control, May 1982, Publication No. 20165.
6. M. Romanoff, "Underground Corrosion," National Association of Corrosion Engineers, Houston, Texas, p.38, 1989.