Regional Economies:
Structural PaƩ erns, Emerging Trends and Future Challenges
PIERREͳMARCEL DESJARDINS MARIO POLÈSE
RICHARD SHEARMUR
ii This report is funded by the Atlantic Canada Opportunities Agency (ACOA) under the
Atlantic Policy Research Initiative, which provides a vehicle for the analysis of key socio-economic policy issues in Atlantic Canada. The views expressed in this study do not necessarily reflect the views of ACOA or of the Government of Canada. The author is responsible for the accuracy, reliability and currency of the information.
Cette étude est également disponible en français :
www.ucs.inrs.ca/ucs/publications/collections/rapports-et-notes-de-recherche
laser.ucs.inrs.ca
ISBN 978-2-89575-292-9
Legal Deposit : Bibliothèque et Archives nationales du Québec, 2013 Bibliothèque et Archives Canada
© All rights reserved
Acknowledgements
This study is the result of a collaborative effort between two institutions: the Canadian Institute for Research on Public Policy and Public Administration (CIRPPPA) of the Université de Moncton, which managed the project and, in Montreal, the Centre-Urbanisation Culture Société at INRS (Institut national de la recherche scientifique) part of l’Université du Québec. The study was carried out thanks to the financial support of the Atlantic Canada Opportunities Agency (ACOA).
The authors thank the numerous persons who have helped us in this endeavour. At INRS in Montreal, we thank Gaëtan Dussault, indispensable in the design and production of the maps contained in this study, and Cindy Rojas for her help in the final aspects and web production of the study.
In Moncton at CIRPPPA), we thank Nicole Barrieau for her precious support during the first stages of the project, Réjean Ouellette for the French translation of the text, John Savage for his help with the French figures and tables and Céline Basque for her help in managing the project.
At ACOA, we thank Richard Cormier and Nadine Cormier for their support and their confidence in the study from the very beginnings. However, we owe a special debt of thanks to Maurice Mandale for his invaluable advice and unfaltering moral support all through the long process of the study’s production. The study is also in part his.
Pierre-Marcel Desjardins, Moncton Mario Polèse et Richard Shearmur, Montréal February 2013
ii
L’évolution des économies régionales du Canada : configurations structurelles, tendances émergentes et défis futurs
TABLE OF CONTENTS
Executive Summary 1
Chapter 1 – Introduction: An overview of some recent trends 29
Chapter 2 – Agglomeration: The continuing importance of cities 37 Chapter 3 – Geography, accessibility and geo-structural forces: an econometric approach 48
Chapter 4 – Location and industrial Structure 69
Chapter 5 – Amenities and the Residential economy 91
Chapter 6 – The Geography of Economic Inequality in Canada 106
Chapter 7 – Canada’s Northern Economy – New (and different) challenges 118
Chapter 8 – Conclusion: Directions for Future Research 125
Appendix 1 128
Appendix 2 129
Bibliography 130
Desjardins, Polèse and Shearmur Page 1
Executive Summary
1. The Context
In a study focused primarily on Quebec and the Atlantic Provinces (Polèse and Shearmur 2002), the authors examined underlying trends explaining regional differences in economic development in Canada. Simplifying somewhat, there were two overall conclusions.
The first conclusion of that study was that the factors explaining regional differences in development were deep-seated, rooted in the inescapable rules of economic geography, and could not be easily overcome, specifically the gap separating “central” urbanized communities and more peripheral, often resource-based, communities. The basic variables of size and distance continue to shape the location of much economic activity (outside the primary sector, that is), in Canada as elsewhere.
The report’s second conclusion was that many of Canada’s regional and local economies were undergoing substantial structural change as they moved from labour intensive to knowledge intensive activities. This structural change was having a marked impact upon communities with economies based upon resources and on first or second transformation manufacturing (though this process is not confined to any particular sector, but to types of jobs that happen to be more prevalent in these sectors). For these communities innovation and increased productivity was leading to employment decline as large numbers of low knowledge-content jobs were being replaced with smaller numbers of high-knowledge content jobs, with little prospect of local re- employment for the unemployed labour force1 (see figure 1 below). Given these processes and the geo-structural forces at play, the first report concluded that it was those regions best able to manage these structural changes and to envisage their future as smaller but more knowledge- intensive economies that would be best positioned to thrive. The first report therefore suggested that policy intervention be thought of as a process for managing these changes rather than as a process for halting or reversing them.
The study focused on the last three decades of the 20th century. The observed trends did not suggest that the rules were about to change. A decade later, it is appropriate to ask whether that conclusion still holds.
1 These processes also occur, in certain sectors, in larger cities. However, in large cities processes of creative destruction have served to mitigate the regional effects as new sectors emerge which can utilise the underutilised labour.
Desjardins, Polèse and Shearmur Page 2
4 24
1 9 14
Figure ES1 - Stylized Representation of Employment Trends in Peripheral Regions
Low knowledge employment
Total employment
employment decline to be managed
Employment
High knowledge employment
- Past Equilibrium Current period: disequilibrium
19 New equilibrium? 29
Time Source: Polèse and Shearmur (2002)
2. The Canadian economy victim of the Dutch Disease?
The Dutch Disease refers to “the negative impact on an economy of anything that gives rise to a sharp inflow of foreign currency, such as the discovery of large oil reserves. The currency inflows lead to a currency appreciation, making the country’s other products less price competitive on the export market.” (http://lexicon.ft.com/Term?term=dutch-disease).
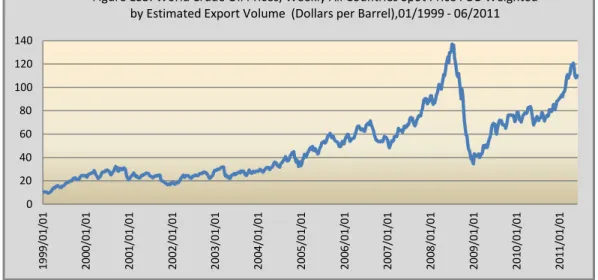
Canada seems to be suffering from the Dutch Disease. As can be observed in Figure ES2, the value of the Canadian dollar – compared to the U.S. dollar – has experienced a significant increase in the past decade. Comparing Figures ES2 and ES3, we can observe that there is a strong correlation between the rise of the value of the Canadian dollar and the rise of the price of crude oil, thus the link with the Dutch Disease.
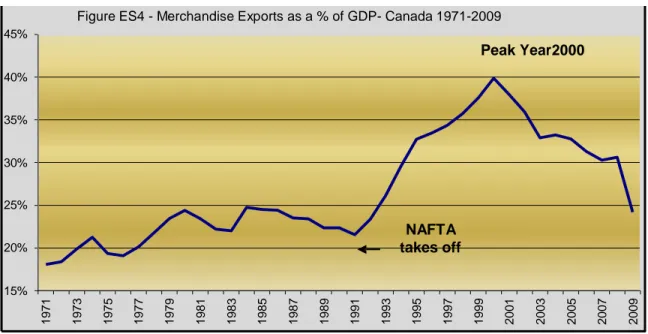
The other side of the Dutch Disease is – in the Canadian context – the relative decline of merchandise exports. Figure ES4 confirms such a decline. We do have a time lag as the decline of the relative importance of merchandise exports starts approximately 8 years after the start of the upward trend in the value of the Canadian dollar. This is not surprising as initially firms are able to “survive” in a higher Canadian dollar environment, but eventually the competitiveness challenge associated with it becomes insurmountable.
Desjardins, Polèse and Shearmur Page 3
1999/01/01 1999/01/04 2000/01/01 2000/01/04 2001/01/01 2001/01/04 2002/01/01 2002/01/04 2003/01/01 2003/01/04 2004/01/012004/01/04 2005/01/012005/01/04 2006/01/012006/01/04 2007/01/012007/01/04 2008/01/012008/01/04 2009/01/012009/01/04 2010/01/012010/01/04 2011/01/042011/01/01
For energy producing regions, the increase of energy prices has resulted in growth and prosperity, but the flip side of the equation is that non energy producing regions have suffered from the associated higher Canadian dollar and many of these regions are still scrambling to adjust to this new reality. The Dutch Disease is surely not the only factor at play – other factors are discussed in various parts of the report – but it seems to be an important one.
Figure ES2: $US vs $CND, 1999-2011 1.100
1.050 1.000 0.950 0.900 0.850 0.800 0.750 0.700 0.650 0.600
Source: Authors’ calculations from Bank of Canada. http://www.bankofcanada.ca
Figure ES3: World Crude Oil Prices, Weekly All Countries Spot Price FOB Weighted by Estimated Export Volume (Dollars per Barrel),01/1999 - 06/2011 140
120 100 80 60 40 20 0
Source: Authors calculations from U.S. Energy Information Administration.
www.eia.gov
Desjardins, Polèse and Shearmur Page 4
1971 1971 1973 19751974 1977 1977 1979 19811980 1983 1983 1985 19861987 1989 1989 1991 19921993 1995 1995 1997 19981999 2001 2001 2003 20042005 2007 2007 2009
45%
Figure ES4 - Merchandise Exports as a % of GDP- Canada 1971-2009
Peak Year2000 40%
35%
30%
25%
20%
NAFTA takes off 15%
Source: Authors calculations from http://www.ic.gc.ca/eic/site/tdo-dcd.nsf/eng/home 3. The 2008 recession reveals underlying symptoms
Something snapped around 2001, reversing past trends where merchandise exports as a share of national GDP was steadily rising (Figure ES4), especially after NAFTA (Section 1.3). What happened? Was it 9/11 and the subsequent tightening of the Canada-U.S. border? Perhaps. The rise of the Canadian dollar – discussed in the previous point – is certainly a factor. Since 2002, the share of Canadian exports destined to the US market has steadily declined, a decline in large part a reflection of the decline of exports from the automobile industry, an industry almost entirely concentrated in Southern Ontario. The post-2007 subprime ignited recession and subsequent collapse of the US auto industry cannot solely explain the drop in motor vehicle and auto parts exports as the downturn began some seven years earlier (Figure ES5).
120,000
Figure ES5 - Exports : Automobiles & Auto Parts (in current $) 1971- 2009
100,000
80,000
60,000
40,000
20,000
0
Source: Authors calculations from http://www.ic.gc.ca/eic/site/tdo-dcd.nsf/eng/home
Desjardins, Polèse and Shearmur Page 5 More deep-seated factors were also at play; but what are they? At the same time, manufactured goods (outside the auto industry) have steadily increased as a source of Canadian exports, now accounting for about half the total value of all goods shipped. This in turn suggests the emergence of a more diversified export base, rooted in competitive advantages specific to Canada’s different regions, which is not all bad news.
4. A reduction of interprovincial disparities
Cross-Canada regional disparities still matter (Section 1.4), but a close look at recent trends reveals a definite movement towards a lessening of interprovincial differences (Figure ES6). The most stunning regional turnaround of the last decade is without a doubt that of Newfoundland and Labrador. More surprisingly, if somewhat less spectacular, is the systematic move up in GDP per capita of the three Maritime Provinces. On the basis of current trends, one can argue that Atlantic Canada is no longer Canada’s economic stepchild or, if the trend continues, will soon cease to be.
Quebec’s GDP per capita – compared to Ontario – has ceased to deteriorate, picking up since the 1990s, although still systematically below that of Canada’s largest economy. In the west, Saskatchewan and Manitoba, which have historically been, with Quebec and the Atlantic Provinces, the lagging provinces in the country, have lately outperformed Ontario with respect to GDP per capita. This is especially true for Saskatchewan.
0.4
Figure ES6 - GDP per Capita. Provinces. Deviation from Canada Average,1990, 2000, 2008
0.3
0.2
1990 2000 2008
0.1
0
-0.1
-0.2
-0.3
-0.4
BC AB SK MB ON QC NB NS PEI NL
Source: Authors’ calculations from Statistics Canada data.
5. Accelerating structural change
The structural transformation of the Canadian economy has accelerated in the last ten years, mirrored not only in the shift in jobs out of manufacturing and primary sectors (with the notable
Desjardins, Polèse and Shearmur Page 6 exception of extraction) but also in the rapid growth of employment in the most information and knowledge-rich industrial class: professional, scientific and technical services (Section 1.5).
This shift continues to fuel the growth of large urban areas. Much of the fall in manufacturing employment between 2001 and 2006 was in high tech industries, reflecting the end of the 1994- 2000 techno boom and the subsequent collapse of Nortel. This did not have a lasting impact on the three urban economies (Ottawa, Montreal and Toronto) most affected by associated job losses, in part as a result of the capacity of large urban economies to replace job losses by growth elsewhere in the local economy. The same can be said of job losses in the apparel industry.
Job losses in industries generally located in small and medium-sized towns – such as pulp and paper, smelting and other highly capitalized industries – are a different matter. The affected labour force (primarily male) has skills which do not match the growing service and knowledge- based economy, which more over tends to concentrate in larger cities.
6. Does Canada still have an economic center of gravity?
We have observed a relatively good performance of Canada’s regional economies east of Ontario, at least in terms of GDP per capita (Section 1.4). If the trend continues, it heralds the possible – or at least the weakening – of the secular shift westwards of Canada’s centre of gravity.
7. The attractive power of cities continues to grow
Economic activity and people in Canada continue to concentrate in large cities (Section 2.1). The share of employment and population in Census Metropolitan Areas (CMAs) continues to grow.
Urban concentration tends to accelerate during periods of high growth and decelerate during recessions: growth stimulates concentration. What lessons can be drawn from these trends?
First, the most rapidly growing industries in the Canadian economy are also the most dependent on agglomeration economies; that is the advantages associated with a location in a large city.
Second, new information technologies (IT) do not on balance favour the decentralisation of economic activity; rather, the opposite is true.
The most consistently job-creating CMAs – both before and after 2000 – are either large metropolitan areas or places nearby (Section 2.3).
8. Challenges for non-urban economies
As described in point 8 above, the most rapidly growing industries in the Canadian economy are also the most dependent on agglomeration economies (Section 2.1). As long as this is so, larger cities will, on average, continue to grow more rapidly than small towns and rural areas. Regions lacking a large urban area (population at least 100,000) are at a handicap. Given current trends, there is little reason to believe that this will change.
It is u n realistic to expect growth automatically to revitalize outlying non-urban economies.
The maxim “a rising tide lifts all ships” does not hold in regional economics. The demand for labour may well be growing in a nonmetropolitan region, but it will be growing even more rapidly in cities.
Desjardins, Polèse and Shearmur Page 7 9. High tech
The highest concentrations of high tech manufacturing employment are in the largest CMAs, but also in “central mid-sized cities” (e.g. Kitchener-Waterloo) and nearby small towns and rural communities, which also show the greatest increases since 2001 (Section 2.2). The relative absence of high tech manufacturing in peripheral locations, whether urban or rural, is striking.
The geography of high tech manufacturing is thus different from that of knowledge-intensive services. Small size is not necessarily a handicap provided that the community is located at a reasonable distance from a large urban centre.
The importance of location, and not simply size, for high tech manufacturing is demonstrated by the clustering of employment in and around three cities, Toronto, Montreal and Ottawa, in what might be called Canada’s high tech core, accounting for 73.9% of associated jobs in 2006, compared to 75.5% five years earlier.
We would normally expect high-tech manufacturing (definition in Appendix 1) and knowledge- rich services to co-locate, with manufacturing often locating in small and mid-sized places close to large urban centers. Using location quotients2, we find that for knowledge-rich services, the five largest CMAs consistently exhibit the highest location quotients (Section 4.4). Quebec City is emerging as a knowledge-rich service centre, which now joins the other three large urban centres in Central Canada to form the “Central Canadian Corridor”. We can also point out that the apparently footloose nature of knowledge-rich services in non-metropolitan resource areas (i.e. Northern Alberta), with high quotients in one year, but not the other, is indicative of service firms (consultants, engineers) that move in times of boom and out in times of bust.
Map ES1 presents the relative concentration of high-tech manufacturing employment in 2006 for all of Canada, and highlighting Southern Ontario and Southern Quebec in the lower-left corner. We see the predominance of the area in and around the Toronto-Ottawa-Montreal triangle, Canada’s high-tech core. Smaller concentrations are also apparent in the Maritimes (the Maritime “cluster”) and around Winnipeg. Comparing these results for 2006 with those from 1991, we see an eastward shift in high-tech manufacturing in Central/Eastern Canada. It is also noteworthy that Edmonton and Calgary exhibit high-tech manufacturing concentrations below the Canadian average have also seemingly failed to generate concentrations in nearby small and mid-sized places3. These two are the only urban centres (together with Vancouver) with populations over 500,000 which, apparently, have not spawned what we may call a HT
2 Employment location quotients describe the relative importance of employment in a sector in a given region compared to the relative importance of employment in the same sector in a reference region (in this case, Canada)
3 The isolated concentrations in more remote areas should not be taken too seriously. They refer to very small numbers, but which appear big because the local economy is small. Thus, the apparently high quotient in northern Alberta refers to some 10 jobs in the medical equipment class. Such are the pitfalls of percentages calculated for small totals.
Desjardins, Polèse and Shearmur Page 8 manufacturing shadow. We may interpret this as further evidence that their respective strengths in knowledge-rich services is largely linked, notably in Calgary, to their role as service centres for the oil and mining sectors. Vancouver again appears surprisingly weak, although with quotients higher than for the two Albertan urban centres.
Map ES 1: Employment in High-Tech Manufacturing, Canadian Regions, Location Quotient, 2006
10. Southern Ontario’s challenges
Analyzing the percentage change in the unemployment rate between 200 and 2009, we find that the six CMAs that had the sharpest relative rise in unemployment are all located in Southern Ontario, including Toronto (Section 2.3). Focusing on the four CMAs located west or south of Toronto (Hamilton, St. Catherines–Niagara, London and Windsor), we find that the labour markets started to deteriorate in what is basically the stretch between Buffalo and Detroit well before the onslaught of the 2007-2010 recession with the breaking point somewhere between 1995 and 2005, depending on the city. Something has seemingly snapped in Ontario’s Peninsular South, but what?
Desjardins, Polèse and Shearmur Page 9
Figure ES7 - Unempoyment Rate. CMAs. % Change 2000- 2009
Windsor St. Catharines Toronto Kitchener Hamilton London Oshawa Calgary Thunder Bay Vancouver Edmonton Montréal Sudbury Abbotsford Winnipeg Halifax Ottawa Victoria Regina Saguenay St. John's Kingston Sherbrooke Saskatoon Trois-Rivières Saint John Quebec City
-0.50 - 0.50 1.00 1.50 2.00
Source: Authors’ calculations from Statistics Canada data.
11. The rise of yesterday’s laggards: the fragile turnaround of some resource regions The collapse of the ground fishery and downstream industries in the 1990s devastated numerous communities in Atlantic Canada, most notably in NL; the damage is still being felt (Section 1.5). However, the relatively positive performance of the three Maritime economies over the last ten years suggests that industrial diversification, although often painfully slow, is taking place, in this case towards locations with better access to markets. The transition, market access aside, may be easier for regional economies founded on fishing and – especially – farming, perhaps because of more deeply rooted traditions of small business and entrepreneurship.
The history of “heavy” and extractive industries is very different. The sharp decline in employment in the forestry and associated industries (pulp and paper mills mainly) is racking havoc in many small towns. Industrial reconversion and diversification is (and will be) difficult.
Some towns will decline or perhaps even close entirely. As extractive sector employment is growing while this is happening, many workers will be able to make the switch as skills requirement are not incompatible. Nonetheless, communities that loose these workers are not as fortunate.
Desjardins, Polèse and Shearmur Page 10 12. Canada’s large metropolitan areas
Focusing on employment in some of Canada’s largest metropolitan areas (Toronto, Montreal, Vancouver, Calgary and Ottawa) we find that since the mid 1990s, Calgary systematically exhibits the lowest unemployment rate (Section 2.4). Also, since the mid 1990s, the rates for Calgary and for Vancouver tend to rise and fall together, suggesting exposure to similar fluctuations in external demand. Montreal’s unemployment rate remains systematically above the Canadian average over the whole period, a reflection both of a (still) fundamentally weak labour market and the historically lesser mobility of Francophones. Most noteworthy, however, is the evolution of Toronto’s unemployment rate, moving from the lowest (best) to the highest (worst) position surpassing even Montreal’s unemployment rate for the first time since Statistics Canada began to publish such data (1966). Analyzing each of these areas’ recent trends, we find some positive signs and some less so:
The Greater Ottawa area seems, on the whole, to have to have survived the dotcom bust (notably the fall of Nortel) without too much damage and appears poised for continued growth.
Montreal, although still a comparatively slow growth economy, appears poised on a renaissance of sorts, founded on its diverse industrial base, the apparent strength of Southern Quebec’s manufacturing cities, and on a growing specialization in cultural and “creative” industries.
Vancouver continues to grow and to attract people, irrespective it seems of the broader economic context. An appropriate designation might be the Teflon city, whose growth is as much founded on its “residential” as on its economic advantages.
Toronto shows signs of over-specialization in finance and related industries, making it overly vulnerable to business cycles. Given also the current poor performance of manufacturing in Southern Ontario, one may question whether Toronto’s current growth rate is sustainable.
Calgary remains highly specialized in extractive-linked industries (the oil patch) with few clear signs that its economy is diversifying. Here again, one may ask whether its current growth is sustainable.
13. A synthetic region approach
A key question concerns the extent to which growth differences observed across one dimension are in fact attributable to other factors (Chapter 3). For instance, it is legitimate to ask whether the differences in growth rate observed between Alberta and Ontario are attributable to differences in industrial structure, differences in level of urbanisation, differences in human capital, or to some factors specific to each province and not reducible to these other dimensions. To answer these questions, we use regression analysis. In turn, we use various regional definitions and various variables. We thus use regional groupings with provinces as the
Desjardins, Polèse and Shearmur Page 11 reference, labour markets as well as what we call synthetic regions. This is done by subdividing Canada according to city size and centrality using as a criteria a 100-150km distance (a maximum of a 90 minute drive) from a major metropolitan area. The resulting regional groupings are what we call synthetic regions.
What do these regression analyses tell us?
First localities in Ontario are now, all else being equal, the slowest growing localities in Canada (the situation is probably even more marked now, since the results in the pertinent model only extend to 2006). This is a medium term trend, since, after controlling for industrial structure and accessibility, Ontario’s slower growth began to emerge in the 1990s.
Second, differences within provinces (i.e. synthetic regions) are becoming increasingly important for understanding local development, even as differences between provinces are losing their dominant role.
Third, notwithstanding straightforward correlations and initial regression results to the contrary, local factors seem to have little systematic connection with local growth. Their connection with local growth is determined by the nature of the local economy and by its accessibility to outside markets. Localities, especially smaller ones, are a little like boats on the sea: although their captain, crew and rigging can make a difference, weather conditions will often determine the success or failure of their journey. The larger the ship, the more it is able to slice through the weather and determine its own course.
Perhaps the key result of this analysis is the increasing importance of industrial structure in determining local employment growth, which seems to have been particularly important in the early 2000s. Given the crisis in the financial and automobile sectors since 2008 – which have hit southern Ontario particularly hard – and given the continued role that oil and gas extraction, and mining, play in many parts of Canada, it is unlikely that the effect of industrial structure on local development outcomes will decline in the foreseeable future.
14. Industrial structure / specialization
We will not dwell in any great detail over which types of structure are connected with (or not connected with) employment growth (Section 3.4). The important point is that a key factor in understanding why a particular locality grows or declines is, increasingly, the type of industry there. This may appear obvious, but has important policy implications. The growth or decline of particular industries is usually driven by global markets, technological factors and exchange rates. None of these can be controlled or influenced by local authorities, and most are beyond the power of influence of national governments (though these governments can, of course, influence the rules that govern the way in which these factors impact industries within the country). Furthermore, each locality has an industrial structure that only changes slowly over
Desjardins, Polèse and Shearmur Page 12 time (Shearmur and Polèse, 2005b) – it is difficult (though not impossible) to overcome an industrial heritage, but this can take generations. It is not a matter of simply switching industrial structures over a three year period.
15. Distance still matters: the importance of accessibility
Canada is highly integrated in the North American and world economies, but access to these markets is not homogeneous across the country’s regions. It is thus legitimate to wonder to what extent having good access to markets increases or decreases a locality’s level of employment growth. Furthermore, accessibility is not a one dimensional concept. We thus use a regression model which allows us to analyse the impact of four types of accessibility: road, air, rail and ports. Finally, we add population size, as it reflects local market size.
We find that during the 1990s, slower growth in Atlantic Canada localities can be attributed to their lower accessibility. This is not so in the early 2000s, when localities in Atlantic Canada grow more slowly even after taking their accessibility into account. The same general trend appears when we focus on the impact of industrial structure in Canada combined to accessibility. During the 1990s, the impact on local growth of a particular structure varies depending on how accessible the locality with that structure is to markets. By the early 2000s industrial structure is playing a predominant role in understanding the growth in localities, and this role is not greatly modified by controls for accessibility. Finally, including accessibility in our synthetic region (i.e. a combination of size and relative proximity to large metropolitan areas – point 15) analysis alters, but does not completely overshadow the synthetic region effect. In particular, it highlights the fast employment growth during the early 2000s in medium sized peripheral cities, and the fact that growth in central regions in the late 1990s was primarily attributable to their high market accessibility.
What types of accessibility are associated with employment growth? In the early 1990s it is access to ports, local road accessibility, access to outside markets and large local markets that are associated with local employment growth. In the late 1990s local road accessibility, access to outside markets and access to ports are connected with employment growth. In the early 2000s none of the three principal dimensions of accessibility play a role (after controlling for other factors), probably reflecting the resurgence of employment growth in resource industries located in peripheral (and hence not necessarily accessible) regions.
16. Distance still matters: the case of wholesaling and distribution
An analysis of the concentrations of employment in wholesaling and distribution in 1991 and 2006 confirms that this industry is sensitive to location, specifically to market accessibility, but also highly sensitive to scale economies (Section 4.3). The picture for 1991 confirms the importance of “centrality”; that is, the tendency to seek out a location as close as possible to the geographic centre (or transport hub centre) of the market to be served. Much like
Desjardins, Polèse and Shearmur Page 13 manufacturing, due to their space requirements (large warehouses, areas for trucks, etc…), marketing and wholesaling activities, although naturally drawn to large urban centres, will not necessarily locate directly in a large city, but rather in smaller places nearby with lower land costs, and with good road (and rail) connections. Thus we have a concentration around Toronto and Montreal. Three regional centres also stand out: Vancouver, Saskatoon, and Moncton, the latter two favoured by the centrality of their location, respectively in the centre of the Prairies and the Maritimes. Other concentrations are found around Calgary, Winnipeg, and Halifax.
The picture in 2006 is not all that different, with however an apparent strengthening of the greater Toronto / Southern Ontario region compared to others, suggesting a growing centralization of distribution activity in Canada, the combined outcome most probably of technological change (bar codes, containerization, etc..) and organizational changes (Super stores…) allowing for ever greater economies of scale. It also confirms the continuing presence of regional distribution centres, plus the emergence, apparently, of distribution points along the U.S. border (note southern Alberta) and centres to service Northern resource economies.
Rouyn-Noranda and Val-d’Or in the Abitibi region of Quebec are examples of entry and distribution points for exploration, mining and hydro power activities further north.
17. “Love thy neighbour”
Maps ES1 and ES2 illustrate the geography of population change in North America for the years, respectively, 1990 to 2000 (1991 and 2001 for Canada) and 2000 to 2006. At least two things stand out:
a) the Canada-US border makes little difference; it would be difficult to identify did we not know it existed. Population trends reflect similar basics on both sides of the border; and b) the trends are essentially the same for the two time periods. Three broad swathes of
territory in North America seem to be irremediably emptying out: 1) the great dry interior of the continent stretching from south Texas to central Saskatchewan; 2) the cold North-east (basically the Canadian Shield) stretching from Northern Ontario through Northern Quebec to Newfoundland and Labrador; 3) the Appalachian spine stretching from Eastern Kentucky to Upstate New York. Parts of the central Midwest and the Mississippi Valley also continue to lose population. In all of these areas, some places (urban places notably) are growing, but the overall picture is one of systematic decline, driven by forces that are seemingly difficult to reverse. Without necessarily falling into the trap of geographic determinism, Maps ES1 andES2 are evidence of the continuing power of geography. Some locations are simply more advantageous than others.
Desjardins, Polèse and Shearmur Page 14 Map ES 2: Population Growth, North American Regions, 1991-2001
Map ES 3: Population Growth, North American Regions, 2001-2006
Desjardins, Polèse and Shearmur Page 15 At least three major growth corridors stand out centered around U.S. Interstate Highways: 1) an eastern corridor – basically following I-95 and I-85 – stretching from New York to Atlanta; 2) a mid-continent corridor – along I-35 and I-44- stretching from the Mexico-Texas border to Chicago, a continuation of the principal trade route linking Mexico City and Monterrey, Mexico, to U.S. markets; 3) a northern Midwest corridor – via I-94 and I-29 – linking Chicago with Minneapolis-St Paul, but also with Winnipeg.
Seen in this light, it is impossible to totally divorce the evolution of Canada’s regions from that of US neighbours. Who the neighbours are will not only influence growth trends but also industrial structure and trade relationships. Canadian provinces have a particular strong trade relationship with the immediate neighbours to the south, and NAFTA has amplified these relationships in various regions along the Canada-U.S. border.
The regionalized nature of cross-border relationship also sheds a different light on Toronto’s role as a business service centre. Although indisputably number one – certainly in finance (recall chapter 2) – Toronto’s strength is in part founded on its location at the centre of Canada’s largest regional economy and also in its role as corporate intermediary with U.S-based partner corporations. Toronto’s integration into the Midwest U.S. economy, certainly more so than Montreal or Vancouver, probably goes some way in explaining its comparative underperformance in recent years. By the same token, a second look at Maps ES1 and ES2, provides elements of explanation for the relatively good performance in recent years of southern Manitoba (in and around Winnipeg) and parts of the Maritimes. The Maritime Provinces, although not located on a highly visible growth corridor, are linked to a neighbour – New England - which has witnessed a remarkable turn-around in recent years, fuelled by Boston’s growing high-tech economy. In cases where cross-border cost or regulatory differences make it advantageous to produce certain products (or parts) in nearby Canadian locations, New England-based firms may be tempted to look to the Maritimes.
Similar reasoning can be applied to Southern Quebec and to Lower Mainland B.C. (for Seattle- based firms). And the presence of continental growth corridors alters the perception of Winnipeg and surrounding Manitoba as irremediably poor locations (weather notwithstanding, about which little can be dome). From a continental perspective, Winnipeg is clearly
“peripheral”; but it is located at the northern tail end of an apparently dynamic growth corridor.
18. Manufacturing corridors
Map ES3 illustrates the location of manufacturing employment in North America (Section 4.2 – 4.3). The U.S. – Canada border seems to make little difference, with however the notable exception of Southeastern Quebec and the Maritimes. Access to ports, waterways, and other manufacturing clusters are visibly major location factors. Almost no manufacturing takes place
Desjardins, Polèse and Shearmur Page 16 in the Great Plains and the Prairies (with the exception of Southern Manitoba, which shows up as a geographical extension of manufacturing activity in Northern Minnesota).
Technological changes notwithstanding, water remains the most cost efficient transport mode, specifically for long-hauls and bulk, and necessarily so for cross-oceanic merchandise trade (except very high value-added, relatively light-weight goods, transportable by air). All other things being equal, a producer dependent on overseas trade will seek to minimize the time and distance goods travel overland (at higher unit costs) and to maximize the distance by water.
Containerization has lessened the need to be located directly alongside a port – now simply a momentary stopover in an otherwise seamless logistics chain - but it has not reduced the cost advantage of locations within a reasonable trucking (or rail) distance of a port, generally within a 100 to 200km range. The implications of this for Canadian regions are not difficult to deduce.
Most manufacturing, unless directly tied to resources (and even then), will generally seek out locations within a reasonable distance of a port, preferably a container port.
Map ES 4: Location Quotient, Manufacturing, Canada-U.S., 2001
19. Costs matter I: the intrusive rentier revisited
In Polèse and Shearmur (2002) we introduced the Intrusive Rentier Syndrome concept to help explain why local resource-based economies, in particular those in peripheral regions, find it difficult to diversify into other sectors. The term “rentier” refers to firms, generally large and highly capitalized, that are able to earn a premium (a “rent” in economic parlance) due to a
Desjardins, Polèse and Shearmur Page 17 particularly rich local resource, be it trees, hydro power, oil or something else. In Eastern Canada, large paper mills, aluminum plants, and smelters are typical examples. They are
“intrusive” (no insult intended; this is economic shorthand) because they: a) drive up local wages; b) undermine the competiveness of other sectors; c) create a mindset which is not necessarily conducive to business start-ups and innovation. Such “local” factors are almost impossible to measure and, as such, difficult to model. Much of the evidence is admittedly impressionistic. However, high-cost resource-based economies have, as a rule, found it difficult to diversify into other sectors. As is pointed out in chapter 3, high wages can have two opposing effects, again making it difficult to model a simple statistical relationship. On the one hand, high wages generate local demand and attract talent and human capital; on the other, they can act as obstacles to diversification and growth; that is, if the wages paid are above what “normal”
market conditions would warrant.
The idea we shall explore here is that the Intrusive Rentier Syndrome is not necessarily limited to peripheral resource-based economies; that larger urban economies and regional economies not dependent on resources are also potentially vulnerable. The vulnerability of Albertan communities, including its two largest urban centres and resource-driven Canadian regional economies is, by this argument, fairly self-evident, requiring little further comment. More to the point is the possibility that variants of the Intrusive Rentier Syndrome may be taking hold in other parts of Canada, specifically in southwestern Ontario, the traditional heart of the automobile industry.
20. Costs matter II: labour costs and other factors
Map ES3 tells a second story. In the U.S., the highest concentrations of manufacturing employment are no longer found exclusively in the industrial heartland of the Midwest, the so- called Rustbelt (basically, the Pittsburgh-Detroit-Chicago axis) and even less so in the old eastern industrial cores of New York and Philadelphia. Plants have moved south: textiles and clothing into the Carolinas; automobiles and other steel-based industries down the river and highway systems leading to the Gulf of Mexico. Interstate I-66 linking Chicago and Mobile is the classic corridor of delocalisation for auto plants. One of the reasons for this industrial exodus essentially boils down to the desire to escape high labour costs and unionization. Southern States have historically lower labour costs and are traditionally less union-friendly. They also had the added advantage (besides good transportation infrastructure) of a fairly dense network of good-sized cities, able to provide the specialized services modern manufacturing has come to rely on.
Note the concentrations of manufacturing around Atlanta, Birmingham, and Nashville. In the late 1990s and early 2000s, after controlling for region, synthetic region, human capital and level of specialisation, employment growth tended to be faster in low wage localities. The effect is quite large. For each increase in $10 000 in local wage levels local employment growth is 1.9% (early 2000s) to 4.2% (late 1990s) lower. This effect disappears in the early 2000s after controls for industrial structure, but the negative effect remains for the late 1990s.
Desjardins, Polèse and Shearmur Page 18 In some cases, comparatively low wages are not necessarily associated with more jobs, a sign that the Intrusive Rentier is not simply a matter of wages, but also in some cases of legacies left behind by industrial structure, whether sociological, aesthetic or other, long after the plants or mines closed and wages fallen -.In cases such as Cape Breton and Sudbury distance (from markets) also comes into play, meaning that even a fall in wages, unless very sharp, may not be sufficient to re-establish competiveness. On the other hand, the example of Moncton (NB) serves to highlight the fact that a local economy can successfully manage reconversion). It is a mid-sized urban economy founded on services rather than manufacturing. Moncton is a regional hub and distribution centre, exhibiting high location quotients in rail, air, and courier services;
but also in professional and scientific services and in broadcasting and insurance, the latter two in part the reflection of its role as the cultural and (mini) corporate centre for the Acadian community. This is in contrast with the situation prevailing not more than a few decades ago. The city experienced the demise of its industrial base – the rail rolling stock maintenance industry – starting in the 1960s and culminating in the 1980s with the closure of the “Moncton Shops”.
Moncton’s successful reconversion was in part founded on a unique combination of location and local dynamics. Its workforce has “successfully” adjusted to changing wage and work conditions.
21. Costs matter II: Southern Ontario vs Southern Quebec
Wages are, as a rule, higher in larger cities, a reflection of the positive impact (on productivity) of agglomeration economies. Also, as expected, wages are generally higher in “central” cities, closer to large CMAs, than in more distant cities of a similar size. In Figure ES8, where we present Southern Ontario and Southern Quebec cities in declining population order, we do find that the relationship between wages and population size is not straightforward. The same could be said of other regions in Canada. Several factors are at play, such as the impact of “Rentier”
cities driven by resources. But getting back to Figure ES8, why are wages systematically lower in Quebec cities compared to cities of comparable size in Southern Ontario? Many factors influence wages; a satisfactory answer would require a more complete statistical analysis. In efficiently functioning labour markets wage differences are in principle perfect reflections of productivity differentials. Many factors, in turn, influence labour productivity, among which are education and the quality of the capital stock and of public infrastructures. However, wage differences at any given moment in time are also a reflection of the interplay between supply and demand. If supply is “sticky” (does not, in the case at hand, fall when wages are low) then wages may well stabilize at a level which is below what pure productivity differentials would warrant. Francophones are, as a rule, less geographically mobile than Anglophones, producing “stickier” labour markets. It may well be that small and mid-sized towns in Southern Quebec enjoy a “productivity premium” for certain types of manufacturing;
that is, labour costs are lower for comparable productivity levels, lower specifically than in Ontario and in neighbouring U.S. states.
Desjardins, Polèse and Shearmur Page 19 Figure ES8: Earned Income per W orker- Southern Ontario and Southen
Quebec Cities (Compared to 36 City Average) 2006.
Cities are ordered by population size from top (largest) to botton (smallest) Québec
Hamilton London Kitchener St. Catharines - Niagara Oshawa Windsor Sherbrooke Barrie Kingston Guelph Brantford Peterborough Belleville Sarnia Saint-Jean-sur-Richelieu Drummondville Granby Cornwall Saint-Hyacinthe Victoriaville Sorel-Tracy Joliette Brockville Woodstock Saint-Georges Thetford Mines Rivière-du-Loup Pembroke Cobourg Port Hope Petawawa Cowansville Hawkesbury Sainte-Marie Montmagny
Ontario Cities in Red.
Quebec Cities in Blue
$25,000 $27,000 $29,000 $31,000 $33,000 $35,000 $37,000 $39,000 $41,000 Earned Annual Income
Source: Authors’ calculations from Statistics Canada data.
Desjardins, Polèse and Shearmur Page 20 Let us return to the Intrusive Rentier. Not only in several cases do Southern Ontario firms face a more mobile labour supply, more prone to move out, but also a local industrial structure dominated by large, highly unionized, plants, producing an environment of high wage expectations. Hamilton and Woodstock are cases in point, with historical concentrations, respectively, in steel and in the auto industry. The industrial specialization may have disappeared, but the legacy can linger on. It is difficult to precisely factor in all the elements that explain inter-city (or inter-regional) wage differences. It is as difficult to rigorously prove that wages in some Ontario labour markets are above what pure productivity indicators would allow as it is to prove that those in certain Quebec markets are below. However, the data suggests that the possibility cannot be excluded.
Analysing successful small centres in Southern Quebec compared to Southern Ontario, we have identified some factors which may explain – at least in part – the differences. These are labour costs (lower wages and a more stable (less mobile) labour force), location (proximity to major urban centres, to a major container port, to the U.S. market, and having fairly dynamic U.S.
neighbours), and the industrial structure (a historical legacy of low wage industries).
22. The residential economy: the rentier economy
A residential economy is an economy that survives not because it trades goods or services, but merely because people live and spend money there that has been earned elsewhere. If the number of such people in a given community is sufficiently important, we can have a functioning economy – with local services, construction companies and retail – that lack any export or trade base.
The first mechanism through which a residential economy can exist is presence of rentiers, a definition usually associated with people who live off investment income and can choose to live in locations that are far from the place where their money is invested. However, this aristocratic image of rentiers needs to be re-evaluated in the light of an aging population. Indeed, each person living off retirement income is a rentier. Therefore, the number of rentiers in Canada is dramatically increasing. If some of these people migrate, and if they tend to migrate to the same areas, then they will have a considerable economic impact, particularly on smaller communities in which it does not take much to keep the local store open and the local services functioning.
Why would these people migrate? There are a variety of reasons, we raise four possibilities: to be closer to children and grandchildren, to be closer to hospitals and medical services, to move to a previous place of residence, and to live in a pleasant and affordable location.
Desjardins, Polèse and Shearmur Page 21 23. The residential economy: Long distance commuters
Long-distance commuters can have a strong influence on small local economies. There are two ways that this can occur). First, there is an increasing number of people, particularly professionals and creative people, who do not need to go to a central place to work every day. These people can often work from home at least part of the week, even if their workplace is in a city and they need to get to the city (or at least to the international airport) regularly. Given their lower frequency of commutes, these commutes can be longer, so it is increasingly possible for people who work in cities to live 100km or more away from the city. The localities where they live usually have their own economy, so these long-distance commuters are rarely the only market for local services and retail. But their presence may have an important marginal effect on localities where local demand for personal services, retail and construction may not otherwise be high enough to sustain the supply (and hence the jobs) in these sectors.
Second, there are even longer ‘commutes’ across provinces and across the country.Mines, logging and oil extraction are increasingly being organised on a fly-in, fly-out basis, or, as often in Alberta, with a mobile workforce that is only there temporarily for the construction phase. Such very long-distance commutes are not, of course, done on a daily basis. However, the key factor that links them to the idea of the residential economy is that these workers often live, and have families, at a location different from where they work. Although their income is derived from productive activity occurring, for example, in Alberta’s oil-sands, most of it is spent at their place of residence, which may, for instance, be Rouyn-Noranda or Corner Brook
24. The residential economy: second homes and cottages
A final driver of residential economies is second homes and cottages .In Canada the expression
‘cottage country’ denotes localities that usually rely on temporary residents for their service industries to survive. This must be distinguished from places that rely on tourism: tourists do not invest locally. Rather, it is businesses and local governments that invest, create a tourist product, which is then exported (although a tourism ‘export’ is in fact the ‘import’ of a tourist). Second homes do not function in this way. In this case it is individuals who choose to purchase a home, who spend money on maintaining it and who visit it on a regular basis, often over extended periods. There is no tourist product being sold, rather just day-to-day services necessary for the second-homers to eat, have their hair cut and run their (second) home.
It should be noted that the second home, retirement and long-distance commute effects may to some extent overlap, particularly in areas from about 50 to 200km from major metropolitan areas. Whilst it is possible that some retirement locations are not connected to metropolitan proximity and that certain trans-continental ‘commutes’ can originate anywhere, it is clear that long-distance commutes by professionals, retirement locations and cottage country can all be focused on amenity-rich and relatively accessible zones around Canada’s major cities.