Design and Synthesis of Organic Chromophores for
Imaging, Lithography and Organic Electronics
by
Trisha Lionel Andrew
B.Sc. (With Honors) Chemistry
University of Washington, 2005
MASSACHiff TS INSTTUTE
FELB1
LIBRARIES
ARCHNES
SUBMITTED TO THE DEPARTMENT OF CHEMISTRY IN
PARTIAL FULFILLMENT OF THE REQUIREMENTS FOR THE DEGREE OF
DOCTOR OF PHILOSOPHY IN CHEMISTRY
AT
THE MASSACHUSETTS INSTITUTE OF TECHNOLOGY
FEBRUARY 2011
0 Massachusetts Institute of Technology, 2011. All Rights Reserved.
Signature of Author: Department of Chemistry December 2, 2010 1/1,1/ Certified by:_ _ _ _ _ Accepted by: Timothy M. Swager Professor of Chemistry Thesis Supervisor Robert W. Field Professor of Chemistry Chairman, Departmental Committee on Graduate Studies
This doctoral thesis has been examined by a Committee of the Department of Chemistry as follows:
Professor Stephen L. Buchwal_ Thesis Committee Chair
Professor Timothy M. Swager
Thesis Supervisor
, 7,
)
Professor Mohammad Movassaghi Department of Chemistry
For my Lion and Lioness
-Design and Synthesis of Organic Chromophores for
Imaging, Lithography and Organic Electronics
by
Trisha Lionel Andrew
SUBMITTED TO THE DEPARTMENT OF CHEMISTRY ON DECEMBER 2, 2010 IN PARTIAL FULFILLMENT
OF THE REQUIREMENTS FOR THE DEGREE OF DOCTOR OF PHILOSOPHY IN CHEMISTRY.
ABSTRACT
The absorption and emission maxima, photostabilities and photoreactivities of small-molecule organic chromophores can be tailored by (a) the choice of an appropriate parent structure and (b) the deliberate introduction of substituents that predictably alter the optical properties and photochemistry of this parent structure. Suitably-designed chromophores can be used in a variety of applications, such as imaging (for example, as fluorescent labeling agents or as indicators for specific analytes), optical lithography and as active components in organic electronic devices.
In Chapter 1, a fluorogenic chemosensor to detect saturated nitramine and nitrate ester explosives was devised based on a photochemical reduction reaction. 10-Methyl-9,10-dihydroacridine (AcrH2) was found to transfer a hydride ion equivalent to the high explosives
RDX and PETN upon irradiation at 313 nm in degassed acetonitrile solutions. Mechanistic photophysical studies indicated that the photoreduction of RDX proceeded via a two-step electron-hydrogen atom transfer reaction, whereas PETN photoreduction proceeded via a three-step electron-proton-electron transfer sequence. A zinc analog was synthesized and found to display an 80- or 25-fold increase in 480 nm emission intensity upon reaction with RDX or
PETN, respectively; moreover, the Zn analog was found to be unresponsive to TNT and other
common contaminants, in addition to being photostable under ambient conditions.
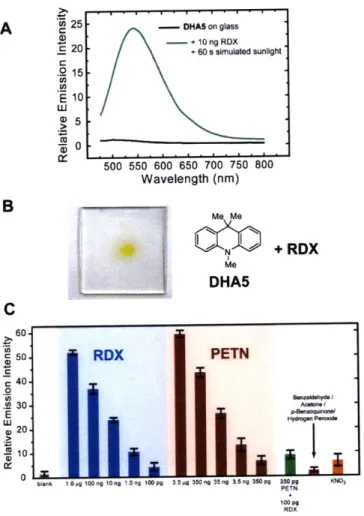
In Chapter 2, the nitramine-containing explosive RDX and the nitroester-containing explosive PETN were shown to be susceptible to photodegradation upon exposure to sunlight. The products of this photodegradation were identified as reactive, electrophilic NOx species, such as nitrous and nitric acid, nitric oxide, and nitrogen dioxide. NN-Dimethylaniline was capable of being nitrated by the reactive, electrophilic NOx photodegradation products of RDX and PETN. A series of 9,9-disubstituted 9,10-dihydroacridines (DHAs) were synthesized from either N-phenylanthranilic acid methyl ester or a diphenylamine derivative and were similarly shown to be rapidly nitrated by the photodegradation products of RDX and PETN. An increase in the emission signal at 550 nm was observed upon nitration of DHAs due to the generation of fluorescent donor-acceptor chromophores. Using fluorescence spectroscopy, the presence of ca. 1.2 ng of RDX and 320 pg of PETN could be detected by DHA indicators in the solid state upon exposure to sunlight.
In Chapter 3, optical lithography with organic photochromes is demonstrated. In the past, the formation of microscale patterns in the far field by light has been diffractively limited in resolution to roughly half the wavelength of the radiation used. We demonstrated lines with an
average width of 36 nm, about one-tenth the illuminating wavelength (11 = 325 nm), made by applying a film of thermally-stable photochromic molecules above the photoresist. Simultaneous irradiation of a second wavelength (k= 633 nm) rendered the film opaque to the writing beam except at nodal sites, which let through a spatially constrained segment of incident 1 light, allowing subdiffractional patterning.
In Chapter 4, rylene dyes functionalized with varying numbers of phenyl trifluorovinylether (TFVE) moieties were subjected to a thermal emulsion polymerization to yield shape-persistent, water-soluble chromophore nanoparticles. Perylene and terrylene diimide derivatives containing either two or four phenyl TFVE functional groups were synthesized and subjected to thermal emulsion polymerization in tetraglyme. Dynamic light scattering measurements indicated that particles with sizes ranging from 70 - 100 nm were obtained in
tetraglyme, depending on monomer concentration. The photophysical properties of individual monomers were preserved in the nanoemulsions and emission colors could be tuned between yellow, orange, red, and deep red. The nanoparticles retained their shape upon dissolution into water and the resulting water suspensions displayed moderate to high fluorescence quantum yield, thus making them attractive candidates for bioimaging applications.
In Chapter 5, a series of substituted 6,6-dicyanofulvenes (DCFs) were synthesized starting from masked, dimeric or monomeric cyclopentadienones. DCFs lacking sufficient steric bulk around the fulvene core tended to reversibly undergo a [4+2] dimerization. In addition to being highly crystalline, DCFs were darkly-colored compounds due to the presence of weak electronic transitions in the visible region of the electromagnetic spectrum. DCFs displayed two distinct, reversible one-electron reductions by cyclic voltammetry. Based on their high crystallinity and suitable electron affinities, and buoyed by their relatively cheap and straight-forward synthesis, DCFs are interesting candidates for organic electron-transport materials.
Thesis Supervisor: Timothy M. Swager
Title: John D. MacArthur Professor of Chemistry
-CONTENTS
Title Page 1
Signature Page 2
Dedication 3
Abstract 4
CHAPTER 1 - DETECTING HIGH EXPLOSIVES WITH ORGANIC HYDRIDE DONORS 9
1.1 Introduction 10
1.2 N-Methyl-9,10-Dihydroacridine (AcrH2) 11
1.3 Other Hydride Donors 16
1.4 Complexes of AcrH2 17
1.5 Solid State Sensors and Vapor Phase Detection of RDX and PETN 19
1.6 Conclusions 20
1.7 Experimental Section 20
1.8 References and Notes 25
1.9 Additional Figures 29
CHAPTER 2 - SELECTIVE DETECTION OF EXPLOSIVES VIA PHOTOLYTIC CLEAVAGE OF
NITROESTERS AND NITRAMINES 34
2.1 Introduction 35
2.2 Indicator Design 39
2.3 Synthesis 41
2.4 Photophysics 45
2.5 Electrochemistry 47
2.6 Reaction with RDX/PETN Photodegradation Products 50
2.7 Other Nitroesters and Nitramines 53
2.8 Differences in DHA Reaction Mechanisms 53
2.9 Light Sources 54
2.10 Other NOx Sources 54
2.11 Optical Properties of Nitrated DHAs 55
2.12 Optical Characterization of Indicator Response 56
2.13 Reaction Kinetics 63
2.14 Solid State RDX/PETN Detection 67
2.15 Conclusions 70
2.16 Experimental Section 71
2.17 References and Notes 93
CHAPTER 3 - USING ORGANIC PHOTOCHROMES TO ENABLE OPTICAL NANOPATTERNING 98
3.1 Introduction 99
3.2 Results and Discussion 103
3.3 Conclusions 109
3.4 Experimental Section 109
CHAPTER 4 - THERMALLY-POLYMERIZED RYLENE NANOPARTICLES 121 4.1 Introduction 122 4.2 Monomer Synthesis 124 4.3 Monomer Photophysics 126 4.4 Nanoparticle Synthesis 128 4.5 Nanoparticle Photophysics 133 4.6 Conclusions 135 4.7 Experimental Section 135
4.8 References and Notes 139
CHAPTER 5 - 6,6-DICYANOFULVENES 144 5.1 Introduction 145 5.2 Synthesis of 6,6-Dicyanofulvenes 146 5.3 Electrochemistry 153 5.4 Conclusions 156 5.5 Experimental Section 157
5.6 References and Notes 165
5.7 Additional Figures 169
CURRICULUM VITAE 172
ACKNOWLEDGEMENTS 175
APPENDIX 1: NMR SPECTRA FOR CHAPTER 1 177
APPENDIX 2: NMR SPECTRA FOR CHAPTER 2 180
APPENDIX 3: NMR SPECTRA FOR CHAPTER 3 214
APPENDIX 4: NMR SPECTRA FOR CHAPTER 4 218
APPENDIX 5: NMR SPECTRA FOR CHAPTER 5 225
-7-CHAPTER 1
Detecting High Explosives
with Organic Hydride Donors
Adapted and reprinted in part with permission from: Andrew, T. L.; Swager, T. M. "A Fluorescence Turn-On Mechanism to Detect the High Explosives RDX and PETN" J Am. Chem. Soc. 2007, 129, 7254-725 5.
-9-1.1 Introduction
Developing practical sensors for detecting hidden explosive devices in war zones and transportation hubs is a pressing scientific and social concern. Current efforts have focused on sensing three commonly-used powerful explosives: 2,4,6-trinitrotoluene (TNT), 1,3,5-trinitro-1,3,5-triazinane (RDX) and pentaerythritol tetranitrate (PETN) (Figure 1.1). The need for ultra-trace detection of these low-volatility compounds has resulted in an intense interest in fluorescence methods, and the direct detection of TNT vapor by amplifying fluorescent polymers (AFPs) is now an established technology.' However analogous examples of direct RDX or PETN detection are sparse and current methods rely heavily on ion mobility spectrometry,2a mass spectrometry,2b and, to a lesser extent, detecting either chemically-modified RDX3
a or its
degradation products.3"
O2N Me NO2 02N N N' NO2 02NOs
N 02NO ON02
NO2 NO2 ON0 2
TNT RDX PETN
Figure 1.1. Structures of common high explosives.
In the AFP-based detection scheme (developed previously in the Swager lab), the presence of TNT vapor quenches the fluorescence of a conjugated polymer thin film (for example, a thin film of P1) due to an energetically-favorable photoinduced electron transfer (PET) pathway made available by the LUMO of TNT (Figure 1.2). In contrast, the analogous PET reaction between P1 and either RDX or PETN lacks a significant driving force,4 thus precluding the observation of significant fluorescence quenching. Another hindrance is the fact
that the vapor pressures of RDX and PETN are three orders of magnitude lower than that of
TNT. These challenges to detecting RDX and PETN stimulated our group to explore alternative
fluorescence-based detection mechanisms. In particular, we pursued "turn-on" schemes wherein a strong fluorescence signal is generated from a dark background in response to an analyte, as, theoretically, this mechanism has inherently higher sensitivity than a "turn-off' mechanism.
A B Conduction B Band N OCHs hv hvFTNn LUMO) CH330 + Valence Band P1
Figure 1.2. (A) Conjugated polymer-based TNT detection scheme. (B) Structure of P1, which is
able to detect picogram quantities of TNT via amplified fluorescence quenching.lb
1.2 N-Methyl-9,10-Dihydroacridine (AcrH2)
Inspired by enzymatic, NADH-mediated reduction of RDX in contaminated wastewater,5 we sought to mimic this biological process in a fluorescence-based sensor. Initial studies targeted the NADH analogue N-methyl-9,1 0-dihydroacridine (AcrH2, Figure 1.3) because of its ability to form the N-methylacridinium fluorophore (AcrH*) upon "H" abstraction. As seen in Figure 1.4B, both RDX and PETN generated the green-emitting AcrH* from the blue-emitting AcrH2 upon photolysis at 313 nm in deoxygenated acetonitrile solutions, whereas TNT was ineffective.6 Moreover, RDX and PETN were also photoreduced by AcrH2 upon exposure of a deoxygenated acetonitrile solution to sunlight (5 minutes in Cambridge winter conditions or 45 seconds in
spring weather) (Figure 1.5).
11
H H H
Me Me
AcrH2 AcrH*
Figure 1.3. Structures of AcrH2and its oxidation product AcrH*.
3.2 8 2.8
AB
-AcrH 2 7 V 2.4+-
+RDX 6 2.I
- +PETN 2.0. 55 16 -+TNT a 1.6. 4 PS 1.2. 3 <0.8 2 0.4 1 0.0 250 300 350 400 450 400 450 500 550 600 650 Wavelength (nm)Figure 1.4. (A) Absorbance profile of the photoreaction of AcrH2 with RDX. (B) Emission profiles
of: AcrH2 in deoxygenated acetonitrile and its mixtures with RDX, PETN or TNT in degassed
acetonitrile after a 60.0 second irradiation with 313 nm light. [AcrH2]= 2.4x10⁻³M, [Explosive]= 0.012M, Xex = 356 nm.
,50 - -+RX 1.0 +P TN0.8'-4--- -- +TN 0.6, .00.2 0 0.0 S 10-0 350 45,0 4050 eo 650so Wavelength (nm)
Figure 1.5. Emission profiles of AcrH2 in deoxygenated acetonitrile and its mixtures with RDX,
PETN or TNT after a 45.0 s exposure to sunlight. [AcrH2]= 4x10 4 M, [Explosive] = 0.012 M.
Whereas the fate of AcrH2 could be followed during the course of photoreaction, the structures of reduced RDX or PETN, however, could not be easily discerned. The relatively reactive N-nitroso reaction product suggested in Scheme 1.1 stems from a proposed intermediate in enzymatic RDX reduction.7 However, we have not been able to unambiguously prove its
formation as this compound easily fragments under most ionization conditions, thus rendering mass spectrometric analyses inconclusive.8
ye ~Me eN 2 hv M -OH(D) N0 + (k=313nm) + N .NN. MeCN'0 N , (D)H H(D) 02N NO2 H(D) 02N NO2 Of = 0.18 Of = 0.54 Proposed k=285nm X=358nm (Not Isolable)
I
-
I
RDX + N (D)H H(D) _ _ (D)H H(D) 02NNyN'NO2J
Scheme 1.1. Proposed photoreaction of AcrH2 (AcrD2) with RDX.In order to better understand the mechanism(s) involved, we measured the quantum yields of RDX, PETN and TNT photoreduction and performed kinetic isotope effect studies. As is common with NADH analogues, we anticipated either of three operative photoreduction mechanisms: a one-step hydride transfer, a two-step electron-hydrogen atom transfer or an electron-proton-electron transfer sequence.9 Photoreaction quantum yields (<Dx), defined as the ratio of moles AcrH* produced to moles photons absorbed,10 were obtained from a series of absorbance profiles for the reactions of RDX, PETN and TNT with AcrH2 and its dideuterated analogue, AcrD2. Figure 1.4A shows a typical absorbance profile for the photoreduction reaction
-wherein the absorption band corresponding to AcrH2 at 285 nm decreased with photolysis, concomitant with an increase in AcrH* absorbance at 358 nm.
0 1 2 3 0 1 2 3 0 1 2 3
[AcrH2, AcrDl X 1W3
Figure 1.6. Dependence of (m on [AcrH2, AcrD2] for the photoreduction of RDX, PETN and TNT. [Explosive] = 6.9x10⁴ M.
Im values as a function of AcrH(D)2 concentration are shown in Figure 1.6. The low Im values (<0.1%) obtained for our system reflect the inherent inefficiency of a bimolecular photoreaction in dilute solutions and exclude any chain pathways in the photoreduction of either RDX or PETN. At constant [RDX] and [PETN], oDm increased linearly with [AcrH2] to a maximum value of 8.5x 10⁴ and 6.1x10', respectively, after which it gradually decreased.
A linear increase in quantum yield with increasing reactant concentration is often
observed." We hypothesize that the singlet excited state of AcrH2 reduces RDX or PETN (Scheme 1.1) and can explain, within this context, a linear increase in Pm with [AcrH2] based
on the fact that a higher AcrH2 concentration increases [AcrH2*], the concentration of excited chromophores, which in turn leads to a greater chance of a bimolecular collision with RDX or
PETN within the excited-state lifetime of AcrH2. The concentration of AcrH2* should also be affected by the intensity of incident light and, accordingly, we observe that Dm is linearly dependent on light intensity.
We are not, however, aware of other systems that show quantum yield saturation and subsequent decrease. We found that at sufficiently high concentrations the rate of self-quenching (the collisional deactivation of AcrH2* with AcrH2 (GS)) competed with analyte reduction, which lowered the overall efficiency of the photoreaction and lead to the observed decrease in
In the case of TNT photoreduction,
om
values followed a similar pattern to those of RDX and PETN photoreduction but were significantly lower. This observation is consistent with the emission profiles provided earlier wherein notable AcrH* formation was not observed in mixtures of AcrH2 and TNT. Since TNT functions as an exceptional fluorescence quencher, the initial electron transfer between AcrH2* and TNT is most probably followed by back-electron transfer and regeneration of AcrH2 (GS), thus hindering photooxidation of AcrH2.To distinguish between the three possible mechanisms of RDX photoreduction, we obtained a (tH/D value of approximately 1.3 at low [AcrH2], which is consistent with a two-step electron-hydrogen atom transfer oxidation of AcrH2. a,12 The inverse primary kinetic
isotope effect (KIE) (QH/ ID=0.7 7) observed at high [AcrH2] does not have literature parallels but can be explained, once again, by the self-quenching of AcrH2 chromophores, in light of reports of an inverse KIE in select quenching processes.13 An inverse KIE was also observed at high [AcrH2] for the reduction of PETN; however, a significant KIE is not observed at low
[AcrH2], thus implicating an electron-proton-electron transfer sequence as the mechanism of
PETN photoreduction.14
-1.3 Other Hydride Donors
The scope of the photochemical hydride transfer reaction was briefly explored by investigating the photoreactions between dihydroanthracenes, xanthene and fluorenol with RDX,
PETN and TNT. As seen in Figure 1.7, 9,1 0-dihydroanthracene and xanthene behaved similar to AcrH2, although longer irradiation times (approximately 5 times greater) were required to obtain emission intensity changes comparable to that of AcrH2. 2,3,6,7-Tetramethoxy-9,10-dihydroanthracene is interesting for its relative photostability; however, this desirable characteristic came at the loss of reactivity, thus demanding irradiation times greater than 30 minutes to observe an eight-fold increase in 427 nm emission intensity. Trimethylsilane-protected 9-fluorenol was unstable toward irradiation even in deoxygenated acetonitrile solutions; moreover, surprisingly, we observed efficient hydride transfers to RDX and TNT while PETN did not generate any observable trace of 9-fluorenone, the product of 9-fluorenol oxidation. C 10 9 8 7 6 5 4 3 140 1, 12 10 C 6 4 2 0 50 400 450 500 550 600 650 400 450 500 560 600 650 Wavelength (nm)
Figure 1.7. Emission profiles of various hydride donors and their mixtures with RDX, PETN and TNT in deoxygenated acetonitrile after irradiation with 313 nm light.
[Hydride Donor]~ 4x 10⁴ M, [Explosive] = 0.012 M.
20 " =" -?-- +RDX 15 +--- +-NT- - +PETN +TNT 10 5 0 lbI I I I I I I 14 ---12 - - +RDX 10 - +PEN -Irra - +TNT (Argon) 8 - +RDX 6 - +PErN - +TNT 4 2 0 ... . .. . .... --
---1.4 Complexes of AcrH2
Although most of the hydride donors mentioned thus far were not oxidized in the absence of RDX or PETN in deoxygenated solutions, all compounds were nonetheless oxidized upon irradiation in air. Such oxygen sensitivity limits the utility of a practical chemosensor; therefore, in an effort to fabricate a photostable chemosensor, a zinc analogue of AcrH2, 1, was synthesized
(Figure 1.8). From an initially weakly emissive, aerated solution of 1, irradiation at 313 nm in the presence of either RDX or PETN produced an intense peak at 480 nm (Figure 1.9A) due to the formation of an acridine-zinc complex, 2 (Scheme 1.2); this assignment was corroborated by comparing the resulting emission spectrum with that of an independently synthesized zinc-acridine complex. Me2N "Me2 ' ZnN H Z H H H 1
Figure 1.8. Structure of zinc complex 1.
Irradiating 1 in the absence of an explosive analyte produced an emission band at 400 nm; however, the former 480 nm peak was not formed, even after prolonged (>2 hours) irradiation in air (Figure 1.9A). We believe that 1 slowly photooxidizes to the corresponding ketone, forming an N-substituted acridone derivative, 3, in aerated solutions. Nevertheless, a statistically significant 480 nm emission signal was observed with RDX and PETN concentrations as low as 7x 10⁻⁵ and 1.3x 10⁻⁴ M, respectively.
17-n70 60 50 40 .30 -+Air -- +RDX
- +PETN
z z z
20
-+TNT 4 10 I'.0 350 400 450 500 550 600 650 Wavelength (nm)Figure 1.9. (A) Emission profiles of 1 in acetonitrile; 1 after a 120 second irradiation (313 nm) in acetonitrile; and mixtures of 1 and either RDX, PETN or TNT in acetonitrile after a 30.0 second irradiation with 313 nm light. The inset shows growth of the 480 nm peak with increasing irradiation time (10 s intervals). (B) Emission intensity at 480nm resulting from photoreaction of 1 (30.0 second irradiation times) with various explosive analytes, analyte mixtures or select contaminants in aerated
acetonitrile. [1]= 3.1x10~4 M, [Explosive/Analyte] = 0.012M, kex = 356 nm.
Me2N NMe2 NZn> N N $\ lN Explosive, i hv hv Me2N NMe2 Me2N NMe2 Zn Zn NN 'N N N 00 0 2 3
Scheme 1.2. Reaction of complex 1 with explosive analytes and oxygen.
The selectivity of 1 was examined by monitoring its response to known hydride acceptors, such as p-benzoquinone, and mixtures of TNT and RDX. Complex 1 was relatively unresponsive to TNT and, with TNT/RDX mixtures, the emission intensity at 480nm increased approximately proportional to the ratio of RDX (see Figure 1.9B). Most strikingly, unlike the parent AcrH2, 1 did not thermally reduce p-benzoquinone and photochemical hydride transfer was found to proceed slowly. Other aliphatic and aromatic ketones and aldehydes (which are common contaminants contained within or found in the proximity of an explosive device) were also comparatively unreactive.
1.5 Solid State Sensors and Vapor Phase Detection of RDX and PETN
In order to obtain a practical, utilizable chemosensor for RDX and PETN, we wished to translate the promising solution state results procured above into a solid state sensor that can be implemented in existing fluorescence-based explosives detection technology.' 6 More specifically, our ultimate goal is to fabricate a sensor that possesses sufficient sensitivity to display a direct fluorescence response to equilibrium vapor pressures of RDX and PETN.17 To realize this goal, we pursued the use of micro- and mesoporous materials with the anticipation that high porosity will enhance analyte diffusion into the sensor and therefore increase the
sensitivity of the system.18
Initial attempts involved the use of zeolites to organize complex 1 in the solid state.19 A
zeolite-included sample of 1 (included in zeolite sodium Y) was coated on a glass slide and a small sample (ca. 0.05 mg) of RDX was allowed to adsorb onto the surface of the slide. As seen in Figure 1.10, a ca. 8-fold increase in emission intensity at 480 nm was observed after a 50.0 second irradiation in the presence of RDX whereas no such change was observed in its absence.
19-However, a small background emission signal at 480 nm was nonetheless observed, even in the absence of an explosive analyte, because acidic sites within the zeolite cavity oxidized minor quantities of 1 to 2. 8 - 1@Zeolite NaY --- +50 s Irradiation 6 --- +RDX + 50 s Irradiation 5 4 . 3 X2 0 400 450 50 50 60 650 Wavelength (nm)
Figure 1.10. Response of zeolite-included 1 coated on a glass slide to RDX.
1.6 Conclusions
We found that N-methyl-9,10-dihydroacridine, AcrH2, is capable of selectively transferring a hydride ion equivalent to saturated nitramine and nitroester explosives as part of a photochemical reaction. Its photostable zinc analog, 1, displayed an 80- and 25-fold increase in 480 nm emission intensity upon reaction with RDX and PETN, respectively. This example of a direct fluorescence response to RDX or PETN is orthogonal to existing conjugated polymer-based detection technology and will enable existing fluorescence methods to detect non-aromatic high explosives.
1.7 Experimental Section
Materials: All solvents used for photophysical experiments were of spectral grade. All reagent
grade materials were purchased from Aldrich or Alfa Aesar, and used without further
purification. THF was obtained from J. T. Baker and purified by passing through a Glasscontour dry solvent system. N-Methyl-9,10-dihydroacridine (AcrH2) was prepared by sodium borohydride reduction of N-methylacridinium iodide according to a literature procedure and recrystallized from ethanol.20 ,9_2 H2]-N-methyl-9,10-dihydroacridine (AcrD2) was prepared by LiAlD4 reduction of N-methylacridone according to a literature procedure and recrystallized
from ethanol.
NMR Spectroscopy: IH and 13C NMR spectra for all compounds were acquired in CD
3CN on a Bruker Avance Spectrometer operating at 400 and 100 MHz, respectively. The chemical shift data are reported in units of 6 (ppm) relative to tetramethylsilane (TMS) and referenced with residual CD3CN.
Mass Spectrometry: High-resolution mass spectra (HRMS) were obtained at the MIT Department of Chemistry Instrumentation Facility using a peak-matching protocol to determine the mass and error range of the molecular ion, employing either electron impact or electrospray as the ionization technique.
Elemental Analyses: Elemental analyses were performed by Desert Analytics Laboratory,
Tucson, Az.
Infrared (IR) spectroscopy: IR spectra were recorded on a Perkin-Elmer Model 2000 FT-IR
spectrophotometer at the MIT Department of Chemistry Instrumentation Facility and are
reported as strong (s), medium (m) or weak (w).
Absorption and Emission Spectroscopy: Fluorescence spectra were measured on a SPEX
Fluorolog-t3 fluorimeter (model FL-321, 450 W Xenon lamp) using right-angle detection. Ultraviolet-visible absorption spectra were measured with an Agilent 8453 diode array spectrophotometer and corrected for background signal with a solvent-filled cuvette.
-Fluorescence quantum yields were determined by the optically dilute method using quinine sulfate in 0.1M H2SO4 as a standard (<D=0.54) and were corrected for solvent refractive index
and absorption differences at the excitation wavelength.
Photoreaction Quantum Yield Experiments:23 Stock solutions of AcrH2, AcrD2, RDX, and
PETN were freshly prepared in degassed, spectral grade acetonitrile prior to use. For each
measurement, aliquots of each stock solution and degassed acetonitrile were combined in a quartz cuvette such that the final volume equaled 3.0 mL and sparged with argon for 1.0 minute in the dark. Solutions were irradiated at 313 nm using either our SPEX Fluorolog-3 fluorimeter (model FL-321, 450 W Xenon lamp) with a 29.4 nm excitation slit width or a 500 W Mercury Arc Lamp fitted with a 313nm interference filter and varying neutral density filters (0.5, 1.0 or 2.0 OD); both light sources were calibrated with a potassium ferric oxalate actinometer.24 For each measurement, the absorbance at 358 nm was recorded versus irradiation time; both the concentration of AcrH* formed and the light absorbed by AcrH2 were then calculated and the slope of a graph of moles of AcrH* formed vs. einsteins of light absorbed gave the quantum yield. For each measurement, reaction progress was also monitored in the dark to ensure that there was no thermal contribution to the reduction of RDX or PETN. Each measurement was performed in triplicate.
Complex 2. A flame-dried, two-neck 50 mL round bottom flask equipped with a condenser was
charged with 0.289g zinc nitrate hydrate (ca. 1.53 mmol), 0.835g acridine (4.6 mmol, ca. 3eq) and 20mL ethanol under a positive pressure of argon. The resulting solution was refluxed for ten minutes then cooled to room temperature. 0.189g TMEDA (1.62 mmol, ca. 1.05eq) was then added in one portion, the resulting solution refluxed for 12 hours under argon and then cooled to room temperature. A solution of 1.044g sodium tetraphenylborate (3.05 mmol, 2.Oeq) in 6 mL
DI water was added dropwise with vigorous stirring and the reaction mixture stirred for 15
minutes under argon before filtering the resulting orange, crystalline solid and washing with cold ethanol, water and ether. The sample was further purified by Soxhlet extraction (diethyl ether) overnight, reprecipitated twice by slow addition of water to an acetonitrile solution and dried in vacuo to yield 1.55g of 2 as an orange solid (86% yield). 1H NMR (400 MHz, CD
3CN) 6 9.27 (s, 2H), 8.24 (dd, J= 8.8 Hz, 1.6 Hz, 2H), 8.19 (dd, J= 8.8 Hz, 0.8 Hz, 2H), 8.01 (ddd, J= 7.6 Hz, 7.2 Hz, 1.6 Hz, 2H), 7.23 (ddd, J= 7.6 Hz, 7.2 Hz, 0.8 Hz, 2H), 7.28 (m, 16H), 7.00 (m, 16H), 6.84 (m, 8H), 2.87 (s, 4H), 2.54 (s, 12H). 13C NMR (100 MHz, CD 3CN) 6 43.7, 53.6, 122.0, 125.7, 125.9, 126.7, 128.6, 129.3, 130.5, 135.9, 136.3, 149.1, 163.2, 164.2, 164.7. UV-vis
(CH3CN): Xma (log F) = 356 nm (4.1). Emission (CH3CN): Xmax 478 nm, <DF = 0.24. IR (KBr Pellet) 3055 (m), 1640 (m), 1479 (m), 1468 (m), 1427 (m), 1265 (w), 1152 (w), 1032 (w), 782
(s), 741 (s), 707 (s), 604 (m) cm~1. Anal. calcd. for C32H34N4Zn: %C 81.53, %H 6.33, %N 4.75;
found %C 81.61, %H 6.61, %N 4.79.
Complex 1. The 1,4-dihydropyridyl analog of 1 has been synthesized starting from zinc
hydride;2 5 however, the following procedure (adapted from the procedure used to reduce quaternary acridinium compounds20) was followed due to the relative stability of the
reactants/reagents involved and the fact that it does not demand manipulations under inert atmosphere. A 50mL two-neck round bottom flask was charged with 0.1 g 2 (.085mmol), 15 mL THF and 15 mL DI water under a positive pressure of argon and the resulting solution cooled in an ice bath. 0.185 g sodium borohydride (4.89 mmol) was added to the solution in small portions over half an hour after which the reaction was stirred for one hour at room temperature. The resulting white solid was filtered, washed with copious amounts of cold water and dried in vacuo to yield 0.04g 1 as an amorphous white powder (87% yield). Compound 1 has limited solubility
-in acetonitrile, pyrid-ine, DMF and DMSO; therefore, satisfactory 'H-NMR and (especially) "C-NMR spectra were difficult to obtain, despite several attempts. Absorption/emission spectroscopy and explosive detection experiments were performed in slightly turbid, optically dilute (OD<0.1) acetonitrile solutions. UV-vis (CH3CN): kma (log s) = 316 nm (4.0). Emission
(CH3CN): kma 364 nm (Xex = 316 nm), DF 0.24. IR (KBr Pellet) 3043 (w), 1609 (m), 1582 (m), 1478 (s), 1455 (m), 1419 (w), 1298 (s), 1258 (w), 1164 (w), 1036 (w), 759 (s), 745 (m) cm~
Anal. calcd. for C3 2H36N4Zn: %C 70.90, %H 6.69, %N 10.34; found %C 70.94, %H 6.65, %N
10.56
Complex 3. Attempts at synthesizing complex 3 proved unsuccessful despite the use of various
reaction conditions and/or reactant ratios. We were only able to isolate a zinc (II) bis(acridone) complex (3')-i.e., we were only able to synthesize an analog of complex 3 that lacks the N,N,N',N'-tetramethylethylenediamine ligand. A possible explanation for this observation is that, once formed, the insolubility of complex 3' prevents further reaction.
Complex 3'. 0.194g acridone (0.99 mmol) was added to a solution of 0.093g KOH (1.7 mmol)
dissolved in 20 mL ethanol and the mixture refluxed until all the acridone had dissolved (approximately 5 minutes) and a yellow solution (that fluoresces green) was formed. Upon cooling to room temperature a solution of 0.089g zinc nitrate (.47 mmol) dissolved in 5 mL ethanol was added in one portion and the reaction refluxed under argon for 12 hours. The resulting solids were filtered, washed with cold ethanol and water and dried in vacuo to afford
0.095g of 3 as a pale yellow-colored powder (45% yield). Compound 3' was found to be
insoluble in ethanol and to have limited solubility in DMF, DMSO and acetonitrile. Attempts at dissolving 3' in either acetonitrile or DMF at elevated temperatures only resulted in the partial decomposition of the complex into its individual constituents. This observation is not unfounded
as acridone is also relatively insoluble in most organic solvents.2 6 The limited solubility of 3'
also prevented the procurement of satisfactory 'H and 13C NMR spectra. The limited solubility of
3' in acetonitrile was, however, sufficient for optical spectroscopy. UV-vis (CH3CN): kAmax (log
F)= 391 nm (4.2). Emission (CH3CN) kmax 400 nm, CF = 0.43. IR (KBr Pellet)2 6a 3100 (w), 2994
(w), 2950 (w), 1634 (s), 1599 (s), 1558 (s), 1531 (s), 1472 (s), 1346 (in), 1264 (w), 1159 (w),
937 (w), 752 (in), 673 (in) cm-1. HRMS (ESI): Caled. for C26HI6N202Zn, [M+H]* 453.0576;
found, 453.0578.
1.8 References and Notes
(1) (a) Toal, S.J.; Trogler, W. C. J Mater. Chem. 2006, 16, 2871-2883. (b) Yang, J-S.; Swager, T. M. J Am. Chem. Soc. 1998, 120, 5321-5322.
(2) (a) For a summary of most commercial explosive detection systems see: Bruschini, C. Subsurface Sensing Tech. and Appl. 2001, 2, 299-336. (b) For a representative example
see: Cotte-Rodriguez, I.; Cooks, R. G. Chem. Commun. 2006, 28, 2968-2970.
(3) (a) For a representative example see: McHugh, C. J.; Smith, W. E.; Lacey, R.; Graham,
D. Chem. Commun. 2002, 21, 2514-2515. (b) Jungreis, E. Spot Test Analysis: Clinical,
Environmental, Forensic, and Geochemical Applications, 2nd ed.; J. Wiley: New York,
1997.
(4) This is because RDX and PETN have reduction potentials that are approximately one volt greater than that of TNT.
(5) (a) McCormick, N. G.; Cornell, J. H.; Kaplan, A. M. Appl. Environ. Microbiol. 1981, 42,
817-823. (b) Bhushan, B.; Halasz, A.; Spain, J.; Thiboutot, S.; Ampleman, G.; Hawari, J.
Environ. Sci. Technol. 2002, 36, 3104-3108.
-25-(6) Formation of AcrH* was confirmed by comparing the UV-vis, emission and 'H NMR spectra of the reaction mixture with those of an independently synthesized sample of N-methylacridinium iodide.
(7) (a) Sheremata, T. W.; Halasz, A.; Paquet, L.; Thiboutot, S.; Ampleman, G.; Hawari, J. Environ. Sci. Technol. 2001, 35, 1037-1040. (b) Beller, H. R.; Tiemeier, K. Environ. Sci.
Technol. 2002, 36, 2060-2066.
(8) Additionally, the 'H and 13C NMR spectra of the proposed N-nitroso reduction product do not differ significantly from those of RDX, thus excluding NMR spectroscopy as a meaningful characterization tool. Also, although we observed a few changes in the IR spectrum of the reaction mixture between 1500 and 1750 cm-1 during the course of the reaction, we could not satisfactorily deconvolute these changes from the strong IR stretches of the nitro groups of RDX.
(9) Cheng, J-P. ; Lu, Y. ; Zhu, X.; Mu, L. J. Org. Chem. 1998, 63, 6108-6114 and references therein.
(10) The light sources used in all mechanistic photophysical experiments were calibrated using a potassium ferrioxalate actinometer: Hatchard, C. G.; Parker, C. A. Proc. Royal Soc. London A, 1956, 235, 518-536.
(11) (a) Fukuzumi, S.; Fijuta, S.; Suenobu, T.; Imahori, H.; Araki, Y.; Ito, 0. J Phys. Chem. A 2002, 106, 1465-1472. (b) Fukuzumi, S.; Suenobu, T.; Patz, M.; Hirasaka, T.; Itoh, S.; Fujitsuka, M.; Ito, 0. J. Am. Chem. Soc. 1998, 120, 8060-8068. (c) Fukuzumi, S.; Imahori, H.; Okamoto, K.; Yamada, H.; Fujitsuka, M.; Ito, 0.; Guldi, D. J. Phys. Chem.
A 2002, 106, 1903-1908.
(13) We propose that the rate of vibrational self-deactivation of AcrD2* by AcrD2 (GS) is slower than that of AcrH2, thus reducing the detrimental effect of this process on <DD and resulting in an inverse KIE. Similarly, the vibrational deactivation of lanthanide luminescence by D20 is much less efficient than H20: (i) Kropp, J. L.; Windsor, M. W.
J Chem. Phys. 1965, 42, 1599-1608, and references within; (ii) Haas, Y.; Stein, G. J
Phys. Chem. 1971, 75, 3668-3677.
(14) Since RDX and PETN have different one-electron reduction potentials, it is plausible that their photoreduction mechanisms differ; see ref 9.
(15) The formation of complex 3 from 1 upon irradiation in air was confirmed by synthesizing a zinc (1I) bis(acridone) complex (3') and characterizing it by ESI MS, IR, UV-vis, and emission spectroscopy.
(16) For example, we often employ the FIDO sensing platform created by ICx Technologies.
(17) The equilibrium vapor pressure of RDX is 6x10⁻² atm (ca. 5-7 ppt) at 25 0C and that of
PETN is 2x10~1 atm (ca. 30 ppt).
(18) Tao, S.; Li, G.; Zhu, H. J. Mater. Chem. 2006, 16, 4521-4528.
(19) For select examples of using zeolites to organize chromophores and/or as hosts for photoreactions see: (a) McGilvray, K. L.; Chretien, M. N.; Lukeman, M.; Scaiano, J. C.
Chem. Commun. 2006, 4401-4403 and references therein. (b) Minkowski, C.; Pansu, R.;
Takano, M.; Calzaferri, G. Adv. Funct. Mater. 2006, 16, 273-285. (c) Scaiano, J. C.; Garcia, H. Acc. Chem. Res. 1999, 32, 783-793.
(20) Roberts, R. M. G.; Ostovic, D.; Kreevoy, M. M. Faraday Discuss. Chem. Soc. 1982, 74,
257-265.
-27-(21) Fukuzumi, S.; Tokuda, Y.; Kitano, T.; Okamoto, T.; Otera, J. J. Am. Chem. Soc. 1993,
115, 8960-8968.
(22) Demas, J. N.; Crosby, G. A. J. Phys. Chem. 1971, 75, 991-1024.
(23) For a representative reference on the procedure followed see: Hill, R.D.; Puddephatt, R.
J. J. Am. Chem. Soc. 1985, 107, 1218-1225.
(24) Hatchard, C.G.; Parker, C. A. Proc. R. Soc. London A 1956, 235, 518-536.
(25) de Koning, A. J.; Boersma, J.; van der Kerk, G. J. M. J Organomet. Chem. 1980, 186, 159-172.
(26) (a) Albert, A. The Acridines, 2"d Ed.; Edward Arnold Publishers Ltd.: London; 1966, pp
372. (b) The IR bands in the 1650-1400 cm'1 region match those reported for the acridone
1.9 Additional Figures
Wavelength (nm)
Figure Al. Absorption and emission spectra for complex 2 recorded in acetonitrile. %max = 356 nm; kem = 478 nm; OF = 0.24. 1.0- 0.8- 0.6-
0.4-
0.2- 0.0-1.0 -0.8 g 0.6j0.41
0.2 -0.0 200 250 300 350 400 450 500 550 600 Wavelength (nm)Figure A2. Absorption and emission spectra for complex 1 recorded in acetonitrile.
Xmax = 316 nm; kem = 364 nm (kex = 316 nm); OF = 0.24.
- 29
1.0- 1.0 0.8- 0.8 ~0.6- 0.6 0.4- -0.4 2 0.2- -0.2 0.0- 0.0 3)0 350 460 450 500 55 60 Wavelength (nm)
Figure A3. Absorption and emission spectra for compound 3' recorded in acetonitrile.
kma, = 391 nm; Xem = 400 nm; OF = 0.43.
Mechanistic Photophysical Studies
In addition to [AcrH2, AcrD2] dependence, the effect of [RDX, PETN] on Grxn was also examined: 0.0005-0.0004 0.0003 -e 0.0002- 003 0.0001 - 0.0000--0.0005 0.0000 0.0005 0.0010 0.0015 0.0020 0.0025 0.0030 0.0035 [RDX]
Figure A4. Dependence of Drxn on [RDX] for RDX photoreduction by AcrH2/AcrD2.
0.00055 -[=QY 0.000500.00045 -0.00040 0.00035 e 0.00030-0.00025 -MOM 0.00020 -0.00015 - w 0.00010 0.00005 - i
0.00000 - accoM ao't eiM
0.0000 0.0005 0.0010 0.0015 0.0020 0.0025 [PETN]
Figure A5. Dependence of r. on [PETN] for PETN photoreduction by AcrH2/AcrD2.
[AcrH2, AcrD2] = 7.3x10~5 M.
In addition to concentration dependence, Im was also found to be affected by the intensity of incident light (such behavior has literature precedence; for an example involving AcrH2 see: Fukuzumi, S.; Fujita, S.; Suenobu, T.; Imahori, H.; Araki, Y.; Ito, 0. J Phys. Chem. A 2002, 106, 1465-1472.): 0.12- a QYH e QYD 0.10- 0.08-* 0.060.04 - 0.02-0.00,
1.00Fr008 2.00F-008 3.00E-008 4.00E-008 5.00F-008 6.00E-008 Light Intensity (Einstein sec-1
)
Figure A6. Dependence of Orm on the intensity of incident light for RDX photoreduction by
AcrH2/AcrD2. [AcrH2, AcrD2] = 1.5x10⁻³M, [RDX] = 6.9x 10⁴ M.
- 0.12- 0.10- 0.08- 0.06- 0.04- 0.02-0.00,
1.00008 2.OOE-008 3.00&E008 4.00&008 5.OOE-008 6.OO -008
Light Intensity (Einstein sec~1)
Figure A7. Dependence of CDrxn on the intensity of incident light for PETN photoreduction by AcrH2/AcrD2. [AcrH2, AcrD2] = 1.5x10~3M, [PETN] = 4.3x10~4 M.
2.OOE010 1.50E+010 1.OOE+010 5.OOE+009 0.OOE+000 0.000 0.001 0002 0.003 [AcrH2] 0.004 0.005
Figure A8. Dependence of AcrH2 emission intensity and fluorescence quantum yield on
[AcrH2], in the absence of RDX and PETN, showing self-quenching at high concentrations.
...0 -- QY
. -0- Emission
I
0
-33-CHAPTER 2
Selective Detection of Explosives via
Photolytic Cleavage of Nitroesters and Nitramines
Adapted from: Andrew, T. L.; Swager, T. M. "Selective Detection of Explosives via Photolytic Cleavage of Nitroesters and Nitramines" manuscript submitted to J Am. Chem. Soc.
2.1 Introduction
Detecting hidden explosive devices in war zones and transportation hubs is an important pursuit. The three most commonly used highly energetic compounds in explosive formulations are: 2,4,6-trinitrotoluene (TNT), 1,3,5-trinitrotriazinane (RDX), and pentaerythritol tetranitrate
(PETN) (Figure 2.1). Numerous technologies are currently capable of detecting the energetic
chemical components of explosive devices, including: analytical spot tests;' fluorescent sensors using either small-molecule fluorophores2 or fluorescent conjugated polymers;3 chemiresistive sensors;4 portable mass spectrometers;5 and X-ray systems.6 Each example listed has unique advantages and limitations. For instance, while X-ray systems are capable of detecting bulk hidden explosive devices and portable mass spectrometers are capable of identifying the exact chemical structures of suspect chemicals, the practical deployment and/or longevity of these technologies in standoff detection requires significant engineering.5 Fluorescent sensors are comparatively technology-unintensive and also have desirably low detection limits, but are only capable of identifying classes of molecules (such as nitroaromatics) or the presence of particular functional groups.3 Chemical spot tests can be more specific than fluorescent sensors but are not adaptable for standoff detection.
CH3 N02 02N N02 I 02N C NO2 N N' 02 KN 0-NO2 NO2 NO2 02N-O O'NO2 TNT RDX PETN
Figure 2.1. Structures of common high explosives.
-We previously discussed a chemosensing scheme based on the photoreaction between a hydride donor and either RDX or PETN, wherein the nitramine or nitroester component was photoreduced by 9,10-dihydroacridine (AcrH2, Figure 2.2) or its metalated analogues.7 The acridinium products (AcrH*) of this photoreaction had a high fluorescence quantum yield and resulted in a significant fluorescence turn-on signal in the presence of RDX and PETN.
H H H "D
Me Me R
AcrH2 AcrH* DHA
R, R', Rg = alkyl, aryl
Figure 2.2. Structures of the hydride donor AcrH2, its oxidation product AcrH*, and the 9,9-disubstituted 9,1 0-dihydroacridines, DHAs, studied herein.
While studying this photoreaction, we became interested in the photochemical stability of nitramine and nitroester compounds under ultraviolet (UV) irradiation. Nitroesters and nitramines have been known to degrade under highly acidic or basic conditions and established spot tests for PETN and RDX detect these degradation products as opposed to directly detecting intact PETN or RDX.1 The base-promoted digestion of nitroglycerin (NG) has been studied to some extent and is thought to evolve a mixture of nitrate and nitrite anions, among other degradation products (Scheme 2.1A).8 Similarly, RDX is also known to decompose in basic media and produce nitrite ions (Scheme 2.1A).9 The Greiss test0 for nitrite ions can, therefore, be employed to confirm the evolution of nitrite upon base-promoted degradation of RDX and
PETN. The chemistry behind the Greiss test is shown in Scheme 2.1B; in summary, the reaction
(5) to form a brightly-colored azo dye (7). The original reagent reported by Greiss was composed
of sulfanilic acid and a-naphthylamine; however, a more stable version of this formulation (the Zeller-Greiss reagent) containing sulfanilamide and N-(aX-naphthyl)-ethylenediamine hydrochloride has since been adopted." As seen in Scheme 2.1C, when nitrite test strips impregnated with the modified Greiss reagent were dipped into solutions of either RDX or PETN in 2:1 acetonitrile: 1 M NaOH, a bright pink color evolved, indicating the presence of nitrite anions.
Interestingly, when the same nitrite test strips were dipped into base-free acetonitrile solutions of RDX or PETN, dried and irradiated (A= 254 nm), formation of the pink azo dye was also observed (Scheme 2.1D), suggesting the evolution of nitrite ions upon the photolysis of RDX and PETN. Photolysis at 313 nm, 334 nm and 365 nm similarly resulted in a positive Greiss test. Moreover, extended exposure (30 minutes) to polychromatic light from solar simulator was also observed to photolyze RDX and PETN and yield a positive Greiss test (Scheme 2.1E).
The photolysis of nitroester and nitramine-based energetic compounds under various conditions has been extensively studied and found to produce a number of small-molecule degradation products, including nitrous and nitric acid, nitric oxide, nitrogen dioxide, formaldehyde and ammonia.1 2 The proposed photolytic degradation mechanisms for PETN and RDX are shown in Scheme 2.1 F. In the case of PETN, it is hypothesized that heterolytic cleavage of the O-NO2 bond initially produces an alkoxide (8) and a highly reactive nitronium ion (9) that rapidly forms nitric acid under ambient conditions.'3 For RDX, evidence of both the homolytic and heterolytic scission of the N-NO2 bond of RDX (to produce nitrogen dioxide (12) or nitrite, respectively) exists and the exact nature of the initial photoreaction is ambiguous. 14,12d
-37-Nevertheless, it can be agreed that the proposed initial products of RDX and PETN photolysis are highly reactive, electrophilic NO, species, which can conceivably convert sulfanilamide 4 to the diazonium cation 6 necessary to produce a positive result in the Zeller-Greiss test.
(A) N (B) zeler-Greiss NH2 HN, NH2CI
OH + N + Reagent 02N I,-N 2 System 0 0C 0,N 0 0 OH O% 0 1 5 2 12 NH2 NG 4 Detection Reaction: 102 N NH2 11 H N N NIeN_ -r r ) +oi oe NO2 5c NN N ',N N02 o2N . N 0N2 02,N N 2i RDX 3 H20 N 7 42 H 2N (C) (D) (E) (F) 1 5NOs o +* H PETNN2gNO g NO2 N02 2o p N H NNN N < 365 rn 0 10 H2U02 3 + 02N k)NNO, N02 N RDX + - + N,N. N20 11 12 +
base UV Sunlight HNo3
Scheme 2.1. (A) Degradation mechanisms of nitroesters and nitramines in basic media. (B) Active components and detection mechanism of the Zeller-Greiss test for nitrite ions.
(C) Nitrite ion test on base-degraded RDX and PETN. Test strips were dipped into blank 2:1 MeCN:
1M NaOH (i), or 17 mg PETN (ii) or 10 mg RDX (iii) in 3 mL 2:1 MeCN: 1M NaOH. (D) Nitrite ion test on photolyzed RDX and PETN. Test strips were dipped into (i) 10 mg RDX or (ii) 15 mg
PETN in 3 mL MeCN, or (iii) neat MeCN and irradiated at 254 nm for one minute. (E) Nitrite ion
test on RDX and PETN exposed to sunlight. Test strips were dipped into (i) 10 mg RDX or (ii) 15 mg PETN in 3 mL MeCN, or (iii) neat MeCN and irradiated with polychromatic light from a solar simulator for 30 minutes. (F) Proposed photolytic cleavage pathway of nitroesters and nitramines and
Unfortunately, the Greiss test or variations thereof cannot be adapted to detect RDX and
PETN for a few reasons. First, simple standoff detection (detection at a distance) with
colorimetric spot tests is not a viable possibility because of the difficulty in getting a clear optical signal returned from a purely absorptive process. Moreover, even with optimized reagent systems, the detection limit of the Greiss test is in the microgram regime,'5 which is not competitive with existing methods to detect RDX and PETN.
Herein, we propose instead a selective sensing scheme based on the photolytic cleavage of nitroester and nitramine compounds and subsequent detection of their photodegradation products via a turn-on fluorescence signal. We envisioned that a pro-fluorescent, or fluorogenic, indicator capable of reacting with the photodegradation products of RDX and PETN would allow for selective and sensitive detection of these explosives.
2.2 Indicator Design
Given the electrophilic nature of the NOx species generated by the photodegradation of RDX and PETN and their resemblance to the active electrophiles in aromatic nitration reactions, we targeted reactions between electron-rich tertiary aromatic amines and the photodegradation products of RDX and PETN. It was found that photolysis (A = 313 nm) of a mixture of
NN-dimethylaniline (DMA) and 2 equivalents of either RDX or PETN for 10 minutes in acetonitrile under anaerobic conditions afforded the formation of NN-dimethyl-4-nitroaniline (DMNA) in 14% yield (GC yield). Higher yields of DMNA were obtained with longer photolysis times and
DMNA was formed in ca. 80% yield after 1 hour. The photoreaction between DMA and either
RDX or PETN under anaerobic conditions was observed to produce only a single, yellow-colored product (DMNA) and other side products were not evident by TLC or GC-MS analyses.
-39-The 'H-NMR, IR and high-resolution mass spectra of the isolated yellow product exactly matched those obtained for an authentic commercial sample of DMNA. Conducting the photolysis under aerobic conditions resulted in partial demethylation of DMA16 and yielded a
mixture of DMNA and its demethylated analog, N-methyl-4-nitroaniline (13) (see Scheme 2.2).
Photolysis of DMA with ammonium nitrate was also found to produce DMNA, although longer photolysis times (>30 minutes) were required and greater amounts of demethylated side products were observed (most likely due to the presence of water or other nucleophiles in the solutions).
02NO ON0 2 02N 2<365nm O=N=O N 02N0 , 0N2 ONO2 g ' PETN N N NH O20 DMA + N A<365nm + +0 NO 2 NO2 2N N- N NN DMNA 13 RDX 12 (only under aerobic conditions) Scheme 2.2. Nitration of NN-dimethylaniline with the photodegradation
products of RDX and PETN.
A distinct absorbance band centered at 400 nm was found to accompany the formation of
the nitrated products under both aerobic and anaerobic conditions, which also matched the low-energy charge-transfer band displayed by commercial DMNA. However, DMNA has a very low fluorescence quantum yield17 and, therefore, a significant turn-on fluorescence signal is not generated upon reaction of DMA with the photodegradation products of RDX and PETN.
To probe the scope of the photonitration reaction, we investigated whether 9,9-dioctylfluorene, anisole and 1,2-dimethoxybenzene could be nitrated by RDX and PETN.
Extended photolysis (5 h) of a mixture of 9,9-dioctylfluorene and either RDX or PETN in 1:1 acetonitrile:THF at either 254, 313, 334, or 356 nm failed to generate any observable products and 9,9-dioctylfluorene was recovered in ca. 90% yield. Photolysis of anisole with RDX or
PETN yielded only trace amounts of 4-nitroanisole (<1% GC yield) after 4 hours. Photolysis of
1 ,2-dimethoxybenzene with either RDX or PETN yielded 1,2-dimethoxy-4-nitrobenzene in only ca. 8% yield after 2 hours; moreover this reaction did not proceed cleanly and numerous polar photoproducts were observed. Therefore, we concluded that anilines were the best candidates for
a potential indicator.
To create fluorogenic indicators based on the facile nitration reaction between aromatic amines and the photodegradation products of RDX and PETN, 9,9-disubstituted 9,10-dihydroacridines (DHAs, Figure 2.2) were targeted as chemosensors. We hypothesized that, upon nitration, the comparatively rigid DHAs would generate donor-acceptor chromophores possessing high fluorescence quantum yields.'8
2.3 Synthesis
As shown in Schemes 2.3-2.5, a series of 9,9-disubstituted DHAs were synthesized, starting from either N-phenylanthranilic acid methyl ester (Routes A and C) or a diphenylamine derivative'9 (Route B). DHAs were accessed by an acid-catalyzed cyclization of a tertiary alcohol intermediate (for example, structure 16). In Route A (Scheme 2.3), intermediate 16 is accessed by a double 1,2-addition of an alkyl or aryl Grignard reagent to either N-phenylanthranilic acid methyl ester (14) or its N-methyl derivative (15); this strategy to synthesize DHAs has previously been reported.20 In Route B (Scheme 2.4), tertiary alcohol intermediates 19-21 are accessed from 1,2-addition of the aryl lithium species derived from 18 to
-41-an appropriate ketone. This strategy was adopted to synthesize unsymmetric DHAs (DHA10-13) that have two different substituents at the 9-position, a spiro-DHA (DHA14), and a CF3 -containing DHA (DHA15).
Route A 0 OMe ClPh NaH, 14R=H dimethylsulfate, THF,rt3d LI5R=Me 80%
-H*
R'MgX OH I1i L 16 cat H2S04 DO DO R DHAI R = H, R' = Me (45% from 14) DHA2 R = H, R' = Et (35% from 14) DHA3 R = H, R' = 'Pr (17% from 14) DHA4 R = H, R'= Ph (57% from 14) DHA5 R = Me, R' = Me (42% from 15) DHA6 R = Me, R' = Et (30% from 15)DHA7 R = Me, R' = 'Pr (17% from 15)
DHA8 R = Me, R' = Ph (55% from 15) DHA9 R = Me, R'= Oc (40% from 15)
Route B
.nBuLi 0 Br NK
H 17 NaH, 80% dimethylsulfate, THF, rt 1 d BrK-N
A 1e 18 i. nBuLiii.
&
O
cat R' R" H2S04 MeJ DHAi0 R' = Me, R" = Et (57% from 18)
DHAII R' = Me, R" = Ph (50% from 18) DHAI2 R' = Me, R" = 'Pr (60% from 18) DHA13 R' = Et, R" = Ph (55% from 18)
cat H2S04 N'- N Me DHA14 20 (30% from 18) i. nBuLi O F3C CF3 F3C CF3 F3C CF3 N OH POC13 80% N'Me 80% N A- Me N' DHA15
Scheme 2.4. Route B for the synthesis of 9,9-disubstituted DHAs.
In all cases except one, adding a catalytic amount of concentrated sulfuric acid resulted in Friedel-Crafts reaction/cyclization of the respective tertiary alcohol intermediates to yield 9,9-disubstituted DHAs. This transformation is summarized in one step in Scheme 2.3; however, the cyclization is most likely not a concerted process. The X-ray crystal structure of DHA8 thus obtained is shown in Figure 2.3. The cyclization of compound 21 was uniquely challenging, as neither the use of strong acids, Lewis acids, nor thionyl chloride yielded DHA15. However, it was found that refluxing a solution of 21 in POCl3produced DHA15 in high yield.
-Figure 2.3. X-ray crystal structure of DHA8.
Br-- Me
Cu, K2CO3 N OMe MeMgBr
hex20, 190
IC,
24 hN
L
75% 0 Me 22 Me Br Me Me 0Cu, K2CO3 N OMe MeMgBr
hex20, 190 'C, 24 h N' Ph 55% Me Me Me 24 Me Me1 e OH Me Me Me Me N H2SO4 Me N N Me 23 Me DHA16 DHA17 1 1.3
(55% combined yield from 22)
Me Me tOH Me Me N H2B 4 Me N Me N Me Me Me -25 Me DHA18 (60% from 24)
Scheme 2.5. Route C for the synthesis of N-aryl DHAs.
Lastly, Route C was followed to synthesize N-aryl DHAs (Scheme 2.5). Copper-catalyzed N-arylation of 14 with 4-bromotoulene initially furnished 22, which was then reacted with 2.5 equivalents of methylmagnesium bromide and catalytic concentrated sulfuric acid.
Route C 0 OMe N'Ph H 14
Unfortunately, the Friedel-Crafts cyclization of intermediate 23 yielded a nearly-statistical mixture of DHA16 and DHA17 (1:1.3 DHA16:DHA17), which could not be acceptably separated by either column chromatography or recrystallization. Therefore, compound 24 was synthesized by copper-catalyzed N-arylation of 14 with 2-bromomesitylene and subsequently reacted with methylmagnesium bromide and sulfuric acid to access DHA18.
2.4 Photophysics
The optical properties of DHA1-18 are summarized in Table 2.1. The DHAs reported herein displayed similar UV-vis absorption spectra, with absorption maxima around 290 nm. Additionally, DHA1-18 generally displayed a single emission band centered at ca. 350 nm and were found to have similar fluorescence quantum yields and excited-state lifetimes.
-Table 2.1. Optical Properties of DHAs in acetonitrile. cmpd (magn kem/nm a t/ns (log F,) DHA1 284 (4.1) 352 0.18 2.7 DHA2 288 (4.1) 390 0.04 2.2 DHA3 288 (4.1) 376 0.09 2.7 DHA4 285(4.0), 355 0.13 1.6 320 (3.8) DHA5 285(4.1) 355 0.14 2.8 DHA6 246(4.1), 382 0.12 2.3 290 (4.0) DHA7 257 (4.1), 345 0.10 2.7 298 (3.9) DHA8 294 (3.9) 359 0.14 1.7 DHA9b 247(4.1), 345 0.15 2.8 290 (3.9) DHA10 246(4.3), 352 0.12 2.5 290 (4. 1) DHA11 289 (4.3) 355 0.14 1.7 DHA12 247 (4.0), 382 0.06 1.7 292 (3.9) DHA13 245(4.8), 355 0.09 2.2 296 (4.4) DHA14 247 (4.0), 345 0.15 2.4 297 (3.8) DHA15 280 (4.3), 354 0.18 2.5 311 (4.0) DHA16 + 290 (4.2) 371 0.05 2.7 DHA17 DHA18 290 (4.2) 371 0.03 2.5

![Figure 1.6. Dependence of (m on [AcrH 2 , AcrD 2 ] for the photoreduction of RDX, PETN and TNT](https://thumb-eu.123doks.com/thumbv2/123doknet/14681642.559389/14.918.146.791.255.501/figure-dependence-acrh-acrd-photoreduction-rdx-petn-tnt.webp)