HAL Id: hal-00795994
https://hal.inria.fr/hal-00795994
Submitted on 7 Mar 2013
HAL is a multi-disciplinary open access
archive for the deposit and dissemination of
sci-entific research documents, whether they are
pub-lished or not. The documents may come from
teaching and research institutions in France or
abroad, or from public or private research centers.
L’archive ouverte pluridisciplinaire HAL, est
destinée au dépôt et à la diffusion de documents
scientifiques de niveau recherche, publiés ou non,
émanant des établissements d’enseignement et de
recherche français ou étrangers, des laboratoires
publics ou privés.
Impact of IT Monoculture on Behavioral End Host
Intrusion Detection
Dhiman Barman, Jaideep Chandrashekar, Nina Taft, Michalis Faloutsos, Lim
Huang, Frédéric Giroire
To cite this version:
Dhiman Barman, Jaideep Chandrashekar, Nina Taft, Michalis Faloutsos, Lim Huang, et al.. Impact
of IT Monoculture on Behavioral End Host Intrusion Detection. ACM SIGCOMM Workshop on
Research on Enterprise Networking – WREN, 2009, Barcelone, Spain. pp.27–36. �hal-00795994�
Impact of IT Monoculture on
Behavioral End Host Intrusion Detection
Dhiman Barman
UC Riverside, Juniper
Jaideep Chandrashekar
Intel Labs Berkeley
Nina Taft
Intel Labs Berkeley
Michalis Faloutsos
∗UC Riverside
Ling Huang
Intel Labs Berkeley
Frederic Giroire
†MASCOTTE, I3S (CNRS, UNS) - INRIA, France
ABSTRACT
In this paper, we study the impact of today’s IT policies, defined based upon a monoculture approach, on the performance of end-host anomaly detectors. This approach leads to the uniform config-uration of Host intrusion detection systems (HIDS) across all hosts in an enterprise networks. We assess the performance impact this policy has from the individual’s point of view by analyzing network traces collected from 350 enterprise users. We uncover a great deal of diversity in the user population in terms of the “tail” behavior, i.e., the component which matters for anomaly detection systems. We demonstrate that the monoculture approach to HIDS configu-ration results in users that experience wildly different false positive and false negatives rates. We then introduce new policies, based upon leveraging this diversity and show that not only do they dra-matically improve performance for the vast majority of users, but they also reduce the number of false positives arriving in central-ized IT operation centers, and can reduce attack strength.
Categories and Subject Descriptors
K.6.5 [Management of Computing and Information Systems]: Security and Protection; C.2.0 [Computer-Communication Net-works]: General
General Terms
Management, Measurement, Security, Performance
Keywords
Host Intrusion Detection, Anomaly Detection, User Profile, Mea-surement, Enterprise Management
∗
Research was supported by NSF 0831530 and NSF 0832069 and an Intel gift.
†Research was supported by European project
IST FET AEOLUS
and the ANRPROJECTSSPREADS and DIMAGREEN.
Permission to make digital or hard copies of all or part of this work for personal or classroom use is granted without fee provided that copies are not made or distributed for profit or commercial advantage and that copies bear this notice and the full citation on the first page. To copy otherwise, to republish, to post on servers or to redistribute to lists, requires prior specific permission and/or a fee.
WREN’09,August 21, 2009, Barcelona, Spain.
Copyright 2009 ACM 978-1-60558-443-0/09/08 ...$10.00.
1.
INTRODUCTION
Host Intrusion Detection Systems (HIDS) have become ubiqui-tous in enterprise networks since all laptops and desktops issued to employees come preconfigured with a HID system on it. These end host applications thus form a key part of the overall enterprise security infrastructure, as they constitute the last line of defense. These systems are typically configured to interact with centralized IT management; for example, end hosts receive periodic updates (new signatures) and often batch alerts that are sent periodically to IT. Recent trends in commercial HIDS, called behavioral HIDS, have led to systems that perform not only signature detection (not studied here as they cannot detect previously unknown attacks), but also anomaly detection based upon user profiling. However, today’s behavioral HIDS are still fairly primitive and can monitor just a few features. Recent hardware capabilities, such as those in-troduced by Intel’s AMT [2], allows for in-hardware monitoring of a limited number of traffic features. It is not hard to imagine that in the future such hardware will be able to track large numbers of features simultaneously. As behavioral HIDS evolve, they will thus incorporate a larger and larger set of monitored features. Despite this impending development, there is little conventional wisdom about how to configure the thresholds that these detectors use. As the same time, the debate about the monoculture approach of IT management has resurfaced [7]. "It is believed that a collection of identical computing platforms is easier, hence cheaper, to man-age because making one set of configuration decisions suffices for all." Some [7] argue that deploying a monoculture could be a good defense if the configurations used are well tested and well under-stood. Others claim that monocultures benefit attackers because if they can successfully control one host, they can do it repeatedly on many hosts. Those that believe the latter have suggested introduc-ing artificial diversity to confuse attackers ( [7, 9, 26, 27]).
In this work, we study the impact of IT monoculture policies on performance in the face of these two trends, the increasing use of behavioral-based approaches to HIDS, and no coherent methodol-ogy for threshold selection of such systems. In particular we chal-lenge the common enterprise practice of configuring HID systems on laptops for an employee population all the same way. First we study the impact of such an approach on individual users. We col-lect traffic traces from over 350 end-hosts in a large enterprise net-work and demonstrate that there is tremendous natural diversity in user fringe behavior. "User fringe behavior" loosely refers to the outlier behavior of a user in terms of the features typically moni-tored by anomaly detectors. While it is generally believed that the user population is diverse, our study is the first to quantify diver-sity in the tail of feature distributions. We show that a monoculture policy to HIDS configuration leads to a situation in which individ-ual users experience dramatically different performance from one
to another in terms of false positives and false negatives. This is be-cause such policies implicitly ignore the underlying user diversity.
We then propose and assess diversity configuration policies, and show that the vast majority of users experience far superior perfor-mance under such policies. However we ask under what conditions do the benefits of diversity policies surface. We show that the gains of diversity over monoculture increase as the relative importance of minimizing false negatives to minimizing false positives grows. In other words, if minimizing false positives is an enterprise’s only goal, then diversity policies bring little gain. However as mini-mizing missed detections increases in importance, then the benefits of diversity surface more and more. We illustrate that our diver-sity policy can also limit the strength of attacks thereby reducing attacker effectiveness. We illustrate this even for a resourceful at-tacker that can observe end user behavior.
Several system administrators we polled favor the monoculture approach for two reasons; they claim that it is easier to check com-pliance for a large pool of employees when homogenous configura-tions are used, and they say that it is hard to interpret alarms if they fire under seemingly different conditions. To strike a balance be-tween a monoculture approach and that of a fully diverse approach, we propose a partial diversity policy in which users are put into a small number of groups. Configurations across groups are differ-ent, but users within each group are given the same configuration. Our preliminary study on partial diversity indicates that it is possi-ble with a small number of groups to achieve most of the benefits of a fully diverse approach.
2.
RELATED WORK
With encrypted traffic in a network growing, it becomes dif-ficult for in-network analysis [25], calling for more research on HIDS. HIDS typically has two components, signature detection and anomaly detection. Signature detection plays an important role, however, it is not useful in detecting previously unknown attacks. The anomaly detection component tracks pre-defined features of the end-host activity, defines normal behavior and then raises alerts when abnormal behavior are observed. A major class of anomaly detectors have been designed for tracking program execution; for such detectors alerts are raised when rules on expected program behavior are violated [11, 13, 17, 25]. In another class, anomaly de-tectors build statistical models of application layer or networking layer traffic [18–20]. In this paper, we use the example of statis-tical anomaly detectors at the networking layer that are intended to uncover DDoS, scanning and bandwidth flooding attacks (often conducted through botnets).
There has been much research on developing architectures and DoS solutions that propose to mitigate DoS attacks by enabling a receiver to stop unwanted traffic [4, 12, 21, 28, 29] (among others). Capability-based systems allow a receiver to explicitly authorize the traffic it is willing to receive, and filter-based schemes enable a receiver to install network filters to block unwanted traffic. How-ever, these designs are effective when receivers can reliably distin-guish attack traffic from legitimate traffic. The HID systems we explore herein are part of the infrastructure that helps to distin-guish attack traffic from legitimate traffic. More effective HIDS could complement the above systems with improved attack traffic detection. Approaches to detect and mitigate DDoS attacks due to botnets [14–16] provide defenses that observe traffic inside the en-terprise infrastructure, such as at gateways, routers and so on. For example, BotSniffer [15] proposes to detect botnet traffic within a network by exploiting the spatio-temporal correlation and simi-larities of responses to control commands issued by botmasters on C&C Channels. HID systems differ as they lie at the edge of the
network. They are resources for detailed user profile data that can be exploited to improve protection.
To increase their chances of evading detection, attackers try to hide inside normal traffic patterns by commanding zombies to in-crease their traffic in ways that are not too dissimilar from their regular traffic. One way to defend against mimicry attacks is to eliminate homogeneity (i.e. add diversity) in the system, so it is harder for the attacker to understand typical behaviors. There has been a large body of research propose to introduce diversity in the form of randomization at different abstraction levels (in memory locations, compiler, program execution) [8,26]. However, the con-cept of exploiting diversity in HIDS-based anomaly detection sys-tems has not been well explored [22]. Our study illustrates that applying diversity at the IT policy level of HIDS configuration can work to reduce the effectiveness of attacks, (such as limiting DoS attack strength), and improve the performance of individual hosts.
3.
PROBLEM STATEMENT
HID systems concurrently monitor a number of traffic features, each of which is compared against an anomaly detector threshold. When a threshold is exceeded, alerts are generated and periodi-cally sent to a central console. The particular value of the threshold determines the number of false positives (FP), which are benign alerts, and the false negatives (FN), i.e., the number of instances where there was an anomaly present without a corresponding alarm (a missed detection). We do not comment on which traffic features should be monitored; nor do we promote particular threshold values for the anomaly detectors. Instead, our goal is to illustrate the ram-ifications of enterprize policies on individual users when the under-lying population is very diverse. As the malware threats evolve, so will the methods used to detect them; thus we expect that the partic-ular features tracked for anomalies, and their associated thresholds will change over time.
We studied features that have been suggested in the literature [6, 24], or else are capabilities of specific commercial products [1, 3, 10]. A list of the features experimented with are enumer-ated in Table 1. The table indicates the type of anomaly intended to be detected by the particular feature, as well as some commercial products that incorporate it. The list of features we study is repre-sentative, but in no way exhaustive. A common property of these features is that they are all additive.
Feature Anomaly Product
num-DNS-connections Botnet C&C Damballa num-TCP-connections scans, DDoS Cisco CSA
num-TCP-SYN scans, DDoS BRO, CSA
num-HTTP-connections Clickfraud, DDoS BRO, BlackIce
num-distinct-connections scans BRO
num-UDP-connections scans, DDoS Cisco CSA
Table 1: Features Used in Our Study.
We assume that each host in an enterprise can be potentially in-fected and recruited into a botnet, and the botmaster can potentially use all such hosts to stage a DDoS attack, send out spam, or any of
the other activities hosted on botnets. We use gji to be the random
variable representing the value of the jthtraffic feature on end-host
i(i.e., one of the features described in Table 1). The botmaster can
instruct the recruited hosts to send out additional traffic to other destination, which additively increases the feature being tracked.
Let bj
ibe the increase in traffic feature j corresponding to the
two types of attackers. One is naive and does not have any knowl-edge of the traffic pattern of the endhost; this attacker injects arbi-trary amounts of traffic into the user’s traffic. In our second model, we assume a resourceful attacker that has inserted monitoring code on the zombie’s machine and can thus compute histograms of the user’s behavior himself. This strong threat model captures an at-tacker with a great deal of knowledge about the user. We do assume that the malicious traffic is additive in the tracked feature. Thus the traffic seen by the anomaly detector tracking feature j on host i is
given by the random variable gij+ b
j i.
The policy chosen by the IT operator assigns a threshold Tj
i to
end-host i for feature j. If at any time gij+ b
j
i > T
j
i, an alarm
is raised. The false negative rate is thus defined as the probability
of a missed detection, F Ni = P (gij+ b
j
i < T
j
i). Similarly, the
false alarm rate is defined as F Pi= P (gji > T
j
i). The problem at
hand is to define good policies for selecting the Tijvalues across all
features and across all users such that each user experiences good
performance in terms of their own(!F Ni, F Pi"). Although often
not explicitly stated, enterprise IT departments do hope that all their users will experience roughly similar performance. In theory, they do not want some users to be more vulnerable than others; that is the reason for the typically strong enforcement of security policies across all employees.
4.
POLICIES
We model an enterprise policy to configure the anomaly detec-tors in the HIDS systems as having two components, (i) a
thresh-old selectionheuristic, and (ii) a grouping method. The
group-ing method specifies whether each host is treated individually (i.e., number of groups equals number of hosts), whether all hosts are treated the same (i.e., a single group), or whether the hosts are or-ganized into a small number of groups, such that all hosts within a group receive the same configuration.
Various heuristics can be applied for selecting particular thresh-old values. We examined multiple threshthresh-old heuristics, including
percentile detectors, those based on optimizing the F-measure1,
cases when outliers are defined as the mean plus a few standard de-viations, and some cases based on picking a threshold to optimize a utility function. A particular threshold value, impacts the trade-off between false positives and false negatives, and thus determines
the detector’s operating point, i.e., (!F Pi, F Ni"). Due to lack of
space, we present only the results for the percentile based detectors, as these are the most intuitive. (However, our basic findings hold across different threshold heuristics and can be found in [5].) This heuristic targets a particular false positive rate, without regard to the false negative rate. We conducted a survey of about a dozen IT personnel across 4 enterprises and 1 university. They all said that there are no standard rules of thumb as to how to balance the false positives versus the false negatives, when they have explicit control over threshold setting. They indicated that a common choice by IT
operators today is to roughly target the99th
percentile value; thus unless otherwise specified, this is the particular threshold selection
heuristic we experiment with. The significance of the99th
heuris-tic, and why it is popular, is that it provides a very explicit control on the rate of false positives (at most 1%, by definition). Further-more, as described in [23] current enterprise defenses (against mal-ware and other intrusions) today tend to attach a lot more impor-tance to low false positive rates than to low missed detections.
The second part of our policy is the grouping method, which determines how the population of end-hosts is partitioned, and the
1
This is defined as the harmonic mean between precision and re-call, and is often suggested in the statistical literature.
number of thresholds that must be computed. We look at three grouping scenarios.
◦ In the homogenous scenario, all the users (end-hosts) are
config-ured with exactly the same threshold value, determined by the IT operators. This mirrors the current model of operation for most IT departments. Each end-host computes its traffic probability distri-bution and ships it off to the central console (this is done for every traffic feature being monitored). At the centralized location, all the individual distributions are collapsed into a single global distribu-tion from which the targeted percentiles are extracted.
◦ In the full-diversity scenario, each end-host independently
deter-mines its own threshold value, based on its own traffic observations. Thus, the threshold values are allowed to be completely different at each host. For the percentile heuristic, the host simply builds the empirical traffic distribution and extracts the particular percentile values (all done locally).
◦ In the partial-diversity setting, users are partitioned into a small
number of groups, and within each individual group, the thresholds are set to the same value. This is similar to applying the homoge-nous scenario inside each group, but allowing the thresholds to be different across groups. This grouping method requires centralized reporting much like the homogenous solution. Again, all the data is pulled to the central console. The end hosts are partitioned into groups and a single threshold is computed per group per feature, which is then communicated back to the hosts. We describe an ini-tial grouping heuristic used herein in the next section. The question of how to group endhosts is an interesting and potentially complex problem itself that we leave for future work.
5.
USER DIVERSITY
Dataset: Our data consists of network packet traces collected at
350 end-hosts (95% of them are laptops and all hosts were using Windows XP) in a large enterprise network. The traces span over 5 weeks in Q1 of 2007. Each end-host corresponds to an indi-vidual user and all users enrolled on a volunteer basis. The data collection was performed by a stand alone application (a wrap-per around the windump tool). In addition to collecting packet headers, our collection tool watched for changes in IP address, in-terfaces (e.g., wired/wireless) and location. Because the collection was performed directly on the end-host, all packet activity was cap-tured, even when the mobile laptops changed environments (home, work, different wireless interfaces, etc). This dataset captures an unusually complete view of users’ behaviors; data collections that are carried out at gateways and routers do not capture user activity when they leave work or switch to another network.
User Traffic Characteristics:We processed the traffic traces from
350 end-hosts using the Bro tool [24] and constructed time-series for each of 6 anomaly detection features mentioned in Table 1. The counts in each time series were aggregated 5 minute (and 15 minute) bins. We present results here for the 15 minute case, noting that the conclusions hold for the shorter binning interval as well. The particular features were selected because they appear in
exist-ing anomaly detection systems ( [2, 10, 24])2. We treat each bin
count as a sample point of the distribution P(gj
i) for the i
th
end-host. Once we obtain the distributions, P(gji), we compute 99
th
and99.9th
percentiles of each feature distribution as cut-off thresh-olds.
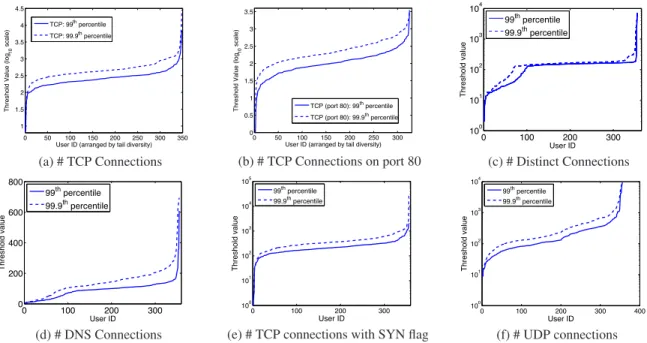
Figure 1 shows the tremendous diversity in choice of thresholds
2
Features chosen from [24] were only those that are computed on a per source basis
0 50 100 150 200 250 300 350 1 1.5 2 2.5 3 3.5 4 4.5
User ID (arranged by tail diversity)
T h re sh o ld Va lu e (l o g10 sca le ) TCP: 99 th percentile TCP: 99.9th percentile (a) # TCP Connections 0 50 100 150 200 250 300 0 0.5 1 1.5 2 2.5 3 3.5
User ID (arranged by tail diversity)
T h re sh o ld Va lu e (l o g10 sca le ) TCP (port 80): 99th percentile TCP (port 80): 99.9th percentile (b) # TCP Connections on port 80 0 100 200 300 100 101 102 103 104 User ID T h re sh o ld va lu e 99th percentile 99.9th percentile (c) # Distinct Connections 0 100 200 300 0 200 400 600 800 User ID T h re sh o ld va lu e 99th percentile 99.9th percentile (d) # DNS Connections 0 100 200 300 100 101 102 103 104 105 User ID T h re sh o ld va lu e 99th percentile 99.9th percentile
(e) # TCP connections with SYN flag
0 100 200 300 400 100 101 102 103 104 User ID T h re sh o ld va lu e 99th percentile 99.9th percentile (f) # UDP connections Figure 1: Tail diversity exists across multiple features
that would result if this personalized policy were adopted. Interest-ingly, the range of diversity varies by 3 to 4 orders of magnitude for 5 of the 6 features assessed here. (The number of DNS connections varies only across two orders of magnitude.) This demonstrates in a loose sense, that the “tail", or fringe, of the user’s behavior begins in very different places for different users. For example, Fig.1(a) illustrates that the beginning of these “tails" can range from 50 to 7000 for a false positive rate of 1%. We thus conclude that there is a great deal of diversity in user fringe behavior (i.e., in the out-lier regions of a particular behavioral feature) and this is the part of their behavior that matters for anomaly detection.
If all hosts were to self select their cutoff thresholds this way, then the threshold would be meaningful in terms of their own be-haviors, namely that all users would experience a common false positive rate. This simple point is important; we believe that IT policies should target a common user performance point rather than a common user configuration. Our study reinforces that these two goals cannot be simultaneously achieved because of the inherent user diversity.
This result indicates that some users will be more useful than others in detecting a given attack. Those with low thresholds are better suited to catchy stealthy behaviors. If one user is well suited (because of their natural behavior) to detecting an attack type A, while a second user is better suited to uncovering attack type B, then clearly these two users could collaborate to help each other. In Fig. 2 we plot the 99th percentile value for each user for two fea-tures. Each point is one user, and the 99th percentile value for TCP connections is given on the x-axis, while the value for UDP connec-tions is given on the y-axis. We see some users at the extreme lower right of the graph. These users are "light" in terms of the maximum number of UDP connections they generate, but "heavy" in terms of the TCP traffic they generate. Such users are more likely to be use-ful in detecting attacks that involve abnormal UDP behavior than those involving abnormal TCP behavior. Conversely, the users in the far upper left of the plot are exactly the opposite.
As a second quick check on the potential of users to play dif-ferent roles in collaborative anomaly detection, we also extracted
0 200 400 600 800 1000 1200 0 200 400 600 800 1000 1200 # TCP Connections (99 %tile) # U D P C o n n e ct io n s (9 9 % ti le )
Figure 2: Each point is one user. Comparison of fringe behav-ior of two features for individual users.
the user identities of those with the 10 lowest thresholds, under the Diversity and Partial-Diversity policies. We did this for two features, the number-of-UDP-connections and the number-of-TCP-connections. In a loose sense, these users can be viewed as the “best” users for detecting stealthy anomalies because they can iden-tify small anomalies since their thresholds are low. The identities of these users are stated in Table 2. The particular identity of each user is not important here. The point is that looking across the lists for these two features, for the Diversity policy, we see only 2 common users. For the Partial-Diversity policy, we only find 4 common users across the two features. This indicates that typically those users that are best for detecting attacks involving TCP con-nections are not the same as those that are the best for detecting attacks involving UDP connections. Figure 2 and Table 2 indicate that when user thresholds are personalized, it opens the door to new and interesting possibilities to explore defenses in which users play different roles.
Grouping Users: We tried to use a simple k-means approach to
finding clusters over the user population in order to evaluate the par-tial diversity grouping policy. Specifically, we attempted to cluster
Feature Full Diversity Partial Diversity (identities of best users) (identities of best users) number UDP connections (85, 183, 18, 174, 179, 166, 101, 103, 10, 105) (78, 37, 151, 123, 19, 26, 24, 21, 84, 179) number TCP connections (138, 314, 85, 265, 37, 72, 62, 179, 142, 64) (78, 314, 37, 162, 123, 104, 172, 138, 136, 21)
Table 2: Best users per alarm type.
However such a method did not prove very meaningful because we there wasn’t a natural separation, in our dataset, over the beginning of tails in individual distributions. We posit that the diversity in the user population is rich enough such that users sweep through the entire range of values (the basis for doing the clustering). In other words, there are no natural “holes” or boundaries between groups. In this initial study of partial diversity policies, we thus relied on the following simple heuristic to build the clusters.
We extract the 99th percentile value of the particular traffic fea-ture; we first group the top 15% users into one group and bottom 85% users into another group. This was done based on the data in Fig. 1 in which we see that roughly 10 to 15% of our users are very heavy with respect to all others. In many of these plots, we see a knee in the curve for the top heavy users, and our choice of 15% corresponds roughly to this knee. Then, we divide the top 15% into 4 groups and bottom 85% into 4 groups. Although there are only a few nodes in the top 15%, their individual thresholds vary a lot. Subdividing the heavy users into many small groups is appealing because they have the ability to significantly distort the thresholds computed for other users in their group (if those users have very different behaviors such as light or medium users). We studied settings in which users were grouped into 2, 3, 5 and 8 groups. However, due to a lack of space, we only present results in this paper for the case of 8 groups which we denote 8-partial. In our evaluation, this setting provided the best results (i.e., performed closest to full-diversity).
6.
PERFORMANCE EVALUATION
In this section, we compare the overall performance impact of various policies on our enterprise users. Recall that each policy is a combination of a threshold heuristic and a grouping policy. We consider all three grouping strategies, and focus on two threshold
heuristics (either the99th-percentile or the utility function).
6.1
Methodology
Each end-host, for a particular threshold, experiences a single
performance point, i.e., the tuple!F Ni, F Pi" that specifies their
individual balance between false negatives and false positives. Ex-amining hundreds of users, each experiencing different tradeoffs for various policies is challenging to illustrate in a few graphs. This is in part challenging because one policy may improve the balance for the majority of users, but not for a few exceptional ones. To
summarize the two performance measures F Niand F Pivia a
sin-gle metric, and to allow for an overall quantitative comparison cap-turing this “balance” across users, we use a per end-host utility, computed as follows for end-host i:
Ui(Ti) = 1 − [wFNi+ (1 − w)FPi]
Here, Uican vary between 0 and 1. Given that an ideal detector
should have a low false positive rate as well as a low false negative
rate, higher utility values are more desirable (Ui = 1 is the best
case, achieved when FNi= 0 and FPi = 0). This formulation of
(local) utility allows to further construct a system wide utility met-ric by averaging across the user population. Recall that our survey
indicated that IT personnel cannot generally articulate a particu-lar weighting ’w’ quantifying the relative importance of these two classic performance metrics. We were motivated to use this utility, because it allows us to explore a variety of weighting options. Also, we will see that the gain of diversity over homogeneous policies are dependent on this weight.
To evaluate the scenarios, we used the following procedure: data from the first week was used to learn the thresholds, subsequently applied to the second week. Similarly, data from week 3 was used to obtain thresholds, then applied on data from week 4. Thus our thresholds are updated (re-learned) weekly, and each week of test-ing is based on threshold computed ustest-ing the prior week as traintest-ing data. In each week where the threshold is applied, we compute the utility for all the scenarios. In the course of our experiments, we did discover that the thresholds are not stable from week to week. That is, selecting a threshold based on the 99th percentile (for a given week) did not always reflect a 1% false positive rate in the next week.
Our evaluation methodology includes the use of both simulated attack data, and real attack data collected from live malware traces. We inject the synthetic anomalies, or replay the real ones, by over-laying them on the actual user traces. In the case of the simulated attack data, we experiment by sweeping through a large range of attack sizes. We do this, rather than select a particular attack size, since malware attacks constantly evolve, and we wish to understand the performance in the broad sense. The largest attack for a given feature is determined by finding the user whose own traffic hits the maximum seen value for the given feature. For example, the max-imum attack size in terms of number of TCP connections, is found from the user with the largest number of simultaneous TCP connec-tions across all users. Clearly any attack larger than this will stand out on every user’s HIDS because it clearly exceeds normal behav-ior. We are interested in the attack sizes that have the potential to hide inside user traffic because they lie within the normal range of user traffic.
6.2
Results
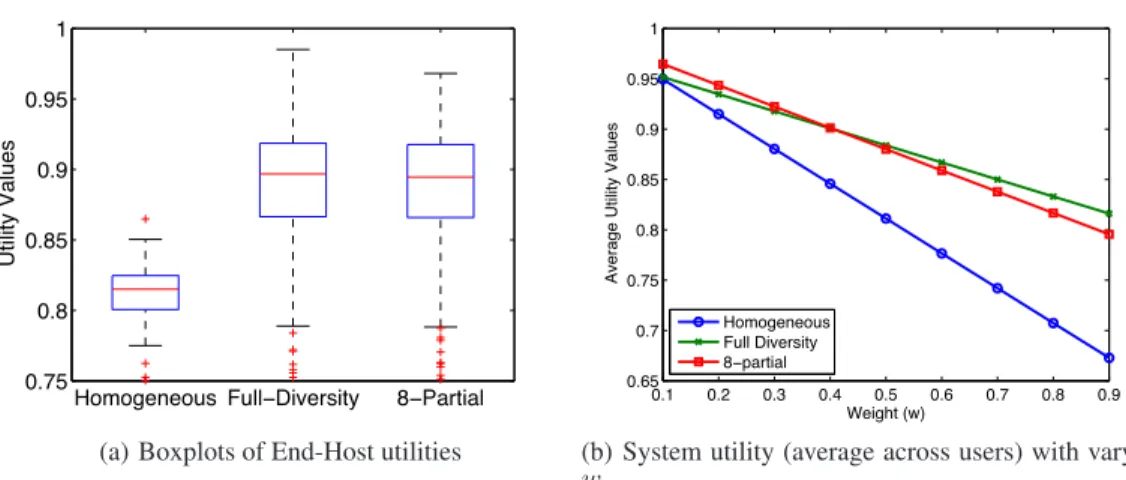
Full-diversity performs better than Homogeneous:In Figure 3(a),
we use boxplots to describe the distribution of individual end-host utilities. The results here pertain to the feature number-of-TCP-connections. In this particular case, we use the utility function
heuristic Ui(Ti) = 1 − [0.4FNi+ 0.6FPi] with w = 0.4 and pick
the threshold that maximizes each user’s utility. For this heuristic, we compare the three grouping policies.
Comparing the homogeneous and full-diversity policies in the figure, we see that the utility is considerably higher for the vast ma-jority of the users under a diversity policy. This means that aside from a few exceptional cases, individual hosts achieve a better bal-ance between false positives and false negatives with a diversity approach. This is not surprising; the homogeneous policy picks a single threshold by ensembling all users, and the heavy users end up having a strong inadvertent affect on the light and medium end-hosts. The chosen threshold will be far too high for them, leading to a miserable detection rate. Allowing the threshold to better
rep-Homogeneous Full!Diversity 8!Partial 0.75 0.8 0.85 0.9 0.95 1 U ti lit y Va lu e s
(a) Boxplots of End-Host utilities
0.1 0.2 0.3 0.4 0.5 0.6 0.7 0.8 0.9 0.65 0.7 0.75 0.8 0.85 0.9 0.95 1 Weight (w) Ave ra g e U ti lit y Va lu e s Homogeneous Full Diversity 8!partial
(b) System utility (average across users) with varying w
Figure 3: Comparison of Homogeneous, Full-Diversity, and Partial-Diversity policies
resent the tail of the particular end-host lowers the false negative rate considerably (improves detection). A key lesson for IT depart-ments, is that the monoculture approach has ramifications in that users end up affecting each other in ways that don’t make sense, es-pecially in light of their underlying diversity. We noted earlier that attacks, and the features used to detect them, are likely to evolve. However, we posit that user diversity may be an invariant, and thus allowing this to influence IT policy is appealing.
To consider a broader range of "balance points", in terms of the false positive and false negative tradeoff, we considered the full range of ’w’ in Figure 3(b). To summarize the boxplots, we simply plot the average per host utility across the entire population. In gen-eral, we see that the difference in utility between the homogenous and full diverse scenarios grows with larger values of w. However, when w is small, the differences are small. To state this differently, the more importance one attaches to a false negative rate (missed detections), the greater the benefit of a diversity policy over a ho-mogenous one.
To explain why the lines diverge as w increases, note that the ho-mogenous setting biases the threshold in favor of the heavy users, i.e., the thresholds tend to be higher than ideal for most of the light to medium users. This generally translates into a lower proba-bility of detecting an attack (higher false negative). In the full-diversity scenario, the thresholds tend to be lower for these (light to medium) users which translates into a lower false negative rate. Consequently, when w is increased, the differences in the false neg-ative rates is highlighted while the differences in the false positive rates is downplayed.
Partial-diversity performs almost as well as full-diversity:
Go-ing back to Figure 3(a), we see that the distribution of per host utilities in the partial diversity setting (i.e., 8-partial) is quite close to the full-diversity setting. There are differences in the upper and lower ranges of the distributions, but for the most part there is not a great difference. The obvious take away here is that the partial-diversity setting can approach the performance (utility) of the full-diversity scenario. To explain why this might be the case, notice that in the partial diversity case, the per-group thresholds are going to be smaller than the thresholds in the homogenous threshold and also closer to the actual thresholds for each individual end-host (as would be computed in the full-diversity scenario). Thus, with more number of groups, the thresholds begin to very closely approach the thresholds that would have been computed in the diversity setting; hence the utilities are quite similar.
The success of partial-diversity has the potential to be far more attractive to IT departments than a full-diversity policy. Although end host configuration could be done autonomically, in theory, most IT personnel believe that a large amount of manual checking will continue to be required. Thus they view full diversity policies as potentially creating high management overhead. However, when we asked our IT operators about partial diversity policies, they seemed far more open to the idea of grouping users into a small number of groups and dealing with a limited number of differing configurations, especially if it reduces the number of false positives they have to handle.
To compare the number of false alarms arriving at an IT opera-tions center, we calculated the average number of false alarms, over a one week period, when there are 350 users supported in an enter-prise network. The results for each policy are shown in Table 3. We see that the full diversity policy typically generates half the alarms of a homogeneous policy. A rate of 892 alarms per week, coming from 350 users, implies that each user generates roughly 3 alarms per week. Partial diversity can also significantly reduce the number of alarms in comparison to a homogeneous policy.
Threshold Heuristic Homogeneous Full Diversity Partial Diversity
99th-percentile 1594 892 482
utility, w = 0.4 3536 1194 2328
Table 3: Average number of false alarms arriving at central IT operation center per week.
Full-diversity reduces attacker effectiveness: Here, we try to
understand which of the strategies performs best at restricting the “room” that an attacker might be able to exploit to send out mali-cious traffic undetected. Simply put, the “room” that we talk about
is the difference Tij− g
j
i, for user i and feature j. Clearly, if this
difference is large, the attacker can send out a larger volume of ma-licious traffic without any alarms being raised. Minimizing this dif-ference goes toward significantly reducing the effectiveness of the attacker. In the case of DoS attacks (for example, when the num-ber of TCP connections rises unexpectedly), limiting this "room" is equivalent to limiting each hosts’ contribution to a DDoS episode. We contrast two types of attacker: (i) a naive attacker that does not have any knowledge of the traffic patterns of the end-host, and (ii) a resourceful attacker that is able to somehow learn the
we assume that the resourceful attacker is cautious, and is will-ing to sacrifice some attack traffic volume to increase their chance of going undetected. We experiment with one specific instantia-tion of this where the resourceful attacker wants to evade detecinstantia-tion with a 90% probability. That is, the attacker, using his estimation
of the threshold Tijalong with his measured P(g
j
i), computes the
largest bji such that P(g
j i+ b
j
i < T
j
i) = 0.9. This style of threat is
sometimes called a ”mimicry attack” because the attacker is largely trying to mimic the users traffic patterns.
In Figure 4(a), we plot average detection rates across the user population (on the y-axis), while we sweep through the entire range of possible attack sizes (on the x-axis). Here, for any given attack size (value on x-axis), the value on the y-axis represents the frac-tion of users that would have raised an alert. The curves clearly highlight that the full diversity and partial diversity have a very large advantage in detecting these attacks (over the homogenous setting). Reading off from the plot, with attack sizes of over 100 connections/window, about 70% of the (homogenously configured) hosts raise an alarm, while this number is above 90% for the diver-sity and partial-diverdiver-sity policies. More significantly, we observe that the fully diverse configuration outperforms the homogenous configuration in detecting stealthy attacks (those in the range of 1-100 connections/window). This is intuitive: attacks of size 40 or 50 can still stand out as anomalous when compared to the traffic patterns of very light users. It is the light and medium users that catch the stealthy attacks. A naive attacker cannot do better than this because he is unable to mimic the traffic of each individual.
Results for the resourceful attacker setting are shown in Fig-ure 4(b). Here, we see that the level of attack traffic the attacker is consistently lower in the full-diversity (and partial-diversity) case as contrasted with the homogenous case. In the latter case, the median attack size for the latter is about 310 connections/window, which is reduced to a third when we use a full-diversity configu-ration (or even the partial-diversity configuconfigu-ration with 8 groups). Keep in mind that this performance is for an attacker that works extremely hard to try to stay undetected; he needs to monitor each end host without being noticed, and this may not be trivial because profiling requires lengthy measurement activities.
To summarize, using the synthetic attack traces, we have demon-strated that with diversity policies, users experience better false positive and false negative performance, and a centralized IT de-partment experiences fewer false alarms. Moreover, the full-diversity and partial-diversity policies can significantly limit the amount of malicious traffic that attackers can send from enterprise endhosts while evading detection. The only downside to such policies is the need to configure the end host in a more involved manner; in our opinion this is a minor issue.
Lastly, we evaluate how the different policies fare in detecting an actual attack. We use traces collected from a STORM zombie (run-ning on a live host with all inessential services turned off). Traces were collected for a week. These traces are overlaid on the every in-dividual user trace (to obtain the false negative rate). The particular traffic feature used in this analysis is number-distinct-connections (measured by distinct IP destination addresses). In this comparison,
we report the actual FNi, FPinumbers, rather than report the
util-ity number. Figure 5(a) plots all the individual performance tuples across all the users in the homogenous configuration (blue circles) along with the points for the full diversity case (green triangles).
Note that the y-axis plots(1 − FNi), i.e., the detection rate. Here,
with full-diversity, the bulk of the user population has an FP rate
of about0.01, but the detection rates are wildly different across the
hosts (most between[0.3, 0.7]). The homogeneous approach has
the opposite effect. Detection rates are mostly around0.5, but the
false positive rates are scattered over many orders of magnitude. The interesting question is: between these two options, which is best overall? The homogeneous policy is clearly the poorer choice for a few reasons. The false positive rates differ dramatically. In particular, the few users with very high false positive rates corre-spond to our heaviest users. This means an enormous number of false positives will arrive in an IT center. With the diversity policy, the number of false positives is controlled. But we see two other advantages. Overall, more users have a better detection rate un-der the diversity policy. Importantly, even though a few users have poor detection performance, there is a way to compensate for this by using collaborative detection. Those users with high detection rates can inform other users when malicious events occur. Under a homogeneous policy, there is no way to compensate for the false positive problem.
Figure 5(b) plots the performance characteristics for the full-diversity and 8-partial scenarios. We briefly point out the difference with Figure 5(a): the false positive rates (for 8-partial) are bounded to a smaller range (compared to the homogenous case) and at the same time, the detection performance is largely the same (except for a few users). Thus, even for this real-world case, a partial diver-sity policy seems to offer a compromise between the two extreme policies analyzed in Figure 5(a).
7.
CONCLUSIONS AND FUTURE WORK
In this work we challenged the standard corporate IT policy of configuring all the HIDS anomaly detectors in end-hosts via a ho-mogeneous policy in which all users are configured with exactly the same thresholds for anomaly detectors that monitor traffic patterns for abnormalities. We demonstrated that there is a great deal of diversity among users in terms of their behavior for these types of features. In particular, we focused on the tail of these distributions– the portion of the distribution that matters for anomaly detection. We showed that there are ramifications to IT management policies that inadvertently ignore this user fringe diversity. We proposed al-ternative policies that allow users to be configured differently from one another. Through a comprehensive evaluation of these diver-sity policies, applied to 350 end-hosts in our enterprise, we demon-strated the benefits of such policies that explicitly incorporate no-tions of user diversity. We showed that these benefits surface, even when different targets, in terms of the balance between false pos-itives and false negatives, are sought. However, we note that the benefits of diversity over a monoculture approach increase the more IT cares about minimizing false negatives. We demonstrated that another side benefit of diversity policies is that they reduce an at-tacker’s effectiveness, even for resourceful attackers. Finally we showed that evaluations of initial partial diversity policies hint that it may be possible to group users into a small number of groups (each of which has their own configuration) and have them experi-ence most of the benefits of a full-diversity policy.
Our study reveals a number of issues and tradeoffs that surface when evaluating the impact of such policies on users. We believe our study is the first to carry out such an evaluation on actual cor-porate endhost data. In general, we believe our findings indicate that a comprehensive re-evaluation of the way IT administrators set HIDS thresholds would be beneficial.
There are many avenues for future research. First, we would like to study alternate grouping policies to see if our finding, that partial diversity policies can perform as well as full-diversity, holds over a range of grouping methods. Second, we are interested in working with IT to try to better quantify the costs of management in terms of HIDS configuration. In our survey, IT operators were not able to articulate well such costs even though they felt strongly that
di-0 100 200 300 400 500 0.5 0.6 0.7 0.8 0.9 1 Attack Size Pe rce n ta g e o f u se rs ra isi n g a la rms Homogeneous Full Diversity 8!partial
(a) Naive Attacker
Homogeneous Diversity 8!Partial
0 100 200 300 400 500 H id d e n T ra ff ic (b) Resourceful attacker Figure 4: Diversity restricts attacker effectiveness
10!4 10!3 10!2 10!1 100 0 0.2 0.4 0.6 0.8 1 False Positive 1! F a lse N e g a ti ve Homogeneous Diversity
(a) Full Diversity vs. Homogenous
10!4 10!3 10!2 10!1 100 0 0.2 0.4 0.6 0.8 1 False Positive 1! F a lse N e g a ti ve
8!level partial diversity Diversity
(b) Full diversity vs. 8-Partial Figure 5: Performance comparison for real attack (Storm Botnet)
versity configurations could lead to heavy management. Third, we plan to explore further the notion that different users can play dif-ferent roles in terms of detecting anomalies. Our study indicates that one subset of users surface as sensitive to a particular kind of attack, simply due to the nature of their behavior, while another subset turns out to be useful for a different attack. Understand-ing the roles users play could greatly enrich collaborative detection schemes.
8.
REFERENCES
[1] Damballa.
http://www.damballa.com/solutions.
[2] Intel Active Management Technology.
http://www.intel.com/technology/ platform-technology/intel-amt/,http: //www3.intel.com/cd/business/enterprise/ emea/ENG/310547.htm. [3] Mcafee. http://www.mcafee.com/products/ systems_security/clients.
[4] K. Argyraki and D. Cheriton. Scalable Network-layer
Defense Against Internet Bandwidth-Flooding Attacks. In ACM/IEEE Trans. on Networking (to appear), 2009.
[5] Dhiman Barman. Challengs in Security and Traffic
Management in Enterprise Networks. PhD dissertation, U.C. Riverside, March 2009.
[6] J. Binkley and D. Parekh. Traffic Analysis of UDP-based
flows in Ourmon. In Proc. of FLOCON, 2009.
[7] K. P. Birman and F. B. Schneider. The Monoculture Risk Put
into Context. In IEEE Privacy and Security Magazine, Jan./Feb. 2009.
[8] J. Caballero, T. Kampouris, D. Song, and J. Wang. Would
diversity really increase the robustness of the routing infrastructure against software defects? In Proc. of NDSS Symposium, San Diego, 2008.
[9] M. Chew and D. Song. Mitigating Buffer Overflows by
Operating System Randomization. In Technical Report CMU-CS-02-197, 2002.
[10] Cisco. Always Vigilant Endpoint.
http://www.cisco.com/en/US/products/sw/ secursw/ps5057/index.html.
[11] David Wagner et al. Mimicry Attacks on Host-BAsed
Intrusion Detection Systems. In Proc. of CCS’02, 2002.
[12] Colin Dixon et al. Phalanx: Withstanding Multimillion-Node
Botnets. In Proc. of USENIX NSDI, 2008.
[13] David Brumley et al. Towards Automatic Discovery of
Deviations in Binary Implementations with Applications to Error Detection and Fingerprint Generation. In Proc. of USENIX Security Symposium, 2007.
[14] Guofei Gu et al. BotHunter: Detecting Malware Infection
2007.
[15] Guofei Gu et al. BotSniffer: Detecting Botnet Command and
Control Channels in Network Traffic. In Proc. of NDSS’08.
[16] James Binkley et al. An algorithm for anomaly-based botnet
detection. SRUTI Workshop, 2006.
[17] S. Forrest, A. Somayaji, and D. Ackley. Building diverse
computer systems. In Proc. of HotOS, 1997.
[18] James R. Binkley et al. An algorithm for anomaly-based
botnet detection. In Proc. of USENIX SRUTI, 2006.
[19] T. Karagiannis, D. Papagiannaki, N. Taft, and M. Faloutsos.
Profiling the End Host. In Passive and Active Measurement Conference (PAM), April 2007.
[20] C. Kreibich, A. Warfield, J. Crowcroft, S. Hand, and I. Pratt.
Using Packet Symmetry to Curtail Malicious Traffic. Fourth Workshop on Hot Topics in Networks (HotNets-IV), 2005.
[21] X. Liu, X. Yang, and Y. Lu. To Filter or to Authorize:
Network-Layer DoS Defense Against Multimillion-node Botnets. In In ACM SIGCOMM, 2008.
[22] Roy A. Maxion. Use of Diversity as a Defense Mechanism.
In Proc. of New Security Paradigms Workshop, 2005.
[23] S. Nanda and T. Chiueh. Execution Trace-Driven Automated
Attack Signature Generation. In Annual Computer Security Applications Conference (ACSAC), Dec. 2008.
[24] Vern Paxson. Bro: A System for Detecting Network
Intruders in Real-Time. Computer Networks, 1999.
[25] Suresh N. Chari et al. BlueBox: A policy-driven, host-based
intrusion detection system. ACM Trans. on Information and System Security, 2003.
[26] C. Warrender, S. Forrest, and B. Pearlmutter. Detecting
intrusions using system calls: Alternative data models. In IEEE Symposium on Security and Privacy, 1999.
[27] J. Xu, Z. Kalbarczyk, and R.K. Iyer. Transparent Runtime
Randomization for Security. In Proc 22nd Int’l Symp. Reliable Distributed Systems, 2003.
[28] A. Yaar, A. Perrig, and D. Song. SIFF: A Stateless Internet
Flow Filter to Mitigate DDoS Flooding Attacks. In IEEE Symposium on Security and Privacy, 2004.
[29] X. Yang, D. Wetherall, and T. Anderson. TVA: A
DoS-Limitng Network Architecture. In ACM/IEEE Trans. on Networking (to appear), 2009.