HAL Id: cea-01828507
https://hal-cea.archives-ouvertes.fr/cea-01828507
Submitted on 27 Apr 2020
HAL is a multi-disciplinary open access
archive for the deposit and dissemination of
sci-entific research documents, whether they are
pub-lished or not. The documents may come from
teaching and research institutions in France or
abroad, or from public or private research centers.
L’archive ouverte pluridisciplinaire HAL, est
destinée au dépôt et à la diffusion de documents
scientifiques de niveau recherche, publiés ou non,
émanant des établissements d’enseignement et de
recherche français ou étrangers, des laboratoires
publics ou privés.
Dynamic High Pressure Measurements Using a Fiber
Bragg Grating Probe and an Arrayed Waveguide
Grating Spectrometer
Yohan Barbarin, A. Lefrancois, Sylvain Magne, K. Woirin, F. Sinatti, A.
Osmont, J. Luc
To cite this version:
Yohan Barbarin, A. Lefrancois, Sylvain Magne, K. Woirin, F. Sinatti, et al.. Dynamic High Pressure
Measurements Using a Fiber Bragg Grating Probe and an Arrayed Waveguide Grating Spectrometer.
INTERFEROMETRY XVIII, Aug 2016, San Diego, United States. pp.99600U, �10.1117/12.2236651�.
�cea-01828507�
*[email protected]; phone +33 5 65 10 55 99
Dynamic High Pressure Measurements Using a Fiber Bragg Grating
Probe and an Arrayed Waveguide Grating Spectrometer
Y. Barbarin
a*, A. Lefrançois
a, S. Magne
b, K. Woirin
c, F. Sinatti
a, A. Osmont
aand J. Luc
aa
CEA, DAM, GRAMAT, BP 80200, F-46500 Gramat, France
bCEA, LIST, Laboratoire Capteurs, Architectures Electroniques,
F-91191 Gif-sur-Yvette, France
c
Herakles, groupe SAFRAN, CRB, F-91710 Vert-le-Petit, France
ABSTRACT
High pressure shock profiles are monitored using a long Fiber Bragg Grating (FBG). Such thin probe, with a diameter of typically 150 µm, can be inserted directly into targets for shock plate experiments. The shocked FBG’s portion is stressed under compression, which increases its optical group index and shortens its grating period. Placed along the 2D symmetrical axis of the cylindrical target, the second effect is stronger and the reflected spectrum shifts towards the shorter wavelengths. The dynamic evolution of FBG spectra is recorded with a customized Arrayed Waveguide Grating (AWG) spectrometer covering the C+L band. The AWG provides 40 channels of 200-GHz spacing with a special flat-top design. The output channels are fiber-connected to photoreceivers (bandwidth: DC – 400 MHz or 10 kHz – 2 GHz). The experimental setup was a symmetric impact, completed in a 110-mm diameter single-stage gas gun with Aluminum (6061T6) impactors and targets. The FBG’s central wavelength was 1605 nm to cover the pressure range of 0 – 8 GPa. The FBG was 50-mm long as well as the target’s thickness. The 20-mm thick impactor maintains a shock within the target over a distance of 30 mm. For the impact at 522 m/s, the sustained pressure of 3.6 GPa, which resulted in a Bragg shift of (26.2 ± 1.5) nm, is measured and retrieved with respectively thin-film gauges and the hydrodynamic code Ouranos. The shock sensitivity of the FBG is about 7 nm/GPa, but it decreases with the pressure level. The overall spectra evolution is in good agreement with the numerical simulations.
Keywords: Fiber Bragg Grating, Shock, High pressure, AWG, Spectrometer
1. INTRODUCTION
In the fields of shock and energetic materials, scientists seek for accurate material parameters to feed equations of states (EOS) and to be able to run complex hydrodynamic simulations. In shock experiments or in shock-to-detonation (SDT), the evolution of the pressure level in many material are not well known and thus need to be studied experimentally very close to the ignition and with a minimum intrusivity. Classically, pressure levels are measured electrically in few points with thin-film gauges [1-3]. The pressure gauge’s material can be adapted to cover various ranges: i.e. Carbon 0 – 4 GPa, Manganin 0 – 10 GPa. The response time of such gauge depends on their thickness and can be as fast as 50 ns for the 50-µm thick ones [3]. The main drawbacks of this technique are that pressure gauges are sensible to electromagnetic fields
and that their footprint of few mm2 is relatively intrusive. Their size limits as well the number of points to be measured
in a compact target.
Alternatively, Fiber Bragg Gratings (FBGs) are used for decades to monitor strain at different locations in critical
infrastructures [4-5]. Typically, the FBG’s reflected spectrum shifts as a function of the applied pressure and of the
orientation of the fiber [5]. Interrogators can measure many wavelengths at a few kHz rate, which is more than enough for critical infrastructure monitoring applications. In shock experiments, pressure data need to be acquired at a rate of 100 MHz and higher. FBG remains a good candidate to measure fast and extreme phenomena. Because of its small diameter, the strain can be coupled to the optical fiber with a short response time. The limitation is thus in the fast acquisition of all the spectra. Additionally, FBGs offer continuous measurements over few tens of millimeters and can be considered as non-intrusive. Few groups have explored the use of FBG for dynamic high pressure measurements [6-11]. For instance Rodriguez et al. from Los Alamos presented in 2013 a system with two notched filters to record the wavelength shift [7]. A year later, they showed a 12-channels dynamic spectrometer [8] used in two experimental configurations: a shock in PMMA generated by a gas gun flyer plate and a shock in water provided by a high explosive (HE) with a Copper plate interface. The developed spectrometer covered the wavelength range of 1530.8 – 1550.8 nm
with a resolution of about 1.6 nm. A similar approach was presented by Ravid et al. the same year in [9]. They realized shocks in PMMA material with a 5-channels spectrometer and 1.6-nm resolution too. Other groups worked on an interferometric method to measure the wavelength shift in a short FBG [10-11]. This method, like electrical strain gauges, can only measure pressure levels in single points so a pressure profile cannot be measured directly. However, it has the benefit that the wavelength measurement is not discretized.
In this paper, the dynamic spectrometer is based on a customized 40-channels arrayed waveguide grating (AWG), also known as PHASAR [12]. A long FBG has been especially designed allowing a pressure profile measurement along its length and a wide range of pressure. In the following chapters, the system is presented with experimental results of three symmetric impacts in Aluminum.
2. CONCEPT OF THE MEASUREMENT
The concept of a shock profile measurement using an FBG is illustrated in Figure 1. The chirp of the FBG is intentionally enlarged in order to reflect a wider spectrum. In a chirped FBG (CFBG), a reflected wavelength corresponds to a position in the grating. If the chirp is designed to be linear, the wavelength – position relation is linear. When a shock propagates from the long wavelength side into the CFBG, the width of the channel decreases at the speed of the shock front wave and a new channel appears in the reflected spectrum. The width of this new channel increases in the case of a constant pressure level in the CFBG. More complex pressure profiles along the FBG can be derived from the spectrum evolution records. A ramp for instance will also have the shape of a ramp in the reflected spectrum. When the shock propagates, mostlikely a new wavelength replaces a wavelength which just disappeared in the initial spectrum. The corresponding wavelength shift gives the pressure level at that location and time. For more complex profiles and long measurements, a reverse algorithm will propose a solution with the help of hydrodynamic simulations.
Figure 1. Pressure measurement using a Chirped Fiber Bragg Grating. In the reflected spectrum of the CFBG, a new wavelength replaces a wavelength which disappeared in the initial spectrum. The wavelength shift corresponds to a pressure level at that location of the CFBG.
3. DYNAMIC AWG SPECTROMETER
The dynamic AWG-based spectrometer is illustrated in Figure 2. The optical source is an amplified spontaneous emission (ASE) source covering the C+L band and delivering up to 350 mW of average power. Classically the CFBG is interrogated via a circulator. The wavelengths analysis is done by wavelength filtering with a packaged AWG. The AWG used covers the C+L band with 40 channels centered on the ITU grid. The AWG technology is the planar lightwave circuits (PLC) one with silica material. The channel spacing is 200 GHz (approximately 1.6 nm) and each channel has a flat top transmission [14] to reduce the blind regions between the channels. The transmission losses are below 3 dB for all channels. A picture of a realized chip can be seen in Figure 3. That chip is connected to individual fibers via fiber arrays. As it is a passive chip, photoreceivers are not integrated like in [13], but discrete photoreceivers are connected to the output channels of interest. To limit the number of photoreceivers and acquisition channels, in the following experiments 16 photoreceivers are used. The switch of channels between experiments is simply done by connecting the desired AWG’s output fibers to the photoreceivers. The photoreceivers bandwidth were DC – 400 MHz for the 3 first channels and 10 kHz – 2 GHz for the 13 others.
Figure 2. Dynamic AWG-based spectrometer setup.
Figure 3. Picture of the AWG chip before packaging (VLC Photonics)
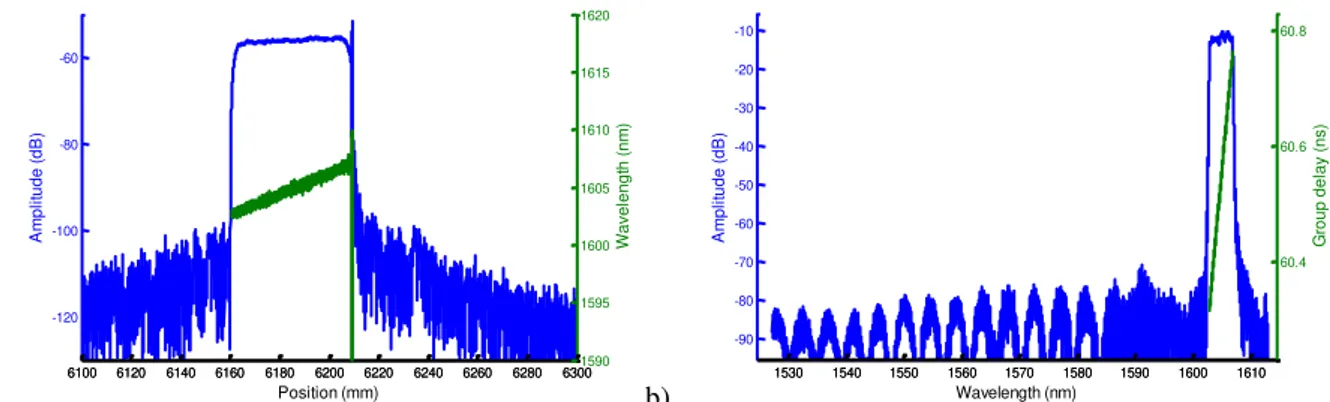
For the experiments, special CFBGs were purchased. The length of the grating was increased to 50 mm to get a profile of the shock transmitted to the grating. The central wavelength was shifted near the end of the L-band at 1605 nm. As a “blue shift” is expected during the shock, the pressure range that the system could record is 0 – 8 GPa. The spectral width of the grating was increased to 4 nm to localize the shock-wave, like in detonation velocity measurements [7,15]. The complete characterization of a CFBG with an optical backscatter reflectometer (OBR) is plotted in Figure 4.
a) b)
Figure 4. Characterization of a CFBG used in a shock experiment with an OBR (model LUNA 4600). In a) is the reflectivity as function of the position with on the second vertical axis the wavelength. In b) is the optical spectrum and group delay. The physical length is 47 mm, the central wavelength 1605 nm and the spectral width 4 nm.
4. EXPERIMENTAL SETUP AND RESULTS
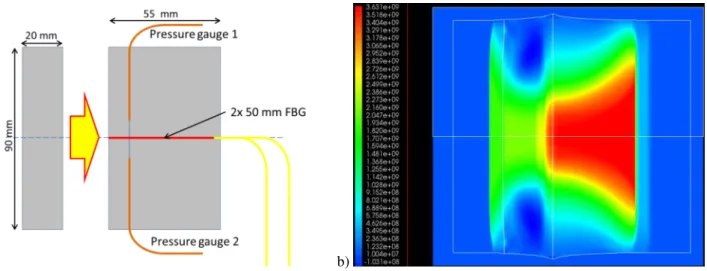
The experimental setup is a symmetric impact with 6061T6 Aluminum impactor and target performed with a 110-mm in diameter single-stage gas gun. The dimension of the components (Figure 5.a) were designed with the 2D configuration of the hydrodynamic code Ouranos. The impactor’s and target’s diameters were set to 90 mm, the impactor thickness to 20 mm and target to 55 mm. According to our numerical simulations, the pressure level is maintained nearly over
6100 6120 6140 6160 6180 6200 6220 6240 6260 6280 6300 -120 -100 -80 -60 A m p li tu d e ( d B ) Position (mm) 6100 6120 6140 6160 6180 6200 6220 6240 6260 6280 63001590 1595 1600 1605 1610 1615 1620 W a ve le n g th ( n m ) 1530 1540 1550 1560 1570 1580 1590 1600 1610 -90 -80 -70 -60 -50 -40 -30 -20 -10 A m p li tu d e ( d B ) Wavelength (nm) 1530 1540 1550 1560 1570 1580 1590 1600 1610 60.4 60.6 60.8 G ro u p d e la y (n s)
30 mm. This is illustrated in Figure 5.b for an impact at 500 m/s. The shock in the impactor goes backward, but it is then reflected at the back side. As a consequence, the main shock vanishes from the back. A similar effect exists laterally due to the shock reflections at the outer sides. In the center of the target, a hole of 0.4 mm was drilled to insert and glue the FBG as close as possible from the shocked material. Two thin-film gauges measure the pressure close to the center and 10 mm away from the impacted surface.
a) b)
Figure 5. a) Scheme of the experimental setup, b) 2D hydrodynamic simulation of the shock in 6061T6 Aluminum at 500 m/s for t = 6.0 µs.
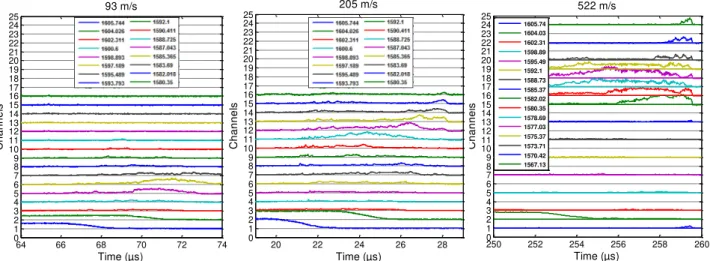
Three experiments are presented here for impacts at 93, 205 and 522 m/s. For the first two experiments, the 16 first channels of the AWG were connected to the photoreceivers. For the third experiments, the 3 first channels were connected, then every two channels and finally the region of interest between 1573.7 nm and 1582.0 nm. The experimental results are plotted in Figure 6 and are summarized in Table 1. When the shock propagates into the CFBG, the 3 first channels’ intensities decrease one after the others and new signals appears at other wavelengths. With an impact at 93 m/s, a shock level of 0.63 GPa was measured by pressure gauges. The two channels at 1598.9 nm and 1597.2 nm got most of the signals, it corresponds to a wavelength shift of 6.8 nm. In the second experiment at 205 m/s, the channel at 1588.7 nm gets the strongest signal, it corresponds to a wavelength shift of 15.3 nm for a shock level of 1.6 GPa. Here we can notice that at t = 25 µs, lower wavelengths get more and more signals, this is due to the fact that the shock level decrease gradually from the back. In the third experiment at 522 m/s, the channel at 1577.0 nm gets first most of the signal. The neighboring channels gets also signals, because the FBG is slight chirped (4 nm wide). It corresponds to a wavelength shift of 26.2 nm for a shock level of 3.6 GPa, measured by pressure gauges. Like in the previous experiments, one can deduce the shock profile with a flat region and a down-slope at the back of the shock. This is not totally trivial, but also predicted by hydrodynamic simulations. When the shock reaches the end of the target, the signals in the lower wavelengths are not totally explained yet.
Even with 3 measurement points presented here, it appears that the wavelength shift is not linear with the pressure levels measured by pressure gauges. The slope tends to decrease with the pressure. The explanation seems to be related to the target and fiber material elastoplastic and EOS properties. The coupling of the shock from the Aluminum to the Silica is a complex phenomenon that we are currently investigating experimentally and by 2D hydrodynamic simulations. We are developing a dedicated model for an operational reverse algorithm [16].
Figure 6. Normalized signals at different wavelengths as a function of time for shock at 93, 205 and 522 m/s.
Table 1. Summary of the experiments.
Impact velocities
Pressure gauges
Measurement values FBG wavelength shifts
93.0 ± 2.5 m/s 0.63 ± 0.02 GPa 6.8 ± 1.0 nm
205 ± 5 m/s 1.57 ± 0.08 GPa 15.3 ± 1.0 nm
522 ± 13 m/s 3.60 ± 0.40 GPa 26.2 ± 1.5 nm
5. CONCLUSIONS AND OUTLOOK
Dynamic measurements of spectra were performed using long chirped fiber Bragg gratings and an AWG chip. Three symmetric impacts with Aluminum (6061T6) were realized in a 110-mm single-stage gas gun for the validation of the system. The customized 40-channels AWG allows analyzing spectra in the C+L band with low optical losses at the speed of the photoreceivers. By using a chirped FBG, the shock-wave can be followed and located along the length of the grating. From the evolution of the spectra, a pressure profile along the 50-mm long CFBG could theoretically be extracted. Experiments showed however that the wavelength shift is not linear with the measured pressure levels in the range of 0.6 and 3.6 GPa: its slope decreases with the pressure. A dedicated model needs to be developed to explain this trend. For more accuracy, the actual resolution of 1.6 nm would need to be further improved. An AWG with 160 channels and 50-GHz channel spacing (~0.4 nm) could maybe be realized but then these 160 channels would need to be recorded at a rate of 100 MHz or higher, which makes the system more and more bulky. We are currently investigating another type of dynamic spectrometer based on wavelength to time multiplexing [17]. The measurement is done with a single high bandwidth photoreceiver and the resolution can be as low as 0.12 nm over a 40-nm range.
REFERENCES
[1] Rosenberg, Z., Yaziv, D. & Patrom, Y. “Calibration of foil-like manganin gauges in planar shock wave
experiments” J. Appl. Phys. Vol. 51, pp. 3702-3705 (1980)
[2] Duan, Z., Liu, Y., Pi, A. & Huang, F. “Foil-like manganin gauges for dynamics high pressure measurements” Meas.
Sci. Tech. vol. 22, pp. 1-5 (2011)
64 66 68 70 72 74 0 1 2 3 4 5 6 7 8 9 10 11 12 13 14 15 16 17 18 19 20 21 22 23 24 25 93 m/s Time (µs) C h a n n e ls 20 22 24 26 28 0 1 2 3 4 5 6 7 8 9 10 11 12 13 14 15 16 17 18 19 20 21 22 23 24 25 205 m/s Time (µs) C h a n n e ls 250 252 254 256 258 260 0 1 2 3 4 5 6 7 8 9 10 11 12 13 14 15 16 17 18 19 20 21 22 23 24 25 522 m/s Time (µs) C h a n n e ls 1605.74 1604.03 1602.31 1598.89 1595.49 1592.1 1588.73 1585.37 1582.02 1580.35 1578.69 1577.03 1575.37 1573.71 1570.42 1567.13
[3] Lefrancois A., Bouton E., Jacquet L., Chuzeville V., Peix J., Luc J., Baudin G., Genetier M., Mateille P., Zaniolo G.,
Osmont A., Debruyne M., “Low Amplitude Shock Initiation Experiments on TATB Based Composition Tested
With Inverse Particle Velocity”, Proc. Europyro (2015)
[4] Ferdinand P., Magne S., Marty V., Rougeault S., Bernage P., et al. "Optical fibre Bragg grating sensors for structure monitoring within th nuclear power plants", Proc. SPIE 2425, Optical Fibre Sensing and Systems in Nuclear Environments, 11 (1994)
[5] Udd E., “25 years of structural monitoring using fiber optic sensors” Proc. SPIE 7982, Smart Sensor Phenomena,
Technology, Networks, and Systems, 79820F, (2011)
[6] MacPherson W.N., Gander M.J., Barton J.S., Jones J.D.C, Owen C.L., Watson A.J., Allen R.M., “Blast-pressure
measurement with a high-bandwidth fibre optic pressure sensor” Meas. Sci. Technol. 11 pp. 95-102, (2000)
[7] Rodriguez G., Sandberg R.L., Jackson S.I., Dattelbaum D.M., Vincent S.W., McCulloch Q., Martinez R.M. Gilbertson S.M. and Udd. E., “Fiber bragg grating sensing of detonation and shock experiments at Los Alamos National Laboratory”, Proc. SPIE 8722, 872204, (2013)
[8] Sandberg R.L., Rodriguez G., Gibson L.L., Dattelbaum D.M., Stevens G.D., Grover M., Lalone B.M., Udd. E., “Embedded Optical Probes for simultaneous pressure and temperature measurements of materials in extreme conditions” Journal of Physics: Conference Series 500, 142031, (2014)
[9] Ravid A., Shafir E., Zilberman S., Berkovic G., Glam B., Appelbaum G. Fedotov Gefen A. “Fibre Bragg Grating
sensor for shock wave diagnostics” Journal of Physics: Conference Series 500, 142029, (2014)
[10] Van’t Hof P.G., Cheng L.K., Scholtes J.H.G, Prinse W.C., “Dynamic pressure measurement of shock waves in
explosives by means of a fiber Bragg grating sensor” Proc. SPIE 6279, 62791Y-1, (2007)
[11] Deng X., Chen G., Peng Q., Li Z., Meng J., “Research on the fiber grating sensor for the shock stress measurement”
Rev. Sci. Instrum. 82, 103109 (2011)
[12] Smit M.K., Van Dam C., “PHASAR-based WDM-devices: Principles, design and applications” IEEE Journal of
Selected Topics in Quantum Electronics, 2 (1996)
[13] Sano Y. and Yoshino T. “Fast optical wavelength interrogator employing Arrayed Waveguide Grating for
distributed fiber Bragg grating sensors” Journal of Lightwave Technology, Vol. 21, No. 1, pp. 132-139, (2003)
[14] Muñoz P., Pastor D., and Capmany J. “Analysis and design of arrayed waveguide gratings with MMI couplers”
Optics Express Vol. 9, Issue 7, pp. 328-338 (2001)
[15] Barbarin Y., Lefrançois A., Zaniolo G., Chuzeville V., Jacquet L., Magne S., Luc J., Osmont A. “Optimization of
detonation velocity measurements using a chirped fiber Bragg grating”, Proc. SPIE 9480, Fiber Optic Sensors and Applications XII, 94800S (2015)
[16] Chenga H.-C., Lo Y.-L. “Arbitrary strain distribution measurement using a genetic algorithm approach and two fiber
Bragg grating intensity spectra” Optics Communications, Vol. 239, Issues 4–6, pp. 323–332, (2014)
[17] Rodriguez G., Jaime M., Mielke C.H., Balakiev F.F., Azad A., Sandberg R.L., Marshall B., La Lone B.M., Henson B.F., Smilowitz L., Marr-Lyon M. and Sandoval T., “Insight into fiber Bragg sensor response at 100 MHz interrogation rates under various dynamic loading conditions”, Proc. SPIE 9480, 948004, (2015)