HAL Id: cea-02438698
https://hal-cea.archives-ouvertes.fr/cea-02438698
Submitted on 27 Feb 2020HAL is a multi-disciplinary open access archive for the deposit and dissemination of sci-entific research documents, whether they are pub-lished or not. The documents may come from teaching and research institutions in France or abroad, or from public or private research centers.
L’archive ouverte pluridisciplinaire HAL, est destinée au dépôt et à la diffusion de documents scientifiques de niveau recherche, publiés ou non, émanant des établissements d’enseignement et de recherche français ou étrangers, des laboratoires publics ou privés.
safety
C. Berge Thierry, F. Wang, C. Feau, I. Zentner, F. Voldoire, F.
Lopez-Caballero, A. Le Maoult, M. Nicolas, F. Ragueneau
To cite this version:
C. Berge Thierry, F. Wang, C. Feau, I. Zentner, F. Voldoire, et al.. The sinaps french research project first lessons of an integrated seismic risk assessment for nuclear plants safety. 16th World Conference on Earthquake - 16WCEE 2017, Jan 2017, Santiago, Chile. Paper N° 3553. �cea-02438698�
Registration Code: S-S1459859599
THE SINAPS@ FRENCH RESEARCH PROJECT: FIRST LESSONS OF AN INTEGRATED
SEISMIC RISK ASSESSMENT FOR NUCLEAR PLANTS SAFETY
C. Berge-Thierry(1), F. Wang(2), C. Feau(2), I. Zentner(3), F. Voldoire(3), F. Lopez-Caballero(4), A. Le Maoult(2), M.
Nicolas(2) and F. Ragueneau(5)
(1) Coordinator of SINAPS@ project, French Atomic Commission, Université Paris-Saclay, France, catherine.berge-thierry@cea.fr
(2) Researcher & Engineer, French Atomic Commission, France, fan.wang@cea.fr, cyril.feau@cea.fr,
alain.lemaoult@cea.fr,marc.nicolas@cea.fr,
(3)Researcher & Engineer, EDF (R&D), France, irmela.zentner@edf.fr, francois.voldoire@edf.f (4) Researcher, CentraleSupelec, France, fernando.lopez-caballero@centralesupelec.fr
(5) Professor, Ecole Normale Supérieure de Cachan, France, frederic.ragueneau@lmt.ens-cachan.fr
Abstract
Whatever the level of seismicity of a country, the seismic risk has to be assessed and accounted in the frame of nuclear plant safety, from its design, during its operational as well as dismantling phases. The seismic risk assessment combines the seismic hazard and the seismic vulnerability of the civil engineering and equipment estimates. Acceptable methods to perform seismic risk analyses are guided by international references, such as the Safety Guides and Requirements published by the International Atomic Energy Agency (IAEA) but also by national documents. The current methodologies used in France to assess the seismic hazard are firstly the scenario-based approach proposed in the French Fundamental Safety Rule (RFS 2001-01), and secondly the ASN/2/01 Guide providing design rules of nuclear civil engineering structures. These references were respectively updated by the Nuclear Safety Authority in 2001 and 2006. Since then, the 2011 Tohoku earthquake that triggered a huge tsunami caused the severe accident at the Fukushima Daïchi nuclear plant. The analysis of the observations demonstrated that the seismic and tsunami hazards were underestimated for this region. Consequently worldwide nuclear operators were asked by their authority to perform “stress tests” to estimate their plant capacity sustaining extreme seismic loadings. In this framework, an 5 years research project called SINAPS@ (Earthquake and Nuclear Installations: Ensuring and Sustaining Safety) is on-going in France. SINAPS@ brings together a multidisciplinary community of researchers and engineers, funding also 12 Ph.D. and 19 post-doctoral researchers. SINAPS@ aims at conducting a continuous analysis of completeness and gaps in data bases (all data types, from geology, seismology, site characterization and materials), of the reliability or deficiency of models available to describe physical phenomena (prediction of seismic motion, site effects, soil and structure interaction, linear and nonlinear wave propagation, materials constitutive laws in nonlinear domain), and of the relevance or weakness of methodologies used to performed seismic risk assessment. This critical analysis conducted confronting methods, either deterministic or probabilistic, and available data to the international state of the art systematically addresses the uncertainties issue, should improve the seismic margins assessment. The present contribution will expose the first lessons learned from SINAPS@ few 18 months before its end.
Keywords: seismic risk analysis, uncertainties, seismic margin, nuclear safety.
1. Introduction
In the framework of the March 2011 Fukushima nuclear accident, the French Government published a call with 50 M€ to stimulate research in the field of nuclear safety and radiation protection.
In this context, 13 French teams built an research project called SINAPS@ (Earthquake and Nuclear Facilities: Improving and Sustaining Safety). SINAPS@ aims to explore the uncertainties in databases, knowledge of the physical processes and methods used at each step of the evaluation of the seismic hazard and the vulnerability of structures and nuclear components, in the context of a safety approach: the main objective is to identify or quantify the seismic margins resulting from assumptions or when selecting the level of seismic design, i.e. taking into account the uncertainties in the conservative choice, or design strategy (conservative assumptions, choice of materials, …). SINAPS@ is coordinated by French Atomic Energy Commission, which is a research organization, but also an operator responsible for many nuclear research facilities. SINAPS@ partnership brings together a multidisciplinary community of scientists and engineers from academic teams and organizations involved in nuclear activities (designer, operator, or providing technical support to the regulator). The project partners are the Commissariat à l’Energie Atomique , Electricité de France, the Ecole Normale Supérieure de Cachan, CentraleSupelec, the Institute for Radiological Protection and Nuclear Safety, the Soil-Solids-Structures and Risks Laboratory (Institut Polytechnique Grenoble), the Ecole Centrale de Nantes, EGIS – industry, AREVA, ISTerre, IFSTTAR and CEREMA.
In 2013, SINAPS@ was selected by the French Government. This 5-year project, with a full cost of more than 12.5M€ whose 5M€ supported by the national program. In particular SINAPS@ funds 12 Ph.D. theses and 19 post-doctoral positions. SINAPS@ stands as the first research project in France, where the seismic risk is fully evaluated from the fault of the engineering structure and equipment, with an emphasis on the propagation of uncertainties at each step of the seismic analysis (e.g., including the free field seismic hazard, the nonlinear site effects and soil-structure interactions, the transfer of the seismic motion from the ground to the foundations and to the building and components).
SINAPS@ has been presented during the Structural Mechanics in Reactor Technology conference, Manchester in August 2015. A detailed presentation of the nuclear context and on the project goals is given in the associated article [1]. To avoid redundancy, the readers are invited to consult this previous reference to complete their information regarding the motivations and the scope covered by SINAPS@.
The objectives of this paper are (i) to remind the need to assess potential seismic margins of nuclear facilities, (ii) to briefly present the global scientific structure of the project and (iii) to illustrate, through Soil-Structure Interaction and fragility curves assessments example, the key role of all the interfaces (“control point” notion) in the seismic risk analysis.
2. Seismic Margins Assessment of Nuclear Facilities
2.1 Nuclear Plants, seismic events exposure and safety management
As of April 18, 2016 the International Atomic Energy Agency records 444 Nuclear Power Plants (NPPs) currently in operation worldwide, and 64 under construction. These plants are located in 31 countries with an installed electric net capacity of about 386 GW for those in operation and with an expected capacity of 63 GW corresponding to nuclear plants still under construction (source IAEA).
Fig. 1 – (Left) NPPs location worldwide (NPP data from IAEA, Feb 2016) toward global seismicity distribution (USGS catalog, magnitude >4.5 events), http://maptd.com/map/earthquake_activity_vs_nuclear_power_plants/. (Right) French Nuclear plants toward the seismic zonation mandatory for conventional buildings (not for NPs).
Figure 1 (left) presents the NPPs worldwide with respect to the global seismicity recorded since 1973. At the Earth scale, most of the seismic energy is released by the subduction zones. These zones are related to active tectonic features, enabling to generate “mega- earthquakes”, such as the 1960 Chili Earthquake (the biggest event ever recorded – Magnitude 9,5), and recently the Tohoku, March 2011, with a magnitude of 9.
When focusing on the French metropolitan territory, one goes to a “moderate to low” seismic context, with respect to more active ones such as Italy, Greece and Turkey in Euro-Mediterranean area. France has currently 58 nuclear power reactors distributed on 19 sites, producing more than 76% of the total electrical production in 2015 (source IAEA). In addition to these NPPs, 117 nuclear facilities (NPs) are related to the nuclear industry (fuel cycle, wastes surface repositories …) or devoted to research (source http://www.asn.fr/Reglementer/Bulletin-officiel-de-l-ASN/Decisions-de-l-ASN/Decision-n-2016-DC-0538-de-l-ASN-du-21-janvier-2016). Even exposed to rare and moderate earthquakes, the French metropolitan territory is highly concerned by the seismic risk management, due to its numerous nuclear plants, but also many other sensitive facilities such as chemical ones. Figure 1 (right) presents the location of the NPs with respect to the seismic zonation currently in force in France for conventional buildings only: this zonation is based on a Probabilistic Seismic Hazard Assessment performed in the 2000’s for a 475 years return period. In France, in the frame of the nuclear safety, the seismic hazard is assesed following a fully deterministic approach (called the “Fundamental Safety Rule”, RFS originally proposed in 1981 and revised in 2001, see reference [2]). After the Fukushima accident, the French Nuclear Safety Authority asked all nuclear operators to perform probabilistic seismic hazard assessments (PSHA), and finally published in 2015 decisions in which extreme seismic levels (above “classical” assumptions used during the design and re-assessment of the plant) were defined as covering the deterministic level increased by a factor of 1,5 and a probabilistic hazard at 20 000 years of return period. Currently such PSHA studies have been performed by operators at a site-scale, and there is no national map for such high return periods.
2.2 Seismic Margin Assessment
All along the life of any nuclear plant, operator has to demonstrate its safety against external and internal events, and obviously has to prove the resistant capacity of the NPs against earthquakes. In France, as the nuclear program started in the 1970’s, the operators have to manage plants ageing from almost 40 years to quite new ones.
In France the regulator requires to fully investigate each NP is every 10 years, through the safety re-assessment: during this process, the plant has to be tested against all agression types. Seismic sollicitations are evaluated considering the best knowledge state and the regulation in force: this latter point significates that the seismic loads defined to check the plant are deduced from a seismic hazard study performed n*10 years after the plant construction. In practice, and due to huge improvements of knowledge in the seismological field, the
re-assessed seismic hazard is often different from the one considered at the design stage of the plant: and more practically, as phenomena producing severe effects on the strong ground motions have been quite recently identified (such as the amplification effects of loose soils, recognized after the 1985 Mexico earthquake), they are now integrated into the seismic hazard assessment and conduct most of the time to increase the hazard. Then, for the re-assessment of the existing plant, the operator has to check if it is able to sustain the new assumptions of seismic loads, and to characterize the seismic behaviour of the structures and equipement that are important for the safety. This is typically a “seismic margin assessment” (SMA), which consists in checking all the assumptions, enforcing state of the art methods, modelling and simulations in order to predict the plant seismic response. During this SMA, the seismic analysis is conducting accounting for the physical phenomena through advanced numerical tools. The aim is to provide the more representative and realistic seismic response of the plant, avoiding if possible standard and simplified approaches (that often used during the design phases) that lead to sometimes introduce conservatisms, in order to reconstruct and justify realistic seismic safety margins. Key issues of SMA reability remain (i) to consider and integrate in the seismic analysis the uncertainties associated to data and applied methods, and (ii) to conduct sensitivity studies on key parameters or assumptions. Needless to precise that these uncertainties investigation obviously should be performed on the whole path of the seismic risk assessment, on the hazard part, on the vulnerability part and finally on the fragility estimate (supposing the definition of performance requirements and associated failure criteria). This approach is clearly the philosophy followed in SINAPS@, with the necessity to account for “rare and extreme earthquakes” never considered until now, until Post-Fukushima studies. Finally the SMA process usually results into either (i) a positive margin factor meaning that the structural (or equipement) is enable to sustain the target seismic loads respecting the safety objectives either (ii) a negative factor which would indicate the failure of the considered element. In this latter case, it should lead to reinforce the plant to increase its seismic capacity (if technically feasible and economically viable).
3.
SINAPS@ project: scientific structure and content
A detailed and exhaustive presentation of SINAPS@ objectives and organization is given in [1]. In this paragraph we briefly remind the scientific structure of the project and associated goals.
Built in the framework of the Post-Fukushima accident and the French Complementary Safety Studies, the SINAPS@ project mainly aims to improve the seismic margin assessment of existing nuclear plants, highlighting the key steps, parameters and/or assumptions that play major role (e.g. impacting the reability of the result). Developing SMA requires the exploration of epistemic and aleatoric uncertainties associated to data, knowledge of the physical processes and methods that are used at each stage of the seismic hazard and seismic vulnerability of structures and components assessment. In a nuclear safety approach, these uncertainties are quantified, eventually weighted, and propagated into the seismic analysis enabling finally to assess failure probabilities of structures and/or components important for the plant safety.
SINAPS @ is structured around five “work packages (WP)” that strongly interact (i) WP 1, "Seismic Hazard", (ii) WP 2, "Non Linear interaction between near and far seismic field, soil and structures", (iii) WP 3, " Behavior of structures and equipment’s to seismic loading, seismic isolation and reinforcement processes ", and (iv) WP 4, devoted to the "Seismic Risk Assessment" and aiming to integrate the first 3 WP’s findings. These four WP’s are mainly based on empirical and numerical approaches. WP 5 is based on the experimental laboratory approach, addressing issues for which the lack of knowledge (databases poverty and/or lack of feedback) and/or whose resolution by conventional simulation approaches remains too uncertain. WP 5 will conduct seismic tests (dynamic, real time), using the experimental platform Tamaris CEA-Saclay including the 6 degrees of freedom Azalee shaking table (http://www-tamaris.cea.fr/). These tests will focus on complex physical phenomena during the earthquake, some being important for the identification and quantification of seismic margins (i.e. nonlinear behavior of materials, energy dissipation by damping etc). Within SINAPS @ project, tests involving interaction between buildings are planned (BBI).
A last WP 6 aims to promote knowledge related to the seismic risk for the safety of nuclear plants, to a large panel (one session for students and young researchers in June 2016 and a second one for researchers and people from earthquake engineering community in 2017). This second session will be elaborated with the
International Seismic Safety Center of the International Atomic Energy Agency ( http://www-ns.iaea.org/tech-areas/seismic-safety/) to share and get the state of art of international experience and feedback.
The project covers all scientific fields from hazard to the response of the structure (WP 1-3) and seismic risk assessment (WP 4), but also focuses on interfaces between these topics (see Figure 3). Indeed, the output of a WP is the input data of the next WP, and some issues concern several WP’s (e.g. geotechnical "nature" and geological characteristics of the site clearly impact both WP 1 and 2). It is therefore essential to check the consistency of assumptions, approaches used to address this problem in the different work packages: so it will be important to verify that the same parameter uncertainties are not taken into account several times. Working on these interfaces is therefore to force the dialogue between scientific communities, geology, seismology on the one hand and earthquake engineering on the other. The WP 4 appears as the implementation of a specific case-study for the whole seismic risk assessment, integrating information and tools promoted by WP 1-3. The objective of seismic margins quantification will be accessible only after the exploration of a continuous and complete risk assessment, and a dialogue between all stakeholders.
Readers are invited to consult the reference [1] to catch the details and scientific goals of each WP. Moreover, once a year, scientific presentations are delivered during a plenary session involving SINAPS@ monitoring committee: proceedings of 2014 and 2015 sessions are available ([5] and [6]), giving a broad illustration of the performed research.
Fig. 3 – SINAPS@ work packages structure: towards an integrated approach of seismic risk analysis from fault to structures and components propagating the uncertainties.
4. On the need to check the consistency on seismic motion treatment on the whole seismic
risk analysis
4.1. Introduction
In this paragraph we illustrate, on a specific example, how the assumptions at each step of the seismic risk analysis need to be carefully checked, their uncertainties also quantified, in order to have any confidence in the final result. Referring to Figure 3 above, the “exercise” will cover 2 main interfaces of the seismic risk analysis:
1. the interface between the seismic hazard assessment (SHA) - WP 1 in SINAPS@ - and the nonlinear Soil-Structure analysis (included in the WP 2): indeed the seismic loads assumptions are defined by engineers from the SHA outputs (with respect to regulations in force, e.g. in France, the RFS 2001-01 for the SHA [2], and the Guide ASN/2/01 [3] presenting acceptable methods for structural and equipment design),
2. and the interface between the WP 2 which provides the structural (or equipements) seismic response to the WP 4 where the resistance capacity of the system is assessed through fragility curves.
From this exercise, we will comment on some limitations using classical approaches especially considering seismic loadings produced by large events (e.g. where the soil non linearity is clearly engaged).
4.2. Framework of the exercise: the WP 4 Karisma demonstrative case
This work takes place in the frame of the SINAPS@ WP 4 “demonstrative case” (DC), presented in detail in [1]. In short, this DC (already considered for the benchmark organized by the IAEA in 2010, see reference [7] IAEA 2013) is based on the Kashiwazaki-Kariwa NPP which suffered July 16, 2007 a Magnitude 6,6 earthquake (NCOE) located near the site (epicentral distance 16 km): a rich set of data throughout the analysis chain is available, representing an interesting experience feedback.
The purpose of the WP4 demonstrative study is to implement and evaluate the methodology leveraging various contributions of SINAPS@ project at each step of the seismic analysis on a concrete case of nuclear plant, identifying phenomena contributing to a "best-estimate" response, enabling to comment and prioritize sources of potential margins, from the fault to probabilistic floor spectra. The ingredients are the following (i) seismic loading hypothesis coming from seismologists of WP1, (ii) numerical methods to compute nonlinear soil-structure interaction (SSI), specific analysis on nonlinear site-effects, and finally coupling SSI and site effects with structural seismic behaviour numerical simulation, with a strong interaction with WP2, (iii) however, due to the specific design of Kashiwazaki-Kariwa NPP Unit 7 and the specific seismic event in view, unlike SSI and site effect ingredients, the need of nonlinear reinforced concrete structural predicting constitutive models, provided by WP3, is not crucial: indeed very few cracking was observed, and elastic modelling seems to be sufficient in a first approach, (iv) expertise on methods used to predict the seismic motion transferred from structure up to equipment, (v) methods used to propagate and hierarchize the uncertainties within the vulnerability and probabilistic risk assessment analysis.
4.3. Nonlinear soil-structure interaction computations and fragility curves predictions
This section reports the work performed by the CEA team in the inital phase of the SINAPS@ WP 4 DC task. As one of the participants to the international KARISMA Benchmark [7], CEA has conducted a soil-structure interaction analysis on the Unit 7 Reactor Building (RB7) of the Kashiwazaki-Kariwa NPP. A large 3D finite element model including the Reactor Building and the nearby soil was used to simulate the structural response under the NCOE earthquake of July 2007. A full description of the work performed by CEA is avalaible through [8] which in particular presented successfull results in the prediction of the RB response including nonlinear SSI under extreme loads, allowing to quantify seismic margins.
In the current framework of SINAPS@, the work focuses on the uncertainty propagation through the soil-structure system. The objective is to construct the fragility curve of some selected plant equipment due to the variability of the input seismic signals. For this purpose, a simplified model representing the largely embedded reactor building must be implemented for computation efficiency. The soil nonlinearity caused by each seismic signal is taken into account using the equivalent linear method (which is classically used in NPs studies, and recommended in the Guide ASN/2/01 [3]). In this section we mainly (i) emphazise the key role of the “control point”, which is the reference location where the seismic input is first considered before performing the nonlinear SSI computation (in France, this reference seismic input is always defined at the free field of the plant, [2] and [3]), (ii) and illustrate the impact of this last assumption on the predicted fragility curves.
Geological context and model description
Figure 4 summarizes the simplified geometrical configuration considered in this section (see [1] to get more details). The KK Unit 7 Reactor Building (RB7) is embedded in a soil with very low shear wave velocity (Vs30=
250 m/s) near the surface. The bedrock is found at 167 m in depth, with Vs30=720 m/s. Full geotechnical
Fig. 4 – Simplified scheme of the KK SINAPS@ DC. The RB7 is embedded over 25 m. Beneath the soil the bedrock is found at ~167 m in depth. Stars indicate location of different “control points”.
Reactor Building Model
A stick model (Figure 5) for the Reactor Building RB7, used by TEPCO [12], the owner of the power plant has been adopted and implemented in the Code CAST3M [9] for this work. This is a very simple model but it can describe two interesting features of the building: the first one is the embedment (25 m over a total height of 63.4
m) and the second is the flexibility of the soil-structure interface. Computations are performed in the linear
domain for the structure.
XZ section Stick model
Fig. 5 – (Left) Cross section of the Unit 7 Reactor Building. (Right) RB7 stick model [12]
Computation case 1
In this case, the control point is the star 1 in the Figure 4, at the ground surface on soft soil condition (Vs30=250
m/s). Considering the NCOE 2007 scenario (Mw=6,6 and epicentral distance of 16 km), 50 synthetic ground
motions have been generated [10] whose mean response spectrum fits the target scenario spectrum assessed using the Campbell and Bozorgnia (CB), 2008 empirical ground motion prediction equation (GMPE) [11]. To increase the seismic inputs number (hope to reach the failure criterion in the fragilty study), and to cover strong motions, the “classical engineering scaling” process is applied on the set (with factors of 0,5, 1, 2, 2.5 and 3). Figure 6 presents the initial 50 strong motions set.
Fig. 6 – 50 synthetic ground motion response spectra (5% damping, left NS component, right EW) at the ground surface. The blue line is the mean response of the 50 ones, and dotted curves are the mean (+/-) one standard deviation. These spectra fit the NCOE event scenario at KK following Campbell and Bozorgnia 2008 GMPE.
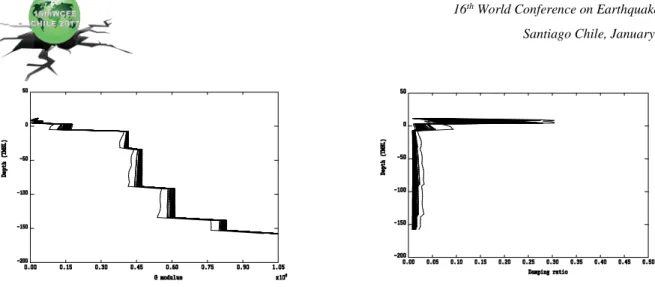
In case 1, as the ground motions were generated at the control point 1, the first step of the SSI computation is to perform a deconvolution down to the bedrock (-167m) and the motion is assessed at 25 m in depth (embedment fundations level, control point 3). To account for the nonlinear soil behavior, a linear equivalent approach is used (similar to that used for the original KK benchmark): for each seismic input of the 250 strong motions (amplification factors of 0.5, 1, 2, 2.5 and 3 on initial 50 data), an iterative procedure is applied assessing the equivalent soil column properties (through the shear strain, G modulus reduction, damping ratio). In this process, the frequency content over 15 Hz was filtered because the GMPE response spectrum used tends to be wide band which doesn’t reflect the reality of the site as can be seen in Figure 7 showing the free-field recordings during the NCOE mainshock. Finally the seismic input at the reactor basement is obtained for every input signal, if the process converges. Figure 8 illustrates the equivalent soil profiles for the 50 initial input signals.
Fig. 7 – Recorded horizontal accelerations during the 2007 NCO Earthquake (Station 5G1, free field ground surface near RB7) and their normalized Response Spectra @ 5% (blue curves) versus the normalized medians of
the synthetic ground motions Response Spectra @ 5% (red curves).
When the deconvolution process converged, the RB7 response is assessed using the stick model described above. For each input signal, all the soil springs are re-calculated using Novak method based on the equivalent linear soil model determined by soil column deconvolution. The response of the structure to each ground motion is finally obtained by modal superposition method. From this case 1, we then get the “RB7 – responses set 1”.
Fig. 8 – Equivalent soil profiles for the 50 synthetic seismic inputs.
A significant number of seismic signals (among them, especially those coming from the “scaling process” with factors 2, 2.5 and 3) produced “divergence” in the linear equivalent deconvolution approach, highlighting the problem related to the use of the method above its own limitations (usually 0.1% shear strain, threshold also reommended in [3]) to a soil site which is highly nonlinear in such acceleration domains. In the following, we consider deconvolution results only if the maximal soil shear strain does not exceed 0,8% (as done in the IAEA Karisma benchmark).
Computation case 2
The global methodology developed in case 1 is applied, but now the intial 50 seismic signals are generated at the control point 2, at the ground surface for a bedrock site condition (outcropping bedrock, Vs30=720 m/s) in order
to avoid the “soil non linearity” phenomenon, still fitting the CB2008 [11] GMPE prediction. The same scaling process is also applied however these signals have not been filtered as previously. Figure 9 presents the seismic motions re-assessed at the RB7 basement, after the deconvolution (using the 50 initial synthetics). Using the amplified inputs and after deconvoluated them, a “RB7 – responses set 2” is available. In the left figure, a large amplitude appears for one of the signal and its spectrum shape diverges before 15 Hz, exhibiting the deconvolution “failure” with such a nonlinear soil using linear equivalent method. In Figure 10 right, generating the initial seismic input at the outcropping bedrock ensures the stability of the deconvolution.
Deconvolution from control point 1 (Surface, soft soil) – set 1 Deconvolution from control point 2 (Outcropping bedrock) – set 2
Fig. 9 – Seismic input response (RB basement level) spectra (5% damping) after deconvolution from surface to 25m in depth, by linear equivalent approach: (Left) Initial signals generated for soft soil, (Right) Initial signals
Fragility curves assessment
In the frame of SINAPS@ WP 4, the assessment of fragility requires to define a structure or equipment of interest. Here, no specific equipment is chosen, only its resonance frequency is postulated at 4 Hz: the failure criterion is the exceedance of its 5% damped pseudo acceleration response at 4 Hz of a level of acceleration; this is supposed unknown, and will be explored during the study. Working with the “RB7 – responses sets 1 and 2”, RB basement motions are transmitted to the considered equipment. Figure 10 presents in ordinates the PSA values corresponding to seismic inputs from set 1 (triangles) and to set 2 (circles) as function of PGA values at control point 3 - RB basement at -25 m: the color scale is related to the soil distorsion rate. In this Figure 10, results produced by set 1 and set 2 seems to have a similar trend, and are particularly coherent in the very low PGA range.
Fig. 10 – Pseudo acceleration response of the 4 Hz resonant equipment as a function of PGA (g) at the control point 3 – RB7 basement at - 25 m (triangles when initial seismic input is the “outcropping bedrock” point 2, circles when it is point 1 “Surface, soil”). The color scale illustrates the maximal soil distorsion reached during
the deconvolution process (restricted to 0,8%).
Finally, the fragility curves of the equipment have been determined from the 145 structural responses for the set 1 (excluded the 105 runs that do not converge or the soil shear strain is over 0.8% which is the limit we set for this study because the same value appeared in the IAEA Karisma benchmark), and from the 157 inputs of set 2. Theses fragility curves have been approximated by the cumulative distribution function of a lognormal random variable. Its parameters (median and standard deviation) have been evaluated using the principle of maximum likelihood [13]. Moreover, a confidence interval has been determined using a bootstrap method. Figure 11 illustrates the final fragility curves for set 1 and set 2 (blue and red curves respectivley), for failure criteria of 0,2g and 0,7g (left and right respectively). Without a careful check at each step (and especially analysing the physical meaning of incredible high acceleration values resulting from the deconvolution phase - using a methodology not adapted for such high nonlinear soil behevior) the fragility curve itself (from set 1) could be considered as “acceptable”, whereas this study demonstrated its unrealistic and unphysical bases.
Figure 12 finally shows, for a large range of failure criteria (from 0,2g to 1,2g) the influence of the control point to define the initial seismic motions (before deconvolution) on the predicted fragility curves key parameters (right) Am and (left) β, through their median values and 25% and 75% fractiles (the bottom and the
top of the box of each estimation). Figure 12 clearly shows that only at very low acceleration levels (i.e. where the soil distorsion is limited and lower than 0,1%) the 2 methods (set 1, set 2) are coherent, but for increasing loadings the results associated to the “surface soil” initial seismic motions strongly differ from those coming from the “outcropping bedrock” assumption. In the KK DC, the properties of the superficial soils develop high nonlinearity under high accelerations, which leads to unphysical seismic parameters after the linear equivalent deconvolution.
Fig. 11 – Two examples of median fragility curves and confidence intervals @ 95% for the 4 Hz resonant equipment, computed (Left) for a failure criterion equal to 0.2 g and (Right) for a failure criterion equal to 0.7 g.
This study also illustrates the biases which can be introduced into the fragility assessment process. The median acceleration of the fragility curve and its uncertainty (β value) are different in case of using set 1 data or set 2, and finally the case 1 approach (which has to be proscribed) would be not conservative (Am-set1
systematically higher than Am-set2).
Fig. 12 – Median values and dispersion of key parameters of the fragility curves computed for various failure criteria (from 0,2 g to 1,2g). Left: Am parameter, Right β. Results from set 1 in blue, from set 2 in red. Circles
are for median values computed with 200 bootstrap samples, vertical lines show the dispersion of the samples, the bottom and the top of the boxes indicate the 25% and 75% fractiles).
To conduct the full seismic risk analysis, this fragility curve should be convolved to the seismic hazard curve: this latter step should be necessarily performed by seismologists at the control point 3 to assure the coherency of the whole process. Such SHA in depth at the outcropping bedrock site condition is clearly not the current practice in France (SHA is always performed at the free field level, including potential site effects, see [2], and most of the time SHA is given through response spectra, the time series selection and generation being sensitive and complex problems).
5. Conclusions
This contribution aims to present the French SINAPS@ research project and its issues regarding current scientific challenges and potential benefits for nuclear plant safety. Through an example centered on the KK DC, the need of checking the coherency of all assumptions for describing the seismic motion from the geological
fault, including modelling of the seismic wave field through complex geology, its transmission and interactions with the fundations of the structure and equipment, has been pointed out. The identification, quantification of uncertainties at each step of the process is also conditional in order to hope properly assess potential seismic margin of future or existing nuclear plant. We also showed the efficiency of the chosen calculation scheme that allowed conveniently accessing to a sensitive equipment fragility curves. This scheme integrates a transient dynamic building model, the dynamic interaction with the ground via the foundation and the dependence between considered seismic motion and the soil characteristics (by the equivalent linear method). Seismic inputs were generated according to a given scenario and a chosen GMPE. This work showed that defining the control point at the free field as required in the nuclear french approach ([2] and [3]) condition is not appropriate and may conduct to biased results when performing nonlinear soil-structure fragility analyses. The control point, interface between the seismic hazard and the SSI, should be defined at the “outcropping bedrock” level.
6. Acknowledgements
The authors acknowledge each researcher, engineer and student working for SINAPS@. The work carried out under SINAPS@ receives French funding managed by the National Research Agency under the program “Future Investments” (ANR-11-RSNR-0022). SINAPS@ is a SEISM Institute project (http://www.institut-seism.fr/en/).
7. References
[1] Catherine Berge-Thierry C., Bard P.Y., Chartier T., Cottereau R., Bertrand E., Lopez-Caballero F., Clouteau D., Grange S., Erlicher S., Hollender F., Kotronis P., Lancieri M., Laurendeau A., Le Maoult A., Moussallam N., Nicolas M., Ragueneau F., Semblat J.F. and F.Voldoire (2015) : Toward an integrated seismic risk assessment for nuclear safety improving current French methodologies through the SINAPS@ research project. Proceedings of the 23rd
Conference on Structural Mechanics in Reactor Technology, Manchester, United Kingdom.
[2] “RFS2001-01, Règle fondamentale de sûreté n°2001-01 relatives aux installations nucléaires de base. Détermination du risque sismique pour la sûreté des installations nucléaires de base”, (2001), Nuclear Authority Safety.
[3] “Guide/ASN/2/01, Prise en compte du risque sismique à la conception des ouvrages de génie civil des installations nucléaires de base, à l'exception des stockages à long terme des déchets, radioactifs”, (2006), Nuclear Authority Safety. [4] “Evaluations Complémentaires de Sûreté, rapport de l'Autorité de Sûreté”, (December 2011), Nuclear Authority Safety. [5] SINAPS@, Proceedings of the 2014 plenary meeting, CentraleSupelec,
http://www.institut-seism.fr/wp-content/uploads/2015/11/ProceedingsSINAPS@_2014.pdf
[6] SINAPS@, Proceedings of the 2015 plenary meeting, Ecole Normale Supérieure de Cachan, http://www.institut-seism.fr/wp-content/uploads/2015/11/ProceedingsSINAPS_2015.pdf
[7] Altinyollar A. et al., (2013). Review of Seismic Evaluation Methodologies for Nuclear Power Plants Based on a Benchmark Exercise. IAEA- TECDOC-1722, International Atomic Energy Agency, VIENNA, IAEA.
[8] Fan Wang, J.M. Rambach (2014). Contribution to the IAEA soil-structure interaction KARISMA benchmark.
Proceedings of the 22nd Conference on Structural Mechanics in Reactor Technology, San Francisco, US.
[9] CAST3M, Finite Element code developed by CEA, France www-cast3m.cea.fr.
[10] Irmela Zentner, F. Allain, N. Humbert and M. Caudron (2014). Generation of spectrum compatible ground motion and its use in regulatory and performance-based seismic analysis. Proceedings of the 9th International Conference on
Structural Dynamics, EURODYN. Porto, Portugal.
[11] K.W. Campbell and Y. Bozorgnia (2008). NGA Ground motion model for the geometric mean horizontal component of PGA, PGV, PGD and 5% damped linear elastic response spectra for periods ranging from 0.01 to 10s. Earthquake.
Spectra, 24 (1).
[12] IAEA (2011), KARISMA Benchmark: Guidance document Part 1 : K-K unit 7 R/B structure - Phase I, II & III, IAEA-EBP-SS-WA2-KARISMA-SP-002, Rev. 04, Vienna
[13] I. Zentner (2010). Numerical computation of fragility curves for NPP equipment. Nuclear Eng. Design, 240 (6), 1614-1621.