Publisher’s version / Version de l'éditeur:
Proceedings of the 17 International Conference onthPort and Ocean Engineering under Arctic Conditions POAC'03, 2, pp. 787-796, 2003-01-16
READ THESE TERMS AND CONDITIONS CAREFULLY BEFORE USING THIS WEBSITE. https://nrc-publications.canada.ca/eng/copyright
Vous avez des questions? Nous pouvons vous aider. Pour communiquer directement avec un auteur, consultez la
première page de la revue dans laquelle son article a été publié afin de trouver ses coordonnées. Si vous n’arrivez pas à les repérer, communiquez avec nous à [email protected].
Questions? Contact the NRC Publications Archive team at
[email protected]. If you wish to email the authors directly, please see the first page of the publication for their contact information.
NRC Publications Archive
Archives des publications du CNRC
This publication could be one of several versions: author’s original, accepted manuscript or the publisher’s version. / La version de cette publication peut être l’une des suivantes : la version prépublication de l’auteur, la version acceptée du manuscrit ou la version de l’éditeur.
Access and use of this website and the material on it are subject to the Terms and Conditions set forth at
The Effect of Structure Shape on the Broken Ice Zone Surrounding Offshore Structures
Barker, Anne; Timco, Garry
https://publications-cnrc.canada.ca/fra/droits
L’accès à ce site Web et l’utilisation de son contenu sont assujettis aux conditions présentées dans le site LISEZ CES CONDITIONS ATTENTIVEMENT AVANT D’UTILISER CE SITE WEB.
NRC Publications Record / Notice d'Archives des publications de CNRC: https://nrc-publications.canada.ca/eng/view/object/?id=59a2978f-df02-4135-8d23-e27f0d909686 https://publications-cnrc.canada.ca/fra/voir/objet/?id=59a2978f-df02-4135-8d23-e27f0d909686
POAC ‘03
Trondheim
Proceedings of the 17 International Conference onth
Port and Ocean Engineering under Arctic Conditions POAC’03 Vol. 2, pp 787-796 Trondheim, Norway, June 16-19, 2003
THE EFFECT OF STRUCTURE SHAPE ON THE BROKEN ICE ZONE
SURROUNDING OFFSHORE STRUCTURES
Anne Barker and Garry Timco Canadian Hydraulics Centre National Research Council of Canada
Ottawa, Ont. K1A 0R6, Canada
ABSTRACT
The implicit Particle-in-Cell (iPIC) numerical model developed at CHC has been used to investigate the extent of the zone of broken ice around offshore structures during interaction with moving ice. The numerical model simulated level ice interaction with five offshore structure shapes: a circle, a square, an octagon, a multi-leg platform, and a conical structure. Ice properties were held constant for comparisons between structure shapes. Simulation data are compared with available field and laboratory documentation. Comparisons of the extent of the rubble zone were made between the structure shapes. The results are discussed in terms of their implications regarding safe evacuation of personnel from offshore platforms in ice-covered waters.
INTRODUCTION
Safe evacuation of personnel from offshore structures is of paramount importance in the event of a problem on the structure. For a number of offshore regions, the waters surrounding the structure may be ice covered for part of the year. This can create unique problems with respect to emergency evacuation from a structure. Recently Wright et al. (2002) provided a detailed overview of the issues for structures in ice-covered waters. One of the key areas of concern relates to lowering a survival craft into the region of broken and dynamic ice surrounding the structure. To date, very little research has been done to characterize the size of the broken ice zones and to determine the factors that affect its size and shape. Barker et al. (2001a) used an implicit Particle-in-Cell (iPIC) numerical model to determine the damage zone around the Molikpaq structure for a range of conditions. Comparison with full-scale data showed very good agreement with the model predictions. Poplin and Timco (2003) have compiled information on the damage zone around conical-shaped structures. They found that the size of the zone was a function of the ice thickness and the morphology of the ice.
In this paper, the influence on the shape of the offshore structure is investigated to determine its influence on the size and shape of the damage zone. To do this, the CHC-developed implicit Particle-in-Cell (iPIC) numerical model has been applied to a realistic situation of different types of offshore structures in a moving ice cover. Five structure shapes were examined. This paper presents a short description of the iPIC model, and presents the results of the numerical simulation. The implications of the results are briefly discussed in terms of emergency evacuation from structures in ice-covered waters.
OVERVIEW OF THE MODEL
The numerical approach is briefly outlined in this section with the intent to convey the essential aspects of model formulation. A comprehensive treatment of the subject is outside the scope of this paper, and would be too lengthy to include here. Details of the present numerical formulation, however, were covered by Sayed and Carrieres (1999), who developed a version aimed at operational ice forecasting. The model was later adapted and validated for solving ice-structure interaction problems related to offshore structures, with the Kulluk (Sayed et al., 2000; Barker et al., 2000a), and bridge piers (Barker et al.,2000b).
The present model uses a continuum rheology that follows a Mohr-Coulomb plastic yield criterion. The governing equations consist of the continuum equations for the balance of linear momentum and the plastic yield criterion. Those equations are solved using a fixed grid. Advection and continuity, on the other hand, are handled in a Lagrangian manner. An implicit Particle-In-Cell (iPIC) approach is employed. In that approach, an assembly of discrete particles represents the ice cover. Each particle has a fixed volume, and is assigned an area and a thickness. At each time step the velocities are interpolated from the grid to the particles. Thus, particles can be individually advected. From the new positions, values of particle area and mass are mapped to the grid. The resulting ice mass and area for each grid cell are then used to update ice thickness and concentration. Solution of the governing equations can then be carried out using the fixed grid. An implicit finite difference method is used. That method is based on uncoupling the velocity components and a relaxation iterative scheme. Updated velocities and stresses on the fixed grid are obtained from the solution.
A depth-averaged implementation of the model is used in this paper, which averages the values of stresses and velocities over the thickness. Thickness variations, however, are accounted for. As stresses exceed a threshold, representing a ridging stress, each particle undergoes ridging; i.e. the thickness increases and area decreases, while conserving ice volume. Additionally, grounding of the ice is factored into the conical structure program run.
TEST RUNS
Five different structure shapes were used in the test simulations. These were: circular, square, octagonal, multi-leg platform and conical structures. The test runs were chosen such that ice properties and other parameters would represent conditions that are commonly encountered in the Beaufort Sea. These parameters are listed in Table 1. The ice was initially “placed” upstream of the structure with the initial ice concentration (or aerial coverage) set at 0.8. Each test was run for 1500 s with the time step set at 0.1 s (15000 time steps). The grid node spacing in both the and Y-directions was 1 m. The grid size was 500 nodes in the
X-direction by 200 nodes in the Y-X-direction. The top edge of the grid (Y = 200 m) is considered to be the north edge in later references (see
Figure 1). The waterline diameter of the circular, square and octagonal structures was 100 m.
The equivalent width of the entire 4-legged platform was also 100 m, however each leg had a diameter of 30 m, with a spacing of 40 m between them. The waterline diameter for the conical structure was 50 m, as it was decided that a 100 m waterline diameter for such a structure was unrealistic. The ice moved from east to west with a velocity of 0.25 m/s. The ice cover was given an angle of internal friction of 45°. Its cohesion intercept value was 15 kPa, which corresponds with a global tensile strength of 10 kPa.
The iPIC model does not differentiate between sail and keel ice thickness. Rather, it presents the values of total thickness. Since the ice rubble is neutrally buoyant, the ratio of sail height to keel depth is assumed to be 1:4, and is used to present the resulting cross sections. That is, in order to approximate the sail and keel of the ice moving against the structure, the sail height was taken to be 0.2 of the total ice thickness, with the remaining portion allocated to the keel. Additionally, the model cannot differentiate between the failure zone and the zone of accumulated ice - it depicts the entire rubble field. This contrasts with information that is normally available from ice observer data, where visual observers can note the failure zone around a structure, but can view neither the whole rubble field nor the keel, as these are often covered with snow or submerged, respectively. It may also be difficult for a visual observer to resolve differences in sail height less than 0.5 m. This additional information on the extent of the keel portion of the ice could be valuable with respect to evacuation procedures from an offshore structure, and was discussed in Barker et al. (2001), as well as elsewhere in this paper. A schematic of the grid layout is shown in Figure 1. The X and Y axes represent distance in metres. The locations of the cross-sections that are used to compare rubble extents are shown in this figure. The rubble extent is taken as a minimum threshold value, calculated as a change in sail height greater than 0.2 m from level ice (i.e. a sail height greater than 0.4 m), and only where the concentration of ice is greater than 0.5. This sail height value was chosen as an estimate of a change in ice thickness that an ice observer might be able to distinguish from onboard a structure.
Plan views of the thickness contours after 1500 s for the various structures are shown in Figure 2. The contour levels are in 0.5m intervals, with minimum and maximum values of zero (white, representing the open water wake downstream of the structure), and 5m (dark grey) respectively. A narrow wake forms at the west side (downstream) of the structures and the ice rubble surrounds the remaining three sides of the structures. It should be noted that the contours include both the sail region (which is observable from the structure) and the keel (which is under the ice sheet and not observable from the structure).
The open-water wake formations for the structures showed some variation in shape, as found in the field, also shown in Figure 2. For all but the conical and multi-leg configurations, the wake downdrift of the structure remained open for at least 50 m, where the test grid ended. For the platform structure, the wake immediately downstream of the upstream legs closed, while the wake further downstream remained open for approximately 30 m. For the conical structure, the wake closed quickly, approximately 25 m downdrift of the structure.
A comparison of results for the 5 program runs is shown in Table 2. For each run, and each cross-section, the table shows the maximum rubble extent from the face, the maximum ice thickness and the maximum sail height. These maximum values are taken after approximately 375 m of ice have moved past the structures. As mentioned earlier, the maximum rubble extent is measured along a direction perpendicular to the updrift and alongside directions north and south sides of the structure, and takes into account a change in sail height greater than 0.4 m and only where the concentration of ice is greater than 0.5; where the results are zero, one or both of these criteria were not met.
Table 1 Test matrix
Structure Shape Ice thickness (m) Ice Concentration Ice Velocity (m/s)
Circle 1 0.8 0.25
Square 1 0.8 0.25
Octagon 1 0.8 0.25
4-leg platform 1 0.8 0.25
Conical 1 0.8 0.25
Figure 1: Schematic of the test area. Locations of the cross-sections that are used to compare rubble heights over time are shown, as well as outlines of the octagonal and multi-leg structures for reference.
Circle Square
N N
Octagon Multi-leg Platform
N N
Cone N
Figure 2: Plan view of total ice thickness contours for each structure after 1500 s. Contour levels are in 0.5 m increments, with minimum and maximum values of zero (white), representing open water, and 4.5 m (dark grey), respectively.
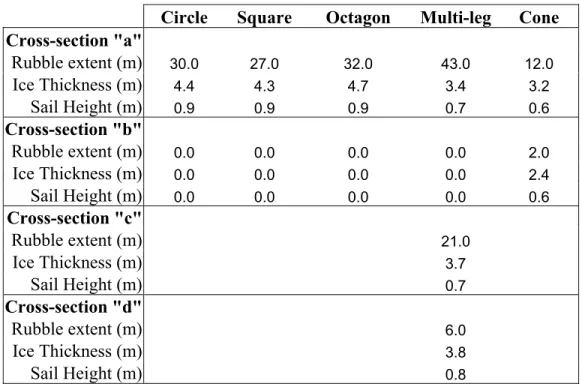
Table 2 Comparison of run results for each cross-section
Circle Square Octagon Multi-leg Cone
Cross-section "a" Rubble extent (m) 30.0 27.0 32.0 43.0 12.0 Ice Thickness (m) 4.4 4.3 4.7 3.4 3.2 Sail Height (m) 0.9 0.9 0.9 0.7 0.6 Cross-section "b" Rubble extent (m) 0.0 0.0 0.0 0.0 2.0 Ice Thickness (m) 0.0 0.0 0.0 0.0 2.4 Sail Height (m) 0.0 0.0 0.0 0.0 0.6 Cross-section "c" Rubble extent (m) 21.0 Ice Thickness (m) 3.7 Sail Height (m) 0.7 Cross-section "d" Rubble extent (m) 6.0 Ice Thickness (m) 3.8 Sail Height (m) 0.8
The maximum rubble extent along updrift “a” was 43 m, observed updrift of the multi-leg structure. Along updrift “c” for the multi-leg structure, that is, the centreline of one of the platform legs, the rubble extent was much less, at 21 m. From these results, it would seem that although the extent of the rubble pile-up is small for these relatively narrow legs (compared to the other structures), the closeness of the platform legs causes the ice to jam to a certain extent between the updrift legs. This can be seen in Figure 2. The rubble extent was smallest for the conical structure, while the extent was similar for the circular, square and octagonal structures.
For the circular, square, octagon and multi-leg platform cases, the ice rubble extent at cross-section alongside “b” was negligible, due to either minor rubble formation (less than 0.2 m) or low concentrations of ice (less than 5 tenths). This can be seen in the plots, where there are open water patches beside the circular and square structures. The rubble extent along the remaining structure, the cone, did not extend very far out, with a maximum extent of 2.0 m. However, with the multi-leg structure, at alongside “d”, the rubble extent was much larger, at 6 m. These results are shown in graphical format, in Figures 3 to 6. The conical structure was plotted separately, due to its different waterline diameter compared to the other structures.
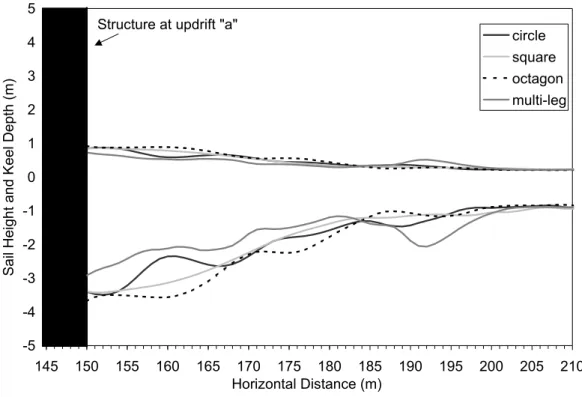
The pattern of ice thickness and associated sail heights build-up, as shown in Figure 2 and Figures 3 – 6, showed that regardless of structure type, the pile-up updrift of the structures was similar. Sail heights varied between 0.7 m and 0.9 m. Notice that although there is minor sail height build-up, there are relatively extensive keel formations for all of the structures, especially for the square and octagonal structures, as shown in the following figures.
-5 -4 -3 -2 -1 0 1 2 3 4 5 145 150 155 160 165 170 175 180 185 190 195 200 205 210 Horizontal Distance (m)
Sail Height and Keel Depth (m)
circle square octagon multi-leg Structure at updrift "a"
Figure 3: Cross-section, for east side only, at updrift “a” showing the different extents of the ice rubble zone. The multi-leg cross-section shown is taken at updrift “c”.
-5 -4 -3 -2 -1 0 1 2 3 4 5 145 150 155 160 165 170 175 180 185 190 195 200 Horizontal Distance (m) S a il Hei ght and K eel Depth (m) circle square octagon multi-leg Structure at alongside "b"
Figure 4: Cross-section, for north side only, at alongside “b” showing the different extents of the ice rubble zone. The multi-leg cross-section shown is taken at alongside “d”. In this plot, open water areas are evident and are represented by a flat line at 0.
-5 -4 -3 -2 -1 0 1 2 3 4 5 100 120 140 160 180 200 Horizontal Distance (m)
Sail Height and Keel Depth (m)
Structure at updrift "a"
Figure 5: Cross-section, for east side only, at updrift “a” showing the extent of the ice rubble zone for the conical structure.
-5 -4 -3 -2 -1 0 1 2 3 4 5 100 110 120 130 140 150 160 170 180 190 200 Horizontal Distance (m)
Sail Height and Keel Depth (m)
Structure at alongside "b"
Figure 6: Cross-section, for north side only, at alongside “b” showing the extent of the ice rubble zone for the conical structure.
IMPLICATIONS FOR SAFE EVACUATION
Previous work by the authors evaluated the effects of ice properties and drift direction on safe evacuation procedures with respect to launch direction and distance from a structure (Barker et al., 2001). As discussed in that paper, if an evacuation procedure involves launching a lifeboat-type vessel from a structure, the emergency evacuation procedure should have the flexibility to be quickly launched from any side, as well as the capability to be deposited a safe distance away from the ice rubble zone surrounding the structure. In reality, launching flexibility is often not a practical option for offshore operations, given the location of drilling and processes operations on the structure.
With respect to launch direction, launching in the updrift direction could be catastrophic since the ice would move the lifeboat back into the structure. If launching is done in the alongside direction, the launch distance must be larger than the width of the moving broken ice zone (the failure zone). Launching in the downdrift direction would put the lifeboat in relatively ice-freewater and might be the best approach; however this is often the downwind direction, which could be problematic if there are toxic fumes from the structure. In terms of the distance the launch needs to be from the structure, using a threshold value of 0.4 m to determine the extent of the rubble sail height results in a conservative value for the rubble field. With a larger threshold value, the rubble extent would become smaller, or closer towards the structure, in keeping with the quantitative data from the full-scale observations. In practice, this would shorten the launch distance from the structure.
The present analysis has shown that the shape of the structure can significantly influence the size and shape of the damage zone and broken ice accumulation around the structure. A circular-shaped structure appears to allow the broken ice to move relatively easily around the structure. This gives a narrower ice pile-up in the updrift direction. A square or octagonal structure allows somewhat less ice movement around the structure and wide zones of ice accumulate in the front of it. Somewhat surprisingly, the largest updrift zone occurred with the multi-leg platform where the ice jammed between the two front legs. This shape also did not produce a well-defined wake so placing a survival craft in the downdrift direction could be hazardous. The conical structure had similar response to that of a vertical circular structure. It also had a very narrow wake in the downdrift direction. In some respects, however, the conical shape has a distinct advantage over the other shapes. For a conical structure, the waterline diameter would be smaller than that for a vertical-faced structure. Typically, however, the deck size would be the same. Thus, for a conical structure the ice interaction takes place “underneath” part of the deck. The present analysis shows that the damage zone is not particularly large for the cone shape, so lowering a survival craft from the deck of a structure based on a conical shape may not require as much distance to the non-damaged zone. Further work in this area for different ice conditions would be required to examine this in detail.
It would initially appear that the extent of the accumulation of broken ice under the ice sheet that can be seen in Figures 3 and 4 would provide more buoyant support for loads put on top of the ice sheet and could add to the “effective” thickness of the ice for bearing capacity purposes. However the majority of the ice accumulates in the updrift direction, with very
little extent in the alongside direction and therefore, this added buoyancy should not be considered in determining the bearing capacity of the ice.
CONCLUSIONS
This paper examined floating ice rubble formation around five offshore structures. The model is based on an implicit Particle-In-Cell (iPIC) formulation and includes an efficient implicit numerical solution method. Parameters were held constant for each of the numerical simulations, in order to compare the resulting extent and height of ice rubble, as well as the formation of open water downdrift of the structures. Further work in this area could involve comparison of the results with available field and laboratory data, as well as investigating the role of the direction of the oncoming ice and the use of a cohesionless ice cover. The present work has shown that a detailed numerical analysis of ice interacting with offshore structures can provide additional insight into the parameters that should be considered for emergency evacuation in ice-covered waters.
ACKNOWLEDGEMENTS
The support of the Program on Energy Research and Development (PERD) is gratefully acknowledged.
REFERENCES
Barker, A., Timco, G. and Sayed, M. (2001). Numerical Simulation of the Broken Ice Zone Around the Molikpaq: Implications for Safe Evacuation. Proceedings 16th International Conference on Port and Ocean Engineering under Arctic Conditions (POAC’01), pp. 505-515. Ottawa, Canada.
Barker, A., Timco, G. Sayed, M. and Wright, B.D. (2000a). Numerical Simulation of the “Kulluk” In Pack Ice Conditions. Proceedings 15th International IAHR Symposium on Ice, Vol. 1, pp 165-171, Gdansk, Poland.
Barker, A., Sayed, M. and Timco, G.W. (2000b). Numerical Simulation of Floating Ice Forces on Bridge Piers. Proceedings 2000 Annual CSCE Conference, Vol. G, pp 243-249, London, Ont., Canada.
Poplin, J.P. and Timco, G.W. 2003. Ice Damage Zone Around Conical Structures: Implications for Evacuation. Proceedings POAC’03 (this volume), Trondheim, Norway. Sayed, M., and Carrieres, T. (1999). Overview of a New Operational Ice Forecasting Model,
ISOPE ’99. Vol. II, pp.622-627. Brest, France.
Sayed, M., Frederking, R. and Barker, A. (2000) Numerical Simulation of Pack Ice Forces on Structures: a Parametric Study. ISOPE ’00. Vol.1, pp.656-662. Seattle, U.S.A
Timco, G.W. 1996. NRC Centre of Ice/Structure Interaction: Archiving Beaufort Sea Data.
Proceedings 13th IAHR Symposium on Ice, Vol. 1, pp 142-149, Beijing, China.
Wright, B.D., Timco, G.W., Dunderdale, P. and Smith, M. 2002. Evaluation of Emergency Evacuation Systems in Ice-Covered Waters. PERD/CHC Report 11-39, Canmore, Al.,