Publisher’s version / Version de l'éditeur:
Journal of the Acoustical Society of America, 91, 3, pp. 1514-1524, 1992-03-01
READ THESE TERMS AND CONDITIONS CAREFULLY BEFORE USING THIS WEBSITE. https://nrc-publications.canada.ca/eng/copyright
Vous avez des questions? Nous pouvons vous aider. Pour communiquer directement avec un auteur, consultez la première page de la revue dans laquelle son article a été publié afin de trouver ses coordonnées. Si vous n’arrivez pas à les repérer, communiquez avec nous à [email protected].
Questions? Contact the NRC Publications Archive team at
[email protected]. If you wish to email the authors directly, please see the first page of the publication for their contact information.
NRC Publications Archive
Archives des publications du CNRC
This publication could be one of several versions: author’s original, accepted manuscript or the publisher’s version. / La version de cette publication peut être l’une des suivantes : la version prépublication de l’auteur, la version acceptée du manuscrit ou la version de l’éditeur.
Access and use of this website and the material on it are subject to the Terms and Conditions set forth at
Predicting theatre chair absorption from reverberation chamber
measurements
Bradley, J. S.
https://publications-cnrc.canada.ca/fra/droits
L’accès à ce site Web et l’utilisation de son contenu sont assujettis aux conditions présentées dans le site
LISEZ CES CONDITIONS ATTENTIVEMENT AVANT D’UTILISER CE SITE WEB.
NRC Publications Record / Notice d'Archives des publications de CNRC:
https://nrc-publications.canada.ca/eng/view/object/?id=f6e2b103-aefd-43d2-aa85-02bb5f860a8f
https://publications-cnrc.canada.ca/fra/voir/objet/?id=f6e2b103-aefd-43d2-aa85-02bb5f860a8f
Predicting theatre chair
absorption from reverberation
chamber measurements
Bradley, J.S.
NRCC-33981
A version of this document is published in
Journal of the Acoustical Society of America, 91, (3), pp. 1514-1524, March-01-92
The material in this document is covered by the provisions of the Copyright Act, by Canadian laws, policies, regulations and international agreements. Such provisions serve to identify the information source and, in specific instances, to prohibit reproduction of materials without written permission. For more information visit http://laws.justice.gc.ca/en/showtdm/cs/C-42
Les renseignements dans ce document sont protégés par la Loi sur le droit d’auteur, par les lois, les politiques et les règlements du Canada et des accords internationaux. Ces dispositions permettent d’identifier la source de l’information et, dans certains cas, d’interdire la copie de documents sans permission écrite. Pour obtenir de plus amples renseignements : http://lois.justice.gc.ca/fr/showtdm/cs/C-42
, Predicting theater chair absorption from reverheration chamber
measurements
J.
S. BradleyInstitute/or Research in Construction, National Research Council, OttawaKJA 0R6, Canada
(Received 24 May 1991; accepted for publication 8 October 1991 )
The sound absor.ption of small samples consisting of up to 18 upholstered theater chairs was measured in a reverberation chamber and these results were related to the effect of larger samples of the sarile chairs in auditoria. The sound absorption coefficients of the chairs, measured in a reverberation chamber, were found to be linearly related to the ratios of perimeter to area of the ウ。ューャセ@ of chairs. Extrapolating these reverberation chamber measurements to smaller perimeter to area ratios, characteristic of seating bloc;;ks in auditoria, produced good agreement with measurements of the same seats in the auditoria. This
procedure is proposed as
a
more accurate approach to predicting the absorbing characteristics of upholstered theater chairs in auditoria. Three other more approximate approaches were also considered including the use of screens to eliminate edge absorption, average sample size corrections, and the use of average absorption coefficients for all types of chairs. The meritsof
each approach are discussed and data are given for average sample size corrections. PACS numbers: 43.55.Gx, 43.55.Ev, 43.55.Fw
INTRODUCTION
Theater chairs, with or without their occupants, areal-most always the major source of sound absorption in audita· ria. Knowledge of the sound-absorbing properties of the chairs, both occupied and unoccupied, is therefore critical to predicting acoustical conditions in auditoria. Although this is a very important problem, our current knowledge only permits approximate estimates of the elfects of either occu· pied or unoccupied chairs.
For most types of absorbing materials, a standard sam· pie of a material is measured in a reverberant test chamber and these results are used to represent the elfect ofthe mate· rial When installed in a room. Because theater chairs come in a variety of types, it is desirable to predict the elfect of each type of chair from measurements of the same type of chair in a reverberant test chamber. Originally, this was done based on the total sound absorption per chair or per person. This approach implied that the derisity of audience seats had no elfect on their sourtd absorbing properties.
From an analysis of data acquired il) a number of large . halls, Beranek 1 suggested that a better approach was to as· sign absorption coefficients to audience surfaces made up of occupied or unoccupied chairs. This approach implies that the total surface area covered by the chairs or the audience is the fundamental parameter determining the total sound ab· sorption. Beranek's procedure requires that the surface area include strips to represent the additional absorption of the edges of each block of audience seats.
For typical porous absorbing materials, there is a sam· pie size elfect influencing the measured sound absorption coefficients. Smaller samples tend to. have larger sound ab· sorption coefficients than larger samples of the same materi·
T
n-•'·
tャAゥセゥウaNオ・@ エセエセBN。セAャゥAゥッョ。ャ@ absorption ()fthe edges of the; - :;_- '·T --- ... T----.. MMMMᄋMMMNLMMMMMセMMMMセM
material, and to 、ゥヲヲイ。」エゥッセ@ effects for finite-sized samples. Studies of thin layers of porous absorbers have found tbe following linear relationship to be approximately fol-lowed:2-4
a=f3(P/A) K。セL@ (I)
where a is the sound absorption coefficient of a finite sample,
fj is the regression constant, PI A is the perimeter/area of the sample, m-1
, and
a..,
is the absorption coefficient of aninfi-nite sample.
Thus,
if
one measuresa
for various-sized samples hav-ing dilferent PI A values, one cati fit a straight line to the data having a slope/3 and ao intercept 。セN@ One could then pre-dict the expected absorption coefficient for any other size of sample.Theater chairs constitute a sound absorbing material that is usually installed in very large areas in auditoria, but that can only be measured using quite small samples in a reverberation chamber. If Eq. (I) is applicable to theater ' chairs, then measurements
Or
various smaller samples could ; be used to extrapolate to the expected elfects of the larger ; samples installed in auditoria. Typically, 6 to 12 chairs aret
measured in reverberation chamber tests while an 。オ、ゥエッイᄋGセ@ium may contain between 200 and 5000 chairs.
Several problems may limit the applicability of this sim· ;: ple linear equation for use with theater chairs. Most pre-A viously published data relating sound absorption to sample ; size were for thin layers of porous absorbers at medium and-,;;
higher frequencies. It was not clear that Eq. ( I ) did apply
to:;
complex absorbing objects such as theater chairs, although
j
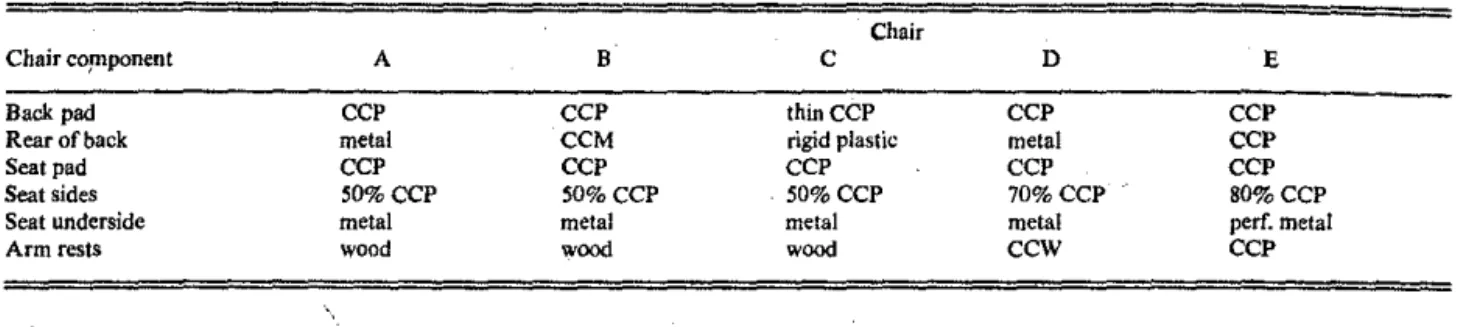
Hegvold' did find this type of linear relationship for simple;! model audiences. Calculations performed by Bartel,' based:! on theoretical work by Northwood,._, showed that in some;iiTABLE [. Description of five types of theater chairs. CCP
=
cloth·covered pad, CCM = cloth·covered metal, and CCW = cloth-coveted wood.Chair coptponent A B
Back pad CCP CCP
Rear of back metal CCM
Seat pad CCP CCP
Seat sides 50%CCP SDo/oCCP
Seat underside metal metal
Arm rests wood wood
cases the relationship may not be exactly linear. There is also evidence, from model studies, that the
f3
values depend on the degree of diffusion of the sound field.' Thusp
values obtained in a very diffuse reverberation chamber may notapply in an auditorium. .
The first goal of this work was to explore the effect of sample size on the measured sound absorption coefficients of theater chairs. It was desired to confirm that sound absorp-tion coefficients of theater chairs are approximately linearly related to the ratio PI A of the sample. It was also desired to know how the parametersP and
a.
vary with frequency for a variety of typical theater chairs. Further, it was intended to considerifthere is one set ofP
anda.
values typical of most chairs or whether these parameters vary considerably from one type of chair to another.The further goals of this work were to apply Eq. ( I) to predicting the effect of large areas of chairs in auditoria from measurements of-small samples in a reverberation chamber. This would determine if prediction accuracy was significant-ly improved by this technique, and would permit compari-sons with other approaches. Finally, other approximate techniques for predicting the absorption of upholstered theater chairs in auditoria are considered.
I. REVERBERATION CHAMBER MEASUREMENTS
The first series of tests consisted of measuring the sound absorption coefficients of various-sized samples of one type of theater chairs both occupied and unoccupied. The tests were initially undertaken because the auditorium in question was contemplating replacing its chairs and wished to know in advance. the effect of new or modified chairs.
A total of 18 chairs were available and these were ar-ranged in various groups with a row-to-row spacing of 0. 91 m. That is, the back of one chair was 0.'91 m behind the same point on the corresponding chair in the next row. The カ。イセ@
ioussamples gave a range of PI A values between 1.4 and 2.4
m- '. The chairs were highly absorptive modern theater chairs and are chair type E in Table I and Fig. I describing the various chairs.
Tests were perfoJ111ed in a 254-m3 reverberation
chamber having fixed diffuser panels as well as a large rotat-ing vane. The chamber is kept at a constant temperature of 20 'C. and a relative humidity of 55%. Measurements were made using least-squares fits to the decays from the ensem-ble average of 20 sound decays at each of nine independent
Chair
c
D EthinCCP CCP CCP
rigid plastic metal CCP
CCP CCP CCP
S0%CCP 70%CCP 80%CCP
metal metal perf. metal
wood
ccw
CCPmicrophone postttons セョ@ the room. Measurements were made in 1/3-oct bands, but the three individual 113-oct sound absorption coefficients in each octave band have been arithmetically averaged to produce a single value イ・ーイ・ウ・ョセ@
B
c
0
Q|セセセ]GZエャ@
lff;f;,--ccw
MetalE
FIG. J. Front and side views of chair types A-E. The material descriptions are the same as in Table I.
セセセセ@ セセLセMセM LMセセMセ@
l
tative of the octave for subsequent comparison with octave band measuremeil.ts in rooms.
Figure 2{3) gives some example results of sound ab· sorption coefficients versus frequency for samples of three different PI A valUes. The absorption coefficients were calcu· lated using the floor area occupied by the chairs. For these results no attempt has been made to eliminate the absorption of the edges of the block of chairs. The results in Fig. 2(a) show that the chairs were very absorptive and that the 。「セ@
sorption coefficients varied. considerably with sample PI A
value. Similar absorption coefficient values are given for the same chairs but for occupied conditions in Fig. 2(b). Again the sample PI A is seen to have a significant effect and ー。イセ@
ticularly so at higher frequencies.
The measured absorption.coefficients were then plotted versus the ratio of the sample perimeter to area, PI A. Figure 3 (a) shows the results in this form for unoccupied chairs. Linear セ・ァイ・ウウゥッョ@ lines have been fitted to each set of data and these have been extrapolated to a P /A value ofO 」ッイイ・セ@
sponding to a sample ofinfinite area. While the slope of the regression line for the 125·Hz results is near zero, the slopes tend to increase with increasing frequency.
Figure 3(b) plots similar results for the same chairs but in an occupied condition. Again, the slopes vary from near
2..---.,
"'
,..:
ffi
1.6 (3it
w1.28
z
セPNV@§
U)0.4セ@
(a) .A··"·" .... A ... 6 PiA 1.39 1.71 2.33 ·& セ@ .. a ..ッセセ]]セ]cセMMセ@
"' 2
!i
w (b) g1.6セ@
(..) 1.2セ@
セPNV@セ@
<o.4 125 ,/>' .••..•.• .A ... J::. PiA 1.53 1.68 2.42 ᄋ^セ@ ..a- .. £l. .. 250 500 1 ooc 2000 4000 FREQUENCY, HzFIG. 2. Measured sound absorption coefficients oftype·E chairs for three different PI A values, (a) unoccupied chairs and (b) occupied chairs. Chair edges exposed.
zero at 125Hz to increasingly higher values with increasing frequency. For both occupied and unoccupied chairs, these results predict less vatiation of absorption coefficient with frequency for an infinite sample than for the smaller test samples. The coefficients of the equations of the regression linesshown in Fig. 3(a) and (b) are given in Table II along with the associated standard errors.
These results indicate, that for these chairs, there is a large variation of absorption coefficient with PI A value, and
that this variation is approximately linearly related to the
P /A ratio of the sample for the measured range of P /A val·
ues. For example, a エケーゥセ@ sample of two rows of four chairs in each row would have aPIA value of approximately 2.0. Such a sample would have absorption coefficient values as much as 0.4 greater thari expected for an infinite area. Thus applying the results of measurements of eight chairs in a reverberation chamber to predict the effects in a large audi· torium, with no correction for PI A value, would lead to large errors.
Having demonstrated that the absorption coefficients of theater chairs do vary approximately with the ratio PI A for various sized test samples, .it is of interest to determine · whether the relationships shown in Fig. 3(a) and (b) can be used to more accurately predict the sound absorption of - large areas of chairs in auditoria. Unfortunately, the
auditor-tl 2
!i
!0! 1.62
u. u. セQNR@ (..)z
Q0.8t
a:
goA
Cl <"'
0tz"
2w
(3 u:;1.6 u.w
0 (..) 1.2z
8
セPNX@ 0gJ
<0.4 125Hz 250 Hz· 500 Hz·•·
....
·•·
QPセhコRPセセNhコTPセセ@ Hz ...::it:::
NセセセM...
セセ@...
セBBZLセ@...
...
,..."::"' ....
セZZ]MZMZZ[NZ@... ..:
c _c.. セivG@"
... .. ,. .. #. ...
-(a) . セ@ ... セ@t;-:::-:::·
;.4
·""
...
.-«t ...
/'.,!,."':.Jj,""" ,,...
ᄋᄋ[[セZ@ c セᄋBG@ c c,...
r- ...
;;4 ...
0 0.5 1 1.5 PiA, m·1 (b) 2 2.5FIG. 3. Measured sound absorption coefficients versus sample PIA for:_; type·E chairs, (a} unocCupied chairs and (b) occupied chairs. Chair edges·'-'):!
TABLE II. Regression equation coefficients and standard errors (S.E.) for chair type E unoccupied and occupied, edges exposed.
Freq,uency fJ S.E. a. S.E.
Unoccupied
12S -0.029 0.021 0.467 0.041
2SO O.llS O.OS2 0.700 0.099
soo
0.174 0.016 0.883 0.030 1000 0.238 0.026 0.990 0.049 2000 0.288 0.033 0.943 0.063 4000 0.3191 0.046 0.833 0.087 Occupied 12S - o.OS7 0.061 0.792 0.118 2SO 0.04S 0.101 1.136 0.197soo
0.181 O,OS9 1.2S4 0.114 1000 0.337 0.098 1.115 0.189 2000 0.399 0.076 1.073 0.148 4000 0.431 0.074 1.018 0.144ium having the type-E chairs chose not to modify or change its chairs and so it was not possible to verify this prediction procedure for this data.
II. VALIDATION IN AUDITORIA
Over a period of several yearS, other halls were soUght where the theater chairs were to be removed and changed. This usually occurred as part of more general renovations. lit each case, measurements of various samples of up to-18 chairs were made in a reverberation chamber and .results similar to Fig. 3 (a) were obtained. In addition, reverbera-tion time measurements were made in the halls both with and without the chairs installed, but with as little else as possible changed. From these measurements, the effective sound absorption coefficients of the chairs, as installed in the auditorium, were obtained. This turned out to be much more difficult than expected because construction schedules usually dictate that several different jobs go on in parallel. Thus, in practice, it was almost impossible to measure イ・カ・ゥNMセ@ beration times with only the chairs and no other factors changed. Planned measurements in several halls were not made because of inappropriate conditions in the halls. In spite of these problems, four sets of this type of data were obtained.
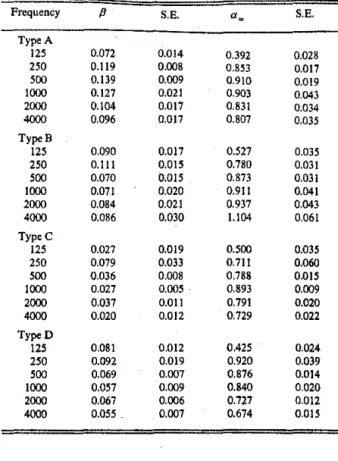
Each of the four types of chairs were upholstered theater chairs, but were in detail different. The four types are chairs A-D in Table I and Fig, I. For each type of chair, absorption coefficients were measured aS a function of PI A value in the same reverberant test chamber described above in Sec. ·I. Linear regressions were ·performed and equations of the form of Eq. (I) were obtained. The coefficients of these regression equations are given in Table III, and permit one to predict the,absorption coefficient of each type of chair as a function of the PI A value. Reverberation times were mea-sured in each auditorium for at least 18 combinations of source and receiver position with and without the chairs present. From these aUditorium reverberation times the ef-fective absorption coefficients of the chairs in the auditorium were calculated. The absorption coefficients measured in the
tablセ@ III. Regression equation coefficients and standard errors (S.E.)
for cha1r types A-D unoccupied, edges exposed.
Frequency fJ S.E. a. S.E.
Type A 125 0.072 0.014 0.392 0.028 250 0.119 0.008 0.853 0.017 500 0.139 0.009 0.910 0.019 1000 0.127 0.021 0.903 0.043 2000 0.104 0.017 0.831 0.034 4000 0.096 0.017 0.807
oms
TypeB 125 0.090 0.017 O.S27 0.035 2SO 0.111oms
0.780 0.031soo
0.070 O.oiS 0.873 0.031 1000 0.071 0.020 0.911 0.041 2000 0.084 0.021 0.937 0.043 4000 0.086 0.030 1.104 0.061 TypeC 12S 0.027 0.019 0.500oms
250 0.079 0.033 0.711 0.060soo
0.036 0.008 0.788oms
1000 0.027o.oos
0.893 0.009 2000 0.037 0.011 0.791 0.020 4000 0.020 0.012 0.729 0.022 TypeD 12S 0.081 0.012 0.425 0.024 2SO 0.092 0.019 0.920 0.039soo
0.069 0.007 0.876 0.014 1000 0.057 0.009 0.840 O.o20 2000 0.067 0.006 0.727 0.012 4000 0.05S. 0.007 0.674 O.Ql5halls were compared with those predicted from reverbera-tion chamber measurements for a sample of two rows of four chairs (PI A = 2.0 m-1
) and for the actual blocks of chairs
in each auditorium in Figs. 4-6. An average PI A value was obtained for each hall from an area-weighted average of the
PI A values of the actual seating blocks in each hall. This
area-we;ighted average calculatiorfwas similar to the normal procedure used to calculate average absorption coefficients foi- the surfaces of a room from the areas and absorption coefficients of each material making up the surfaces of the room.
For chairs A and B, the results in Figs. 4 and 5 show excellent agreement between vaJuesmeasured in the auditor-ium and those predicted from reverberation chamber ュ・。セ@
surements. There are only some small discrepancies at 125 Hz where the predictions might be expected to be less accu-rate. The agreement for chairs A and B is probably quite good because for these chairs the renovations to the auditor-ium were relatively minor and there were no substantial changes other than the chairs.
The results for chairs C and Din Figs. 6 and 7 were less successful. Larger changes were made to these halls and it was not possible to accurately account for all materials that were added to the halls or that were present during construc-tion phase that existed at the time of the empty hall measure-ments. For the type-C chair results in Fig. 6, absorption coef-ficients measured in the hall tend to be lower than the predicted values but the differences are in most cases less
1.2 0.8
I
0.4 250 500 1 000 2000 4000 FREQUENCY, HzFIG. 4. Comparison of sound absorption coefficients for type-A chairs, measured in the hall and estimated from reverberation chamber tests for
tworowsoffour chairs (PI A= 2.0) and a hall-sized sample {PI A
=
0.8),than 0.1. These chairs were unusual in that their absorbing characteristics varied very little with PI A value. Thus the results predicted for the hall and those fur a sample of eight chairs in Fig. 6 are quite similar in magnitude.
The results for chair type D in Fig. 7 show good agree-ment between absorption coefficients measured in the hall and those expected from the reverberation chamber
mea-surements at some frequencies but poor agreement at 250
and 500 Hz. Unfortunately, in this case considerable con-struction work was in progress at the time of t}le measUre-ments in the hall with the chairs removed. Thus the failure to obtain good agreement at all frequencies in the results of Fig.
7 is thought to be caused by the presence of extra absorption in the empty ball due to construction activities.
The general conclusion is that the procedure of predict-ing the sound-absorbpredict-ing properties of chairs in an auditor-ium from extrapolations of reverberation chamb.er tests of chair samples with various PI A values seems to be success-ful, but is sometimes difficult to validate in practical situa-tions. 1.2 /wsof ..
セ@
... ···...
/
·1.:
-0.8セMQGOBLィ。ャャ@
,• //'predicted
.§.
1\l 0.4 0 125 250 500 1000 2000 4000 FREQUENCY, HzFIG.
s;
Comparison of sound absorption coefficients for type·B chairs, measured in the haU and estimated from reverberation chamber tests for two rows of four chairs (P /A= 2.0) and a hall-sized sample (P /A= 0.8).1.2
250 500. 1000 2000 4000
FREQUENCY, Hz
FIG. 6. Comparison of sound absorption coefficients for type-C chairs, measured in the hall and estimated from reverberation chamber tests for tworowsoffourchairs (P /A= 2.0) and a hall-sized sample (P /A= 0,8).
Ill. PRACTICAL APPROACHES TO PREDICTING CHAIR
ABSORPTION
A. Four possible approaches
In this section, four different approaches to predicting the sound-absorbing properties of chairs in auditoria _are considered. The results presented in the above two sections suggest that predictions_ from reverberation chamber mea-surements of several sampits of different PI A value can be used to predict the sound-absorbing properties of chairs in halls by extrapolating to expected sound absorption coeffi-cients at smaller
P
/A
values. This first method may well be the most accurate approach, but requires a number of careful sound absorption tests. For large concert halls or other situa-tions where the properties of the chairs are critical, this is thought to be the preferred approach. In many other situa-tions, this approach might be too expensive and other tech-niques can be considered.A second apprOach is to try. to characterize an average upholstered theater chair and to use its average sound
ab--1.2 0.8
!
0.4 250 500 1000 2000 4000 FREQUENCY, HzFIG. 7. Comparison of sound absorption coefficients for type-D chairs, measured in the hall and estimated from reverberation chamber tests for two rowsoffourchairs {P /A= 2.0) and a hall·sizedsample {PIA=
sorption coefficients to predict the effect of all types of up·
holstered chairs in any auditorium. This is essentially the
·approach that Beranek' has taken, although he has only claimed that his average absorption characteristics are valid in large halls.
A third possibility is to consider using screens around a
single small sample of chairs in a reverberation chamber sound absorption test to eliminate the absorption of the
edges as suggested by Kath and Kuhl.' This approach as-sumes that the PI A value effect is largely an edge absorption effect and that by screening the sides of the sample, absorp-tion coefficients can be obtained that are representative of a large sample of chairs in an auditorium.
A fourth possible approach would be a compromise be-tween the first two. It would consist of trying to obtain an average conversion factor between absorption coefficients
from some standard small sample in a reverberation
chamber and the expected values in an auditorium. In terms ofEq. ( I ) , this would require the determination of average
P
values typical of all upholstered theater chairs. TheP
values given in Tables II and III are for samples that include ab· sorbing edges. One could alternatively calculateP
values for samples with the edge absorption subtracted. These would then be smaller and indicate less sensitivity to thePI A
value. Such averageP
values might better represent a range of dif-ferent upholstered theater chairs.The first of these four possible techniques has been con· sidered in the previous sections of this paper. The other three approaches are considered below.
B. An average upholstered theater chair characteristic An indication of the absorption coefficients of large samples of the five types of chairs tested in this work can be obtained from the 。ᆱセ@ values. These are plotted versus ヲイ・セ@
quency in Fig. 8. This figure indicates that there is a イ・。ウッョセ@
able similarity among the results of the different types of chairs even though the chairs were of quite different con-structions. They varied from very absorptive (chair type E, cloth-covered padding almost everywhere) to much less
ab-1.2
r---..,
tlffi
·e
'
,.·./l
,'....
··"
ᄋBGセGIGヲᄋM.. -... .. .. ..
0
u:
0.8 . :::;.-... BGNZNMBBBGZGAABセ[ZNNNLBGB@ .. セZ[LN@ -"" ... ./
LM[Aセ\MNNNN@···· .. ' , _ .... ..
/·;,· . c
1'·· .... -:: ... ..
§
,. 1' D .·'·
-:
セ@
1-0.4 II.a:
セ@
0 , 25 250 500 , 000 2000 4000 FREQUENCY, HzFIG. 8. Comparison of estimated infinite area sound absorption coefficients for chair types A-E.
c-·"--MMMᄋMMMMMイMセ@ ..
--sorptive (chair type C, limited amount of thinner cloth-cov· ered padding). Thus the five different types of chairs repre-sent a considerable portion of common types of upholstered theater chairs. It is interesting to note that the measured absorption coefficients for smaller samples varied much more among the different chair types.
Although there is a reasonable similarity among the re· sults for the five types of chairs shown in Fig. 8, some of the differences seem to relate to differences in the construction of the chairs. The largest differences occur at 250 and 2000 Hz. The chairs with the highest absorption at 250Hz, types A and D, both had metal panels on the rear of the seat backs. It is quite possible that these thin metal panels absorbed more sound at 250Hz than.the other types of chair backs. At 2000 and 4000 Hz, the two chair types with the highest ab· sorption coefficients, types Band E, both had cloth-covered rear panels to the seat backs which would be expected to increase the high·frequency sound absorption of the chairs. These individual characteristics change absorption 」ッ・ヲヲゥNセ@
cients by approximately 0.1 at 250 Hz and by about 0.2 at 2000 Hz. Thus using an average chair characteristic would be expected to introduce errors in estimates of chair absorp· tion coefficients of as much as 0.2. More experience in relat-ing
aoo
values to the construction details of chairs might make it poSsible to produce average characteristics for 、ゥヲセ@ ferent types of chair constructions and hence to reduce this error.To consider further the possibility of an average uphol-stered theater chair characteristic, it is interesting to 」ッュセ@
pare these
aoo
values with Beranek's average absorption co-efficients1 for upholstered unoccupied chairs. Figure 9 compares the average of the five chair types of this study with Beranek's average values. The complete range of the present data is shown as the shaded area about the mean values. There is reasonable agreement between the two sets of average values but there is a tendency for Beranek's values to be lower, particularly at 250Hz.The two results were derived by very_ different ap· proaches and there are a number of factors that could con·
FREQUENCY, Hz
FIG. 9. Comparison of the mean and range of values oft he estimaled infi· nite area sound absorption coefficients with Beranek's average upholstered chair absorption coefficients.
:I,
I '
tribute to these differences. The data from the present study are based on only five types ofupholstered theater chairs and
the values plotted are intended to represent results for an
infinite sample area. Although the five types of chairs in· elude a variety of chair constructions, other types of chairs might be different. If absorption coefficients were calculated for large but less than infinite areas the results from the ーイ・ウセ@
ent study would be higher with larger differences relative to Beranek's results.
Beranek's results were obtained from reverberation
time measurements in a large number of auditoria. Beranek plotted values of the reciprocal of reverberation time versus
the ratio of the area of the seating to the hall volume. He drew straight lines through the resulting plots and from these calculated average absorption coefficients for uphol-stered theater chair surfaces as well as for the average of all other surfaces. He excluded data in each octave band if a particular hall was atypical because of the presence of unu-sual amounts of sound absorbing material. He gave no statis-tics concerning the scatter involved in fitting the linear rela· tionships. The similarity among the
a
w values in Fig. 8 fromthe five different types of chairs suggests that it is possible to determine approximate average absorption characteristics typical of upholstered theater chairs.
However, a single average characteristic can only ap· proximate the properties of particular types of chairs and there are possible sources of small errorS in Beranek's aver-age absorption coefficients. There is a reasonable amount of scatter in Beranek's data and it is quite likely that using data from other halls would produce differences in the resulting absorption coefficients. It is also possible that 'other proce-dures for fitting relationships to this data would also lead to different absorption coefficient values. Linear relationships were only possible by assuming a typical value of the ratio of volume to total surface area to be representative of all halls (Beranek used 3m -•). To minimize this problem Beranek included only large halls, but variations in this ratio would intluence the scatter of the data.
The difference between Beranek's and the present mean at 4000 Hz is easily explained as due to unknown differences in air absorption among the many halls from which Beranek obtained data. Diffeiences between Beranek's results and the present results may also occur because of the difference in diffusion between reverberation chambers and auditoria. The present results were obtained in a very diffuse reverbera· tion chamber while Beranek's results are based on the less diffuse conditions in large auditoria. In general, in less dif-fuse conditions absorbing material tends to be less effective. Thus one would expect Beranek's results to tend to have lower absorption coefficients as was observed. Thus the dif· ference in the state of diffuseness between reverberation chambers and auditoria may contribute to the differences in absorption coefficients in Fig. 9. Hegvold's model audience tests,5 showed evidence of a small difference b'etween results
obtained in a model reverberation chamber and those in a model lecture theater.
It is possible to use an average absorption coefficient to characterize the approximate acoustical absorption of up-holstered theater chairs in an auditorium but this will lead to
<:!
,_-1.2
z
UJ i3u:
tt
0.88
セ@
.... 0.4 Average unoccupied,.,.. ..., __ ...I
__ . .,.. ...
MセセMZZBᄋMZZJNセNNNNNN@ BBᄋᄋGᄋQQNᄋᄋMMMセ@ -P'- .,. ... ···-LZZLNLNNNセNᄋセb・イ。ョ・ォ@ ···-•セセB@ エGセᄋᄋᄋNNャャGᄋᄋᄋ@
"-.. ""'--occupied。セᄋᄋᄋᄋᄋ@
" " unoccupiedI
0
125
250
500
1000 2000 4000
FREQUENCY, HzFIG. 10. Comparison of occupied and unoccupied estimated infinite area sound absorption coefficients with Beranek's data from halls.
some uncertainty in the predicted effect of a particular type of chairs. There is first of all some question as to which aver-age characteristic to use. The present results lead to higher absorption coefficients, particularly at 250Hz, than Beran-ek's well known result. In addition, the present results ゥョ、ゥセ@
cate that different types of chair constructions lead system-atically to different absorption characteristics. Using one average 」ィ。イ。」エ・イゥウエセ」@ would ignore these differences and lead to increased errors in predicting the effects of chairs in an auditorium.
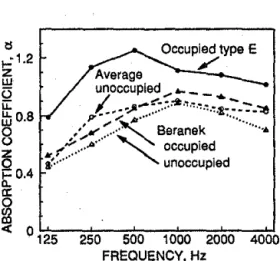
Figure !0 compares Beranek's average absorption
coef-ficients for occupied theater seats with the
a
oo valuesob-tained from the occupied type-E chairs. Unfortunately, only the type·E chairs were tested in an occupied condition. The occupied type-E chairs seem to be considerably more ab-sorptive than Beranek's average results. It is possible that these chairs are not representative of typical chairs or that the difference in the dilfuseness of reverberation chambers and auditoria contnbute to these dilferences.
C. Using screens to minimize edge absorption
Kath and Kuhl9 have suggested the use of screens around the sample of chairs in a reverberation chamber sound absorption test to eliminate the absorption of the edges of the sample. This assumes that the variation of ab-sorption coefficients with
PI A
value is largely due to the disproportionately high absorption of the edges for small samples of chairs. Although such screens may reduce the unwanted absorption oft he edges of the sample of chairs, by forming an enclosure acoustical conditions are produced that would not occur in an auditorium. There is also the question of the preferred height of these screens. If they are too low they will not completely eliminate the absorption the edges, but if they are too high they will partially screen the top surfaces of the chairs and the unwanted effects of the enclosure may become exaggerated.Reverberation chamber absorption tests were per·
formed on a block of three rows of four of the type-E chairs both with and without screens around the edges of the sam·
l:l1.6
r - - - ,
ffi
セ@
1.2 u.8
zo.s
セ@
セPNT@
<
Exposed edges .. セ@... .'
'
··'
..
...
...
...
セMMᆳ (a) (b)FIG. II. Measured sound absorption coefficients for t)'Jle-E chairs with the
chair edges both exposed and screened, (a) unoccupied chairs and (b) OC·
cupied chairs.
pie, and for occupied and unoccupied chairs. Figure II (a) plots the measured absorption coefficients for the unpied chairs, and Fig. II (b) shows similar results for 12 occu-pied chairs. The screens were constructed from IO·mm plywood and they formed a complete 60-cm-high wall around the group of chairs. Being immediately adjacent to the chairs, they would be expected to screen or block sound from being incident on the edges of the chairs. At frequencies of about 250Hz and higher, the screens do reduce the mea· sured absorption coefficients by blocking the absorption of the edges of the sample. At lower frequencies, the screens seem to increase the absorption of the sample, and, hence, do not function as intended. It may be that the plywood screens add some low-frequency sound absorption or that the enclo·
sure they form leads to an effective increase in low-frequency
sound absorption. Whatever the cause, the technique is not
successful in eliminating edge absorption at lower frequen·
cies.
The use of screens is only useful if it eliminates the
vari-ation of absorption coefficients with the
PI A
of the sample of chairs. This was tested using the data from Fig. II (a) and (b) for the type-E chairs. From the reverberation chamberabsorption measurements, with and without the screens in
place, the absorption coefficients of the edges of the chairs were calculated. These chair edge absorption coefficients were then used to subtract the absorption of the chair edges from the total sound absorption of the chairs for each of the
six different
PI A
values measured and that were included inTォhEセウ・、@
4kHz screened
the data in Fig. 3. Thus a new set of absorption coefficients for the chairs was obtained for varied
PI A
that excluded the absorption of the edges of the chairs. Again linear regres· sions were performed on this data and equations of the form of Eq. (I) were produced. (This approach assumes that a block of chairs behaves like a simple ideal absorbing sample. In practice, the effective absorption coefficients of the edgesmay also vary with sample size. However such effects are
assumed to be small and not critical to the present exercise.)
Figure 12 gives examples of these results for the
unoccu-pied type·E chairs. in this plot, results are given for the
SOO·
and 4000-Hz bands. The data and regression lines are in· cluded for the chairs both with and without the edge absorp· tion included. The effect of subtracting the edge absorption is to reduce the slope, {J, of the regression lines. Thus there is
less variation withP
I A
value, but it is not eliminated and wasgreatest for the highest two frequency bands. Similar results were obtained for occupied chairs. The regression coeffi· cients obtained for both occupied. and unoccupied type-E chairs are included in Table IV.
TABLE IV. Regression equation coefficients and standard errors {S.E.) for
chair tYPe E unoccupied and occupied with edges screened.
Frequency p S.E. a. S.E. Unoccupied 125 0.036 0.026 0.453 0.048 250 0.074 0.053 0.696 0.100 500 0.065 0.017 0.876 0.033 1000 0.069
o.ozs
0.981 0.049 2000 0.106 0.036 0.945 0.067 4000 0.165 0.043 0.847 0.082 Occupied 125 0.046 0.061 0.792 0.118 250 -0.036 0.099 1.138 0.193 SOD 0.032 0.063 1.245 0.121 1000 0.093 0.097 1.112 0.188 2000 0.126 0.076 1.011 0.147 4000 0.164 0.068 1.051 0.133'i
i
·I
IIt is possible that higher screens might provide a more complete elimination of the absorption by the edges of the chairs at higher frequencies. The ISO standard for
reverber-ation chamber sound absorption tests 10 requires a screen of
up to 1 m high to be used. It is also quite probable that higher
screens might significantly increase the negative effects of the screens.
For this type of chair, the use of screens provides an improved estimate of the effect of the chairs in an auditorium
relative to the results of the same sample of chairs without
screens. However, this approach still includes significant er-rors. For example,
if
a sample of two rows of four chairs withaP /A valueof2.0m _,were measured, the 4000-Hz absorp-tion coefficient would be approximately 1.2 which is 0.4 larger than the 0.8 value expected for an infinite sample of these chairs according to the results of Fig. 12. If the
vari-ation of absorption coefficient with sample
PI A
wereelimin-ated, the slope, ,8, ofthe results in figure would be close to 0.
D. An average reverberation chamber to auditorium correction
The results presented in Sees. I and II indicate that the measured absorption coefficients of upholstered theater chairs vary approximately linearly with PI A value and that this variation is of the form ofEq. (I). Ifoneaveragesetof,B
values could be used to characterize all chairs, then a single
reverberation chamber absorption test could be performed on one small sample of chairs and the expected effect of a larger sample calculated. This would have the advantage of including the influence of the construction details of
particu-lar types of chairs. The success of the method would depend on finding ,8 values that accurately represent a variety of different types of chairs. The method could be applied to ·samples of chairs with their absorptive edges either screened or exposed. Average ,8 values could be determined for either
case.
The case of chair samples with their edges exposed is tlrst considered. Figure 13 plots ,8 values versus frequency
0 . 5 , - - - .
0.4
0.3"'"
ui
a.0.2
9
UJ0.1
-0.1
125
250
500
1000 2000 4000
FREQUENCY, HzFIG. 13. Calculated {3 values for chair types A-E from reverberation chamber measurements with the chair edges exposed.
for the five types of chairs measured in this study. These same,Bvalues are included in Tables II and III. While the,B
values for four of the five types of chairs are quite similar, the
fifth type of chair (type E) has quite different,B values. Also
the variation of
/3
values among chair types seems to relate toconstruction details. The type-E chairs with the largest area of cloth-covered absorbing surfaces had significantly larger
,8 values at medium and higher frequencies. The lightly up-holstered type-C chairs had the lowest ,8 values for thissame frequency range. Thus the,B values seem to be systematically related to the area of exposed absorbing material on the
chairs, and any average
P
values would ignore these effects.Figure 14 plots the average ofthe,Bvalues from Fig. 13
for unoccupied chairs along With the range of the measured
values for the five types of chairs. Thus this average repre-sents the best estimate from the present data of average ,8
values typical of upholstered theater chairs. Also shown are the ,8 values obtained from measurements of the occupied type-E chairs. Although these ,8 values are from only one type of chair, they are the only available ,8 values for occu-pied upholstered theater chairs with their edges exposed.
The variations of the chair absorption coefficients with
PI A value are due to diffraction effects and the absorption of
the edges of the small blocks of chairs. Hence, eliminating the edge absorption would significantly reduce the resulting
,8
values. Since the variation of,8
values among the chair types seemed to be influenced by ;he amount of exposed ab-sorbing material, ,8 values for sainples without edge absorp-tion would be smaller and probably more similar in magni-tude. Thus it is likely that the differences in,8
values among chair types could be reduced if the edge absorption wereeliminated in all reverberation chamber absorption tests.
Also errors in the resulting smaller
,8
values would be less important because their influence on the predictedabsorp-tion coefficients would be smaller.
Figure
15
plots,8
values calculated for the type-E chairs with the edge absorption subtracted. For both occupied an unoccupied conditions, similar smallP
values are found.0.5 . . - - - ,
0.4 "'"0.3ui
g0.2
UJ0.1
0 Occupied _,セLNNLNNBB@
セ@ セ@ FREQUENCY, Hz--·
FIG. 14. Mean and range of
P
values for unoccupied upholstered theater chairs with edges exposed andP
values for occupied type-E chairs.0.5 . - - - . 0.4 al. 0.3
ui
g
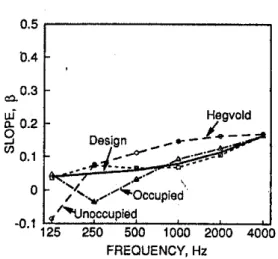
0.2 "' 0.1 0 '0·1 125 250 500 1000 2000 4000 FREQUENCY, HzFIG. 15. Calculated fJ values for upholstered theater chairs with edges screened for both occupied and unoccupied type-E chairs. Also shown is a design curve approximating the calculated values and Hegvold's simple model audience results.
The {J values increase with frequency from about I 000 Hz, but seem to be irregular at lower frequencies. These ャッキセ@
frequency irregularities are probably due to the unwanted
effects caused by the screens acting as an acoustical
enclo-sure. Hegvold's results for a simple model audience with the edge absorption removed are also included in Fig. 15 and they show reasonable agreement with the full scale results.
Because the occupied and unoccupied {Jvalues are quite similar for medium and high frequencies, an estimate of typi-cal {J values for either condition can be obtained from.the smooth design curve shown in Fig. 15 that is intermediate to the two data sets. Of course, this is only an estimate, but the
{J values are quite small and this estimate may be adequate for practical purposes. Unfortunately, it is an estimate based on only one type of chair, and the one type that was found to be considerably more absorptive than the other four types. Comparison with the average {J values in Fig. 14 suggests that the high-frequency increase in {J values found for the type-E chairs with edges screened in Fig. 15 may not occur
for less
absorptivetypes of chairs. However, there is
セカゥ、・ョ」・@of a possible high'frequency increase in {J values in the work of Kath and Kuhl.' They predicted chair absorption in a
large hall from reverberation chamber measurements of
chaii-s with their edges screened. Their reverberation
chamber measurements underpredicted high-frequency chair absorption (see their Figs. 4 and 5 results). This sug-gesis that in their case too, there was a sample PI
A
effect at higher frequencies even after the effect of edge absorption had been eliminated by screens.There are thus two possible approaches: extrapolating
from reverberation chamber chamber measurements with the edges either screened or exposed. There are merits and
disadvantages to both approaches. Testing with the edges exposed avoids the low-frequency problems caused by screen enclosures, but leads to larger {J values that probably vary more from one type of chair to another. This would lead
to larger possible errors because of the larger and more カ。イゥセ@
able {J values. The use of screens to eliminate the absorption of seat edges leads to much smaller {J values and, hence, any
error in determining an average value for all types ofuphol· stered theater chairs, or in using these to extrapolate to larg-er areas, is less significant. While thlarg-ere are irregularities at
low frequencies, they should not usually lead to large errors
in absOrption values. Where the best po;ssible accuracy is required, measurements of several different-sized samples are recommended.
IV.
CONCLUSIONSReverberation chamber measurements of the sound
ab-sorption of five types of upholstered theater chairs con-firmed that the measured absorption coefficients were ap-proximately linearly related to the sample P /A. Thus
reverberation chamber measurements of absorption
coeffi-cients as a function of PI A can be extrapolated to predict
expected values for larger samples corresponding to seating
blocks in typical auditoria. This procedure was successfully validated for four different types of chair.
Four different approaches for predicting the absorbing
properties of theater chairs in an auditorium were consid·
ered. They can be ranked according to their estimated
pre-diCtion accuracy, but other factors may determine which
procedure is most appropriate for a particular situation. For example, the most accurate approach is probably the most expensive and may not be justifiable in all cases. The four approaches are summarized briefly below.
( I ) The most accurate approach is to measure the sound absorption coefficients of at least five or six different-sized samples of chairs and to extrapolate to smaller PI A values for the larger area seating blocks found in an auditor-ium. This approach will include the effect of the details of the construction of particular types of chairs. The reverberation chamber tests can be performed with the edges of the chairs . exposed to avoid the low-frequency problems found when
chair samples are screened.
(2) A more economieal, but less accurate approach, would be to perform a reverberation chamber sound absorp-tion test on a single small sample of chairs (perhaps two rows of four chairs) and to extrapolate to larger samples using average {J values. The single sample could be measured with its edges either screened or exposed. An indication of the
average
P
values for either case is given in the results of thispaper. Average extrapolations from a single screened edge sample are likely to be more accurate, because the resulting sample PI A effect is smaller.
( 3) As a less accurate approach, one could simply use the results of measurements of a single small sample with its
edges screened to estimate the effects of the chairs in an audi·
torium. Although this has been suggested,' and is included
in an ISO standard, 10 there seems to be no particular reason
to do this now because the average extrapolations suggested
in this paper are very easily performed.
( 4) When no absorption tests of the chairs in question are possible, then average characteristics of typical uphol-stered chairs such as those published by Beranek can be
used. The present results showed reasonable agreement with Beranek's data and confirm that this can be a satisfactory
approach. Of course, the details of particular chair
construc-エゥッョセN@ are ignored.
The present results include measurements of only one type of occuPied chair. While these may give some indication of expected effects for occupied conditions, the same chairs unoccupied were not representative of the other types of chairs that were tested. There
is
an obviousneed
for more information on the sound-absorbing properties of occupied theater chairs.ACKNOWLEDGMENTS
The author would like to acknowledge the valuable as-sistance of Tim Kelsall of Hatch Associates and John O'Keefe of Barman Swallow Associates for helping to locate and gain access to halls having their chairs replaced. The helpful cooperation of the National Arts Centre, Ottawa,
was
also very much appreciated.1 L. L. Beranek, Music Acoustics and Architecture (Wiley, New York,
1962).
セtN@ Ten Wolde, "Measurements on the Edge-Effect in Reverberation Rooms," Acustica 18, 207-212 ( 1967).
3H. Dekker, "Edge Effect Measurements in a Reverberation Room," J.
Sound Vib. 32 (2), 199-202 (l974).
4T. Bartel, "Effect of Absorber Geometry on Apparent Absorption Coeffi·
cients as Measured in a Reverberation Chamber," 1. Acoust. Soc. Am. 69
(4), 1065-1074 (1981).
5 L. W. Hegvold, "The Sound Absorption of an Audience on Upholstered
Seating," Appl. Acoust. 4, 257-278 ( 1971 ).
6T. D. Northwood, M. T. Grisaru, and M.A. Medcof, "Absorption of
Sound by a Strip of Absorptive Material in a Diffuse Field," J. Acoust. Soc. Am. 31, 595-599 ( 1959).
7T. D. Northwood, "Absorption of Diffuse Sound by a Strip or
Rectangu-lar Patch of Absorptive Material," J. Acoust. Soc. Am. 35, 1173-1177 (1963).
8T. D. Northwood, "Absorption of Sound by a Strip or Rectangular Patch
of Material," Build. Res. Note 44, National Research Council (April 1964).
9U. Kath and W. Kuhl, "Messungen zur Schallabsorption von pッャウエ・イセ@
stiihlen mit und ohne Personen," Acustica 15, 127-131 ( 1965).
10ISO 354--"Acoustics-Measurement of Sound Absorption in a Rever·
beration Room" (International Organization for Standardization, Gene-va, 1985).