HAL Id: hal-01576248
https://hal.archives-ouvertes.fr/hal-01576248
Submitted on 23 Aug 2017
HAL is a multi-disciplinary open access
archive for the deposit and dissemination of
sci-entific research documents, whether they are
pub-lished or not. The documents may come from
teaching and research institutions in France or
L’archive ouverte pluridisciplinaire HAL, est
destinée au dépôt et à la diffusion de documents
scientifiques de niveau recherche, publiés ou non,
émanant des établissements d’enseignement et de
recherche français ou étrangers, des laboratoires
Explanations Engine For Energy Management Systems
in Buildings
Amr Alzouhri Alyafi, Jean-Phillipe Guillbaud, Patrick Reignier, Stephane
Ploix
To cite this version:
Amr Alzouhri Alyafi, Jean-Phillipe Guillbaud, Patrick Reignier, Stephane Ploix. Explanations Engine
For Energy Management Systems in Buildings. The 9th IEEE International Conference on
Intelli-gent Data Acquisition and Advanced Computing Systems: Technology and Applications, Sep 2017,
Bucharest, Romania. �hal-01576248�
Explanations Engine For Energy Management
Systems in Buildings
Amr ALZOUHRI ALYAFI
∗Jean-Phillipe GUILLBAUD
†Patrick REIGNIER
‡Stephane PLOIX
§August 22, 2017
Abstract
Humans live and spent their times in buildings. Determining the best configuration for their office or apartment (HVAC configuration, doors and windows positions, usage of appliances,...) is becoming subtle be-cause low consumption buildings are becoming more and more sensitive to human behavior. Moreover, variable energy costs and energy availabil-ity issues increase the complexavailabil-ity of the energy management problem. In such complex situations, many scientific research and engineering works are ongoing with the aim of supporting occupants in their everyday life, but still, in most cases, there is a need for experts to design models for living zones to manage, which is time-consuming and very costly. This paper will continue in the stream to help occupants to understand their energy systems and the impact of their actions on the system, by provid-ing causal explanations and presentprovid-ing a path diagram for all actions and environmental changes and their consequences.
Keywords: Smart Buildings; efficient energy use; differential explana-tions; causality; multi-objective optimization; differential evolution; Pareto-optimality; ambient intelligence; user advice generation content...
1
Introduction
Considering the ever-growing energy demand and the depletion of non-renewable energy resources, it is important to limit the energy usage in buildings which constitute roughly about 40% of the global energy supply [1]. Thus, it is im-perative to satisfy the demands of building occupants without increasing the present rate of energy consumption in buildings. Occupants, on the other hand,
∗GSCOP, Grenoble Institute of Technology, 46 avenue Felix Viallet, Email:
†Univ. Grenoble Alpes, CNRS, Inria, LIG, F-38000 Grenoble France,
Email:[email protected]
‡Univ. Grenoble Alpes, CNRS, Inria, Grenoble INP, LIG, 38000 Grenoble, France,
Email:[email protected]
§GSCOP, Grenoble Institute of Technology, 46 avenue Felix Viallet,
being an integral part of the building system, can affect the indoor environ-mental condition through their actions. By intelligently utilizing these actions, positive effects can be brought upon the indoor environment.
Attempts have been done to meet the comfort demands of the occupants by improving building construction techniques and adding insulation to walls and ceilings. Building regulations also play an important role in the overall (both global and local) energy management. But all of this did generate a second effect presented in a major increase of the impact of user actions, obtaining positive impacts of occupant’s actions in the energy consumption can help to manage their own comfort. It is therefore important to assist occupants with an optimal energy plan in order to explain that their expectations on comfort can be attained by themselves to some extent.
Thus, guiding the occupant’s actions, like opening and closing doors and windows, for a significant period of time, can help to achieve better comfort in energy building at the same cost of energy consumption, if not minimizing it.
The approach used in this work is applied and tested in a real office, situated in Grenoble Institute of Technology, France, fitted with 27 sensors. To collect data like temperature, solar luminance, wind speed, humidity, moisture, CO2
concentration, etc., and a daily presence of 4 researchers as shown in figure 1. Also, physical models of the office are used. Those models are based on the physical context of outside environment and neighboring data and other variables. The indoor temperature and CO2 concentration are responsible for
thermal and air quality dissatisfaction of the occupants.
Depending on weather forecast, an optimal schedule of actions for desired criteria can be calculated using the physical models and by generating expla-nations, occupants can be implicated in the loop so they will understand the consequences of their actions and where the system recommendations are com-ing from, and how those actions are affectcom-ing their comfort criteria.
2
Problem Statement
The main objective of the paper is to propose solutions to assist occupants to better understand how they can modify their behavior and make better deci-sions with respect to their own comfort criteria. Due to the complexity of the building physics and unconscious routines, occupants face difficulties while try-ing to understand their energetic current situation and why they need to change their daily routines to obtain better comfort or reach a better compromise be-tween comfort and cost. Generation of contextual explanation is therefore very important to involve the occupants by understanding how and why the system is recommending different actions, inhabitants will be able to reason and assess whether they will accept the recommended actions or not, and define how they will adapt their routine according to the best computed strategy.
The paper focuses on the generation of explanations about energy impact of user actions. Explanations occur in different ways [2] and for different reasons. One of the main motivation for having explanations is to be able to manage in a better way if similar events or scenarios arise in future [3]. Explanations usually rely on causal relationships. There are at least four kinds of causal explanations: common cause, common effect, linear causal chains, and causal homeostasis (cyclic causal relationships) [4]. According to [5], explanations
Figure 1: Map of the office with sensors
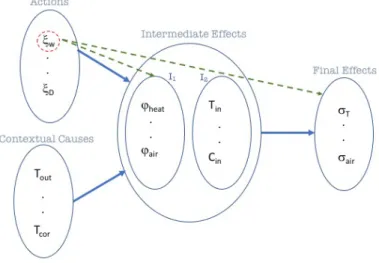
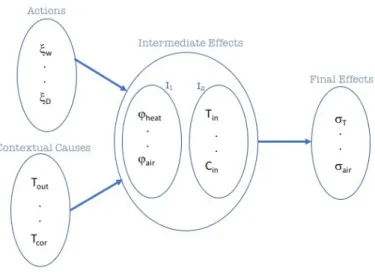
are ubiquitous, come in a variety of forms and formats, and are used for a variety of purposes. Still, the common feature about most explanations is their limitation. For most natural phenomena and many artificial ones, the full set of relations to be explained is complex and far beyond the grasp of any one individual. Explanations should rely on causal relationships i.e on an ordering in phenomena modeled by variables: the causes i.e. occupant actions (A) or contextual (C) phenomena, final effects (E) and intermediate effects (I). It is summarized in Fig. 1 for the studied office.
Arrows in the figure represent the cause-effect relation between these groups. More precisely, the different groups are:
1. Context group: it contains all the uncontrollable variables that the system needs to take into consideration like the outside temperature Tout, the
Figure 2: General schema of explanations
2. Action group: it contains all the different actions that the system can propose to the occupants to enhance their comfort levels (like opening the window ζw, and opening the door ζD).
3. Effect group: it contains the variables that will be directly experienced by the occupants like thermal dissatisfaction σT and air quality dissatisfaction
σair.
4. Intermediate group: it contains different sub-groups and different levels for multiple intermediary variables. These variables are either measured like the indoor temperature Tinand the indoor CO2 concentration Cinor
estimated like the heat flow ϕheatand the air flow ϕair.
All of this can be reformulated as: A, C−→ E where:I A is the set of variables modeling occupant’s actions, C is the set of contextual variables,
I represents the intermediate variables, and E represents the effect variables.
The effects resulting from the best actions according to some given criteria can be computed.
It is denoted by: A∗, C I
∗
−→ E∗ where:
A∗ is the optimal set of actions,
I∗ represents the intermediate variables generated from optimal actions, and E∗ is the optimal effects that can be achieved.
To generate the explanations, a concept of the qualitative difference is de-fined by comparing the actual scenario (˜x) to the optimal one (x?), which is
Πv−3,v−2,v−1,v1,v2,v3(x ?− ˜x) : x?− ˜x < v−3→ very low v−3 ≤ x?− ˜x < v−2→ low v−2≤ x?− ˜x < v−1 → slightly low v−1≤ x?− ˜x < v1→ no change v1≤ x?− ˜x < v2→ slightly high v2≤ x?− ˜x < v3→ high x?− ˜x ≥ v3→ very high (1)
This mapping is done to show the occupants the impact of their actions on the comfort criteria, and to convince them to change their behavior when it is far from their objectives.
3
Physical Knowledge Model
This section represents the physical models, showing its complexity and how the method proposed in this paper will profit from the models and facilitate their comprehension by occupants. Advanced energy management systems rely on one or more physical models. For example, the physical model for predicting the inside temperature for the office built by [6] is shown in figure 3 that repre-sents a simplified physical for the same office which reprerepre-sents only one thermal zone. where : Φin Tin Tin Tout Tn Rout Rn RD RW Ri Ci Τ ζW ζD
Figure 3: The reference model of the physical model [6]
Tn, Tin and Tout represent respectively the temperatures of the adjacent
cor-ridor, the office and outdoor.
RD and RW represent respectively thermal resistances of the door and the
window when are closed.
ζD and ζW represent the average of opening/closing in time T .
Riand Ci represent respectively the resistance and the capacitance of walls.
φinrepresents the internal thermal gains: solar gains, gains of electric devices
and gains due to occupancy.
Tin= R Ri τ + R( 1 Rout + ζW RW )Tout+ R( 1 Rn + ζD RD )Tn (2)
with Rn, Rout, Ri and Ci being time-invariant.
Determination of the air quality is usually done by measuring the concentra-tion of CO2in the air. The following air quality model has been used: Ccor, Cin
and Cout represent respectively the CO2concentration of the corridor, the office
and outdoor. V stands for the volume of the office and n(t) for the number of occupants [7].
Then, it yields to:
VdCin dt = − (Q0(t) out + Q0(t)cor+ ζW(t)Qw + ζD(t)QD)Cin+ (Q0(t)out + ζW(t)QW)Cout+ (Q0(t)cor + ζD(t)QD)Ccor+ SCO2× n(t) (3)
Further details of the physical model can be found in [6]. From Eq. (2) and (3), it is clearly noticeable that the desired criteria, thermal comfort and air quality, are dependent on many different phenomena from different zones and from different actions.
Another very important element in an energy management system is the optimizer [8].
The optimizer acquires the available data and the various models to compute the optimal scenario (set of actions) according to the chosen comfort criteria regarding the occupant’s preferences. The details on the optimizer used for this paper is provided in [9].
Based only on these observations, it is very complex to correlate all these different data to understand why the energy management system is recommend-ing some actions. If the user’s behavior is not the same as the proposed optimal scenario, he will have to change his habits. To help him to change his habits, it is important to explain him what are the consequences of each of his non-optimal actions so that he can decide which one he will adapt his routine according to or not. Aiming for implicating the inhabitants, the proposed approach tries to benefit from the physical model then figures out how to extract useful informa-tion from different measured and calculated data, and represent them in a way that makes more meaning for the inhabitants.
4
Differential Explanations and the independence
graph
To extract the knowledge from the physical models and render them compre-hensible; this paper propose differential explanations as a solution for that. Differential explanations are constructed by analyzing the difference between two scenarios (for example a historical one and an optimal one calculated by the system) to assist occupants to realize the impact of their daily actions with the contextual variables on their desired criteria.
This comparison includes the set of possible actions, the intermediate vari-ables, and the effects. The difference between the users’ actions and optimal actions calculated by the energy management system form the basis for the ex-planations. With this, it is possible to generate an indicator for the impact of those actions on the desired objectives. It also evaluates the different criteria and represents them in form of causality chain or network to clarify them for occupants. This concept is presented in figure 4.
Figure 4: the principal
Figure 5: Differential Explanations
In figure. 4, differential explanations are illustrated in a table where the first column represents the distance to optimality for actions with what the occupant should have done according to the optimal plan, as shown in Eq. (4).
A?k− ˜Ak= ∆Ak (4)
where A?k represents the action (Fig. 2) calculated by the optimizer at time k (with a granularity of 1 hour) while ˜Ak represents a measured occupant’s
action at the same instant. The variable k can take any value in { 0, 23 }. In this paper, k = { 8, 20 } , ∀k, because it focuses on the time where occupants are present (daytime period). At 8am, for instance, the inhabitant should have opened the window more. At 4pm, the user behaves according to best scenario. The second column presents the effects (Fig. 2), like in the thermal comfort and the air quality. This is given by Eq. (5).
Ek?− ˜Ek= ∆Ek (5)
where E?
k represents the calculated effect by system at instant k while ˜Ek
represents the measured effect. The right-hand-side of Eq. (4) and (5) denotes the difference in actions of the occupants and its resulting difference in the effect at the k-th instant, respectively.
To better represent the causality in the explanations and extract the knowl-edge from the system, the intermediate variables are added in the third column of Fig. 4. Those variables are computed using the physical model to better represent the causal chain and by that more agreeably accepted by occupants.
The last row labeled ALL represents the overall gain or loss in the comfort criteria throughout the day. It’s a small summary that gives the inhabitant an indicator of optimality for the entire day.
When computing this differential explanation, it is first necessary to trans-form quantitative variable values into qualitative ones that can be more easily understood by the occupants and allow to define qualitative distances. For in-stance, telling the occupant that closing the door at 2pm will cause a lot of decrease in the airflow and that he will obtain a significant decrease in the air quality level is easier to understand rather than telling that a difference in air-flow of 30% will lead to a difference in CO2 concentration of 400 ppm. The
transformation from quantitative to qualitative is done by dividing the value domain of a variable into 7 sub-domains (3 positives, 3 negatives and 1 no-change levels). Those levels were chosen from the physical world according to their impact on the model and the occupant.
The levels for the variations in thermal dissatisfaction are given by: ΠT−0.25,−0.15,−0.05,0.05,0.15,0.25(∆σkT(Tin))
The levels for the variations in air quality dissatisfaction are given by: ΠCCO2
−0.2,−0.1,−0.05,0.05,0.1,0.2(∆σ k
air(Cin))
The levels for the variations in the opening of the door and the window are given by (door or window opening means how long they have been opened in a one hour time period):
Πopening−0.7,−0.5,−0.2,0.2,0.5,0.7(∆ζD)
The arguments of each of these discretization functions is the difference of the measured quantity with the proposed optimal value of the quantity.
Except for the no-change level, where arrows are omitted, 1 to 3 arrows have been used to represent the associated sign of variation (arrows direction) and intensity (number of arrows). For instance, in Fig. 4, the window logo with three adjacent upward arrows means that the occupant should have opened the window for a much longer period of time during the corresponding time period. As it can be seen, the differential explanations are much easier to understand as inhabitants don’t need to figure the related variables and correlate between different actions, effects and intermediate variables. With differential explana-tion, it is thus easy for an occupant to identify the actions that needs to be modified, monitor the difference gained with respect to different criteria while at the same time use the intermediate variables as elements of understanding.
The differential explanation is providing a list of behavior modifications (opens the door for a longer period, for instance) with the associated impact. However, there are two limitations with such a description.
First, there is not a direct link between an action modification and its im-pact. Buildings have inertia i.e. energy dynamically stored in their structure. This inertia causes a delay and has a smoothing effect on different changes in the building preventing a rapid degradation or augmentations in temperature. Inertia is also present in the room volume for the CO2 concentration. Thus,
occupant actions might have a delayed impact.
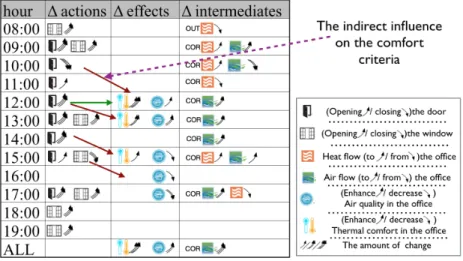
Figure 6: Differential Explanations with Influences
In Fig. 6, closing the door at 10am does not have an immediate impact but it has a strong influence on the air quality at 12pm.
Second, all the proposed action modifications does not have the same impor-tance: some of them have a limited influence and could be skipped if necessary (the inhabitant might not want for instance to interrupt his current activity to close the window). But some of them should be followed because of their high influence on the selected criteria (like the previous door example having a strong influence on the air quality).
Lets consider
˜
A = { ˜Ai,k; ∀k}
A?= {A?i,k; ∀k} (6) where i stands for the different actions (window and door) and k for the time period. The influence of each action is determined by changing one action at a time like in Eq. (7). Starting from the calculated plan, we consider a new plan where all the actions are provided by the calculated plan except one which is replaced by the action that has been done by the inhabitant (the action that we want to calculate its influence).
A?t = {A?k; ∀k 6= t} ∪n ˜At
o
(7) The physical model is then used to re-simulate the effects of the new plan.
Physical model: A?t =⇒ Et? (8) By comparing the optimal scenario with a scenario calculated by replacing one optimal action by the action that has been really done, it is possible to evaluate the impact of occupants behaviors that they may have on the comfort level and how it is preventing them from reaching their desired criteria level.
Et?− E?
k = ∆E (9)
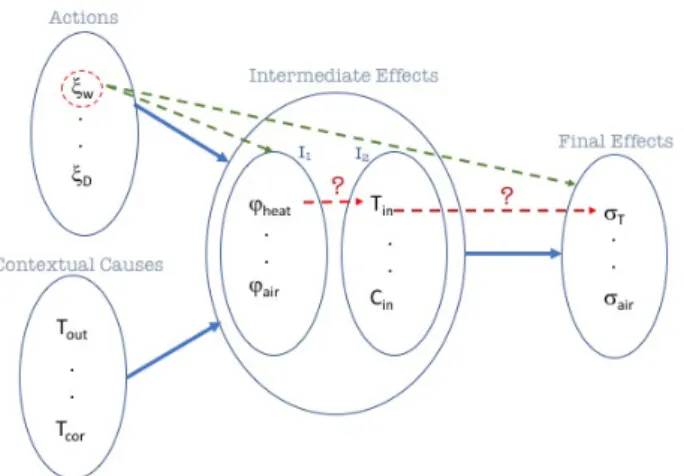
Within those equations, it is possible to generate cause-effect relations be-tween actions and final effects, but the causality bebe-tween the different levels of the intermediate variables and with final effects are unreachable because their changes can’t be monitored with a physical model as experts try to simplify the model to the maximum.
In order to build a full cause-effect relation between variables, an expert knowledge needs to be represented to indicate the potential causality between variables and eliminates the impossible ones like in figure 7.
By minimizing the number of variables to simplify the complicated calcula-tions even when those variables probably hold a meaning for occupants. Reach-ing those variables is important to give occupants complete explanations.This can be achieved by injecting the expert knowledge in terms of rules representing the potential causality and the forbidden ones. This can be easily done because the expert has a very good knowledge about the nature of those variables.
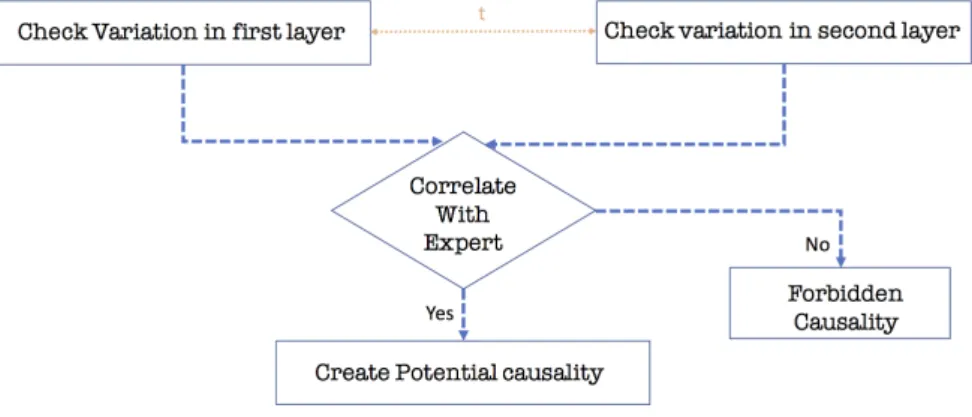
Like presented in the figure 8, the expert will define the potential causality. So when the system detects a change in different variables in different layers at the same time. It will try to examine whether it can determine the variable from the first layer affecting the other variable in the second layer, and by this build the cause-effect relation between them.
Figure 8: Adding Expert knowledge
Figure 9: Adding Expert knowledge
Thus, the proposed method allows the occupants to have an explanation based on the cause-effect relations of their actions and they may decide to change their routines, after learning from their historical actions.
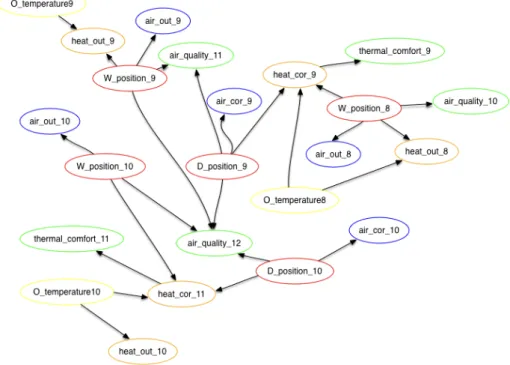
Applying the same principle on the context variables , it is then possible to generate a full diagram like in the figure 10.
Ct?− C?
k = ∆C (10)
Within this the inhabitant would understand how much his actions are af-fecting the comfort criteria and evaluate this with the weight changing in the contextual variables.
Figure 10: Part of the path diagram for one day
By developing the path diagram the occupant will be provided with a com-plete description of all factors that played a role in his day and he can inspect how did they evolved through the day. Allowing him to be explore where he is willing to enhance his routines and where not.
5
Text Generation
5.1
Objective
The differential explanations are provided to help inhabitants to better under-stand their habitats because they will easily underunder-stand the ecological impact of their behavior and how they can modify it to improve that impact. Still, reading complex graphic table may be a rather abstruse experience for the user. Therefore, to base on the inhabitant knowledge, such a table like in figure 4 is not easily understandable and occupants will favorite a statement in natural language rather than the table. The statement needs to be well written and also entirely automatically generated in a smart way to not repeat the same words
all the time. Thus, by making cooperation effort with occupants, it will be easier for them and they can more quickly adopt the right behaviors and enjoy the satisfaction that comes from understanding the effects and their behaviors.
5.2
Problem statement
Natural Language Generation (NLG) is an NLP sub-field concerned with the generation of texts from non-linguistic data [10]. Typical systems take a high-level representation of input data, select and structure the final information to convey (macro-planning), makes a lexical and syntactic transformation to this structured information (micro-planning) and to finally linearize it as text (surface generation). This classical pipeline as mainly be approached by ex-pert and grammatical rules [11], statistical models [12] or machine learning [13] in application as diverse as complex medical data summarization [11], prose generation [12] or image captioning [13].
NLG is a dialogue system and Machine Translation (MT) system. Most recent stochastic MT systems perform NLG through shallow language models but MT systems using a high-level internal representation that presents deep general-purpose NLG module.
MT systems have to generate a target text that complies with the grammar rules of the target language, starting from a deep formal linguistic structure obtained from the linguistic analysis of a text in the source language. ARIANE-HELOISE was chosen to be used as MT system to be quickly able to generate the text form of the differential explanations.
5.3
system Ariane-Heloise
The Ariane-Heloise MT system [14] is the re-engineering of the widely known Ariane MT system [15]. It takes over all functionalities by improving or sim-plifying them. As well as its predecessor, it links together several transducers, which enable to transform the source text into a decorated tree to transform this tree into a linguistic tree structure to generate from that structure a target text. During the process, various linguistic operations are carried out: mor-phological and structural analysis, lexical transfer, syntactic and mormor-phological generation. The decoration on each node of the decorated tree is a combination of values for a set of declared variables and allow for coding linguistic properties and relations.
5.4
GRA-FRA
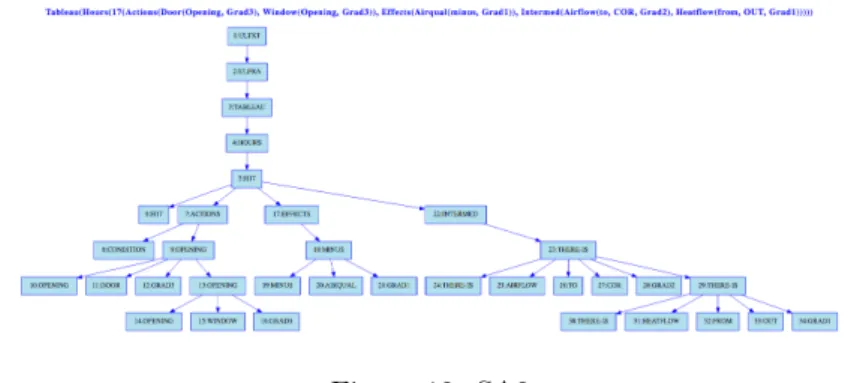
A first model was developed in ARIANE-HELOISE for a feasibility demonstra-tion: the GRA-FRA (”GRAphe vers texte en FRAn¸cais”: graph to French text) model. It was specifically designed for generating messages from the tables con-taining differential explanations. It receives input text that is the linearized arbores-cent expression of the tables and it produces a French text. The 7 phases of contents processing are succinctly described below from a simple ex-ample. Phases 2-6 implement tree-to-tree transducers that transform the dec-orated tree by applying transformational grammars and consulting dictionaries (XA and LT).
Figure 11: Table and its linearized expression
• MA, Morphological Analysis, implements a string-to-tree transducer in order to produce a decorated tree, the only data structure that can be manipulated by the Ariane-Heloise system. It also distinguishes between strings corresponding to ”Concept-words” of the table and the elements of the tree structure (parentheses and commas).
• XA is an analysis dictionary that contains all the concepts used in tables with their description by means of variables values.
• SA1, Structural Analysis 1, produces the exact image of the table and its contents as a decorated tree.
• SA2, Structural Analysis 2, modifies the tree produced by SA1 to give it a syntagmatic linguistic expression, ready to be translated into French.
Figure 12: SA2
• LT, Lexical Transfer, translates the words of the table into French and sets the syntactic functions of words and phrases.
• SG, Syntactic Generation, calculates the surface syntactic structure of the sentences of the French target text and the morphological agreements in person, gender and number between the lexical constituents of the linguis-tic tree.
• MG, Morphological Generation, implements a tree-to-string transducer which first produces the correct forms of the words of the leaves of the linguistic tree and then outputs the final French text corresponding to the table contents.
Figure 13: Output from Ariane-Heloise GRA-FRA GM phase
6
Conclusion
The main objective of this paper is to help the occupants to get a better un-derstanding of their energy management system and their actions. This work discusses and presents why explanations are needed and why they are important for occupants apprehension of the energy management system and the impact of their actions. It presents the concept of differential explanations i.e. a type of cause-effect explanations and also presents the concept of the influence of the inhabitant’s actions to clarify for him/her the long term effect of his/her actions. This study uses the multi-objective version of differential evolution (DEMO) for proposing optimal actions to the occupant based on his/her past actions. This is preliminary work dealing with thermal and air quality comfort criteria.
In future, this work will examine different methods to build and generate qualitative models to define causality between actions and their causal chain of impacts. This can be done by using causal physical models like bond graphs [16] and try to profit from the techniques of the causal graph to formalize the causal explanations like by using GARP3 [17] as a workbench for qualitative reasoning and modeling.
Another aspect to be explored is the optimal schedule obtained when other criteria such as humidity, consumption of energy, the price of electricity, etc. come into play. Besides having multiple criteria, the occupant may be biased towards certain criteria. Hence, the preference of the occupant plays a crucial role in decision making. Incorporating such user preferences is another open area of research. As the only machine learning tool used in this work is the optimization algorithm, the comparison of the performance of the proposed approach using other optimization algorithms is to be studied further.
acknowledgments
This work benefits from the support of the INVOLVED ANR-14-CE22-0020-01 project of the French National Research Agency [18] which aims at implement-ing new occupant interactive energy services, like MIRROR, WHAT-IF and SUGGEST, into a positive energy building constructed at Strasbourg in France by Elithis.
References
[1] E. of France EDF. (2016) Le bˆatiment, premier poste de consommation d’´energie en france. [Online]. Avail-able: https://www.lenergieenquestions.fr/le-batiment-premier-poste-de-consommation-denergie-en-france/
[2] F. C. Keil, “Explanation and Understanding,” Annual review of psychology, vol. 57, pp. 227–254, 2006. [Online]. Available: http://www.ncbi.nlm.nih.gov/pmc/articles/PMC3034737/
[3] F. Heider, The Psychology of Interpersonal Relations. Psychology Press, 1958.
[4] E. Sober, “Common Cause Explanation,” Philosophy of Science, vol. 51, no. 2, pp. 212–241, 1984.
[5] R. A. Wilson and F. Keil, “The Shadows and Shallows of Explanation,” Minds Mach., vol. 8, no. 1, pp. 137–159, Feb. 1998. [Online]. Available: http://dx.doi.org/10.1023/A:1008259020140
[6] S. P. Lisa SCANU, Pierre BERNAUD and E. WURTZ, “M´ethodologie pour la comparaison de structures de mod`eles simplifi´es.” France: IBPSA, 2016. [7] M. Amayri, S. Ploix, and S. Bandyopadhyay, “Estimating occupancy in an office setting,” in Sustainable Human Building Ecosystems, Carnegie Mellon University, Pittsburgh, USA, 2015, pp. 72–80.
[8] L. D. Ha, H. Joumaa, S. Ploix, and M. Jacomino, “An optimal approach for electrical management problem in dwelings,” Energy and Buildings, vol. 45, pp. 1–14, february 2012.
[9] S. P. P. R. Amr ALZOUHRI ALYAFI, Monalisa PAL and S. BANDY-OPADHYAY, “Differential explanations for energy management in build-ings.” United kingdom: IEEE, 2017.
[10] E. Reiter and R. Dale, “Building applied natural language gener-ation systems,” Nat. Lang. Eng., vol. 3, no. 1, pp. 57–87, Mar. 1997. [Online]. Available: http://comp.mq.edu.au/ rdale/publications/pa-pers/1997/jnle97.pdf
[11] F. Portet, E. Reiter, A. Gatt, J. Hunter, S. Sripada, Y. Freer, and C. Sykes, “Automatic generation of textual summaries from neonatal intensive care data,” Artificial Intelligence, vol. 173, no. 7–8, pp. 789–816, 2009.
[12] N. McIntyre and M. Lapata, “Learning to tell tales: A data-driven approach to story generation,” in ACL 2009, Proceedings of the 47th Annual Meeting of the Association for Computational Linguistics and the 4th International Joint Conference on Natural Language Processing of the AFNLP, 2-7 August 2009, Singapore, 2009, pp. 217–225. [Online]. Available: http://www.aclweb.org/anthology/P09-1025
[13] O. Vinyals, A. Toshev, S. Bengio, and D. Erhan, “Show and tell: A neural image caption generator,” in IEEE Conference on Computer Vision and Pattern Recognition, 2015.
[14] C. . Berment, V. et Boitet.
[15] R. . Boitet C., “”dse-1”— le point sur ariane-78 d´ebut 1982. contrat adi/cap-sogeti/champollion (3 vol.), geta, grenoble, janvier 1982, 616 p.”
[16] C. Ghiaus, “Fault diagnosis of air conditioning systems based on qualitative bond graph,” Energy and Buildings, vol. 30, no. 3, pp. 221 – 232, 1999. [Online]. Available: http://www.sciencedirect.com/science/article/pii/S037877889800070X [17] B. Bredeweg, A. Bouwer, J. Jellema, D. Bertels, F. F. Linnebank,
and J. Liem, “Garp3: A new workbench for qualitative reasoning and modelling,” in Proceedings of the 4th International Conference on Knowledge Capture, ser. K-CAP ’07. New York, NY, USA: ACM, 2007, pp. 183–184. [Online]. Available: http://doi.acm.org/10.1145/1298406.1298445 [18] A. A. N. de la recherche. (2015) Involved project. [Online]. Available:

![Figure 3: The reference model of the physical model [6]](https://thumb-eu.123doks.com/thumbv2/123doknet/14359746.502394/6.892.334.559.214.390/figure-reference-model-physical-model.webp)