Analysis of the 1996 Summer Olympic Games on Real Estate Markets in Atlanta by
Susan M. Simmons B.A. Economics, 1992
Boston College
Submitted to the Department of Urban Studies and Planning in Partial Fulfillment of the Requirements for the Degree of Master of Science in Real Estate Development
at the Massachusetts Institute of Technology September, 2000
C 2000 Susan M. Simmons All Rights Reserved
The author hereby grants to MIT permission to reproduce and distribute publicly paper and electronic copies of this thesis document in whole or in part.
Signature of Author
I5epartment of Urban Studies and Planning August 2, 2000 Certified by William C. Wheaton Professor of Economics Thesis Supervisor Accepted by William C. Wheaton
Chairman, Interdepartmental Degree Program in Real Estate Development
MASSACHUSETTS INSTITUTE OF TECHNOLOGY
SEP 1 4 2000
ANALYSIS OF THE 1996 SUMMER OLYMPIC GAMES ON REAL ESTATE MARKETS IN ATLANTA
by
SUSAN M. SIMMONS
Submitted to the Department of Urban Studies and Planning on August 2, 2000 in partial fulfillment of the requirements for the
Degree of Master of Science in Real Estate Development ABSTRACT
Among all sporting events, the Summer Olympic Games are the most watched event around the globe. Global participation, diversity of events and sheer athletic skill attract billions of viewers to the seventeen-day summer event. The increasing interest in the Games has only served to promote greater commercialism for the event; and for the host city, greater opportunities to showcase itself to future business and leisure travelers. The recent bribery scandal involving the Salt Lake City, Utah bid committee demonstrates the lengths at which some cities have gone to win an Olympic host bid. In contrast with the situation over twenty years ago where the City of Los Angeles was the only bidder for the 1984 Games, sixty-six cities expressed their interest in hosting the 2008 Summer Games.
Why is there such intense interest in winning a bid to host the Olympic Games? What are the real payoffs from hosting this event? Do the benefits outweigh the tremendous costs for the host city? Does the significant one-time investment produce long-term economic gains? This study does not attempt to answer all of these questions at this time. Instead, the focus of this study is to understand how these questions apply to one particular host city, the City of Atlanta, Georgia, host of the 1996 Summer Olympic Games. In particular, this study measures the long-term impacts on real estate markets in Atlanta through both quantitative analysis of economic variables and qualitative analysis of the physical, organizational and psychological impacts.
In contrast with the two previous host cities, Barcelona and Seoul, that spent many billions of public and private (but mostly public) dollars transforming their city in preparation for the Games, Atlanta relied upon primarily private funds to prepare for the 1996 Games. Public funds were spent for some important infrastructure improvements, but these investments would have likely taken place at some future point without the Games. Even so, within a five year period, more than $2 to 3 billion was spent to prepare Atlanta for the Games. This study determines that this Olympic investment had minimal impact on the fast-growing regional market. In most cases, the Olympics were no more significant than other factors, such as corporate expansion and relocation, in contributing to long-term economic growth. In the local in-town markets, the Olympics did meaningfully contribute to growth in the multi-family sector.
In addition to new and renovated sports facilities, the Olympics left downtown Atlanta with many notable legacies that are fueling urban growth and revitalization: a new 21 acre park, renovated parks and public plazas, new street lighting, tree plantings, and other streetscape improvements, 9000 units of student housing, and thousands of new residents living in converted buildings downtown. The Olympics may not have transformed Atlanta to the extent they did in Barcelona and areas of Seoul; however, it certainly proved to be a catalyst for many important changes in the city today.
Thesis Supervisor: William Wheaton
Table of Contents
Introduction 3
Chapter 1. Olympic Background 10
Chapter 2. Overview of the Atlanta Metropolitan Market 18
Chapter 3. Atlanta's Planning and Hosting of the 1996 Summer Games 24
Chapter 4. Hallmark Event Theory and Study Methodology 39
Chapter 5. Olympic Impact on Regional Employment and Construction 46
Chapter 6. Olympic Impacts on Atlanta's Hotel Markets 55
Chapter 7. Olympic Impact on Atlanta's Housing Markets 73
Chapter 8. Olympic Legacy and other Urban Revitalization Programs 92
Chapter 9. Summary and Conclusions 100
Bibliography 105
List of Tables and Graphs
Table 1-1 Games of the Olympiad 12
Table 1-2 Olympic Interest, 1984 - 2008 17
Table 1-3 Revenue Share from Broadcast and Sponsorship Rights, 1984 - 2000 18
Chart 2-1 City of Atlanta Population, 1900-1998e 20
Chart 2-2 Comparison of Annual Percentage Change in Local and Regional Population 21 Table 2-1 Atlanta MSA Compound Annual Employment Growth by Industry, 1980 - 1998 21 Chart 2-3 Atlanta MSA Employment by Major Industry Group, 1998 22 Chart 2-4 City of Atlanta Employment by Major Industry Group, 1998 22
Chart 2-5 Annual Growth in Atlanta MSA Housing Units 24
Chart 2-6 Atlanta MSA House Price Index 24
Table 3-2 ACOG Cumulative Financial Statement, April 1997 27
Table 3-2 Summary of Olympic Venue Construction Projects 29
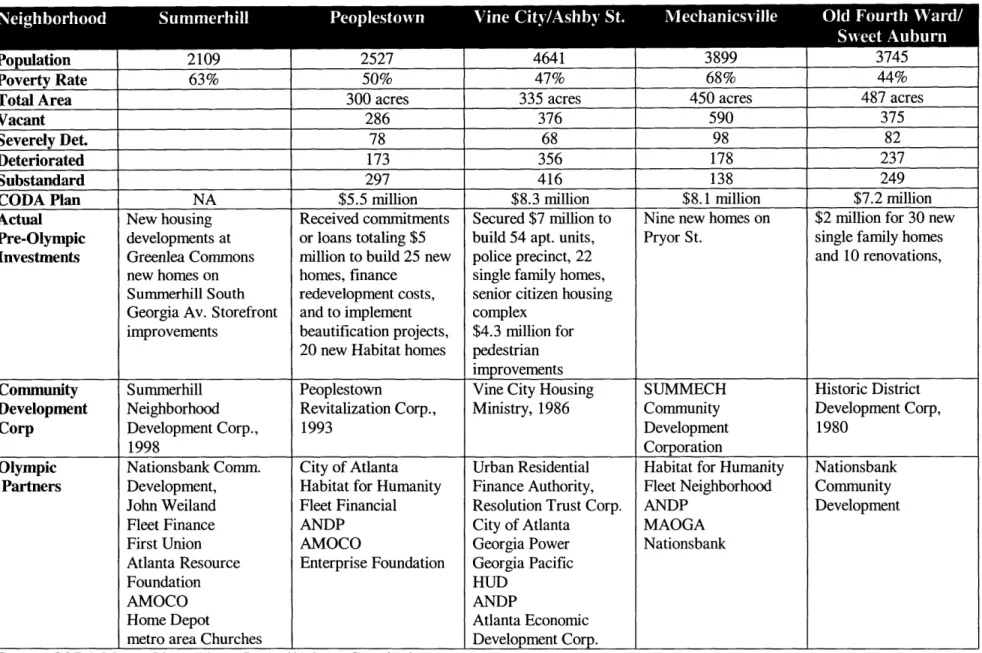
Table 3-3 Pre-Olympic Community Redevelopment 35
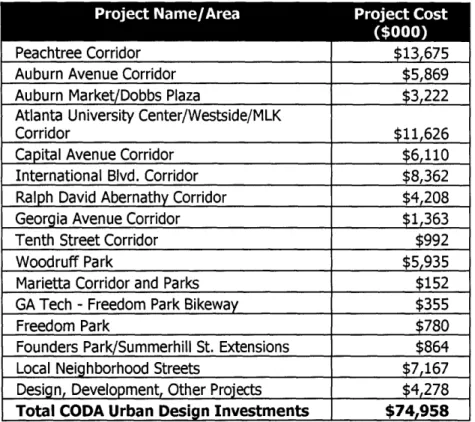
Table 3-4 CODA Urban Design Projects 36
Table 4-1 Summary of Estimated Economic Impacts from 1996 Olympic Games 41
Chart 4-1 Long term Impact Case 1 43
Chart 4-2 Long-term Impact Case 2 43
Chart 4-3 Long-term Impact Case 3 43
Chart 5-1 Annual Change in Atlanta MSA Total, FIRE and Construction Employment 47 Chart 5-2 Annual Change in Atlanta MSA Total, Services and Lodging Employment 48 Table 5-1 Summary of Olympic Impact on Atlanta MSA Employment 49 Table 5-2 Analysis of Pre-and-Post Olympic Employment Impact 50
Chart 5-3 Atlanta MSA Monthly Employment Trends 51
Chart 5-4 Atlanta MSA Monthly Lodging Employment Trends 51
Chart 5-5 Atlanta MSA Monthly Services Employment Trends 52
Table 5-3 Summary of Olympic Impact on Atlanta MSA Construction 54
Chart 6-1 Atlanta MSA Property and Room Inventory, 1987-1999 58
Chart 6-2 Comparison of MSA and Downtown Annual Room Growth 59 Table 6-1 Summary of Olympic Impact on Atlanta MSA Hotel Market 60
Table 6-2 Table 6-3 Table 6-4 Table 6-5 Table 6-6 Table 6-7 Table 6-8 Chart 6-1 Chart 6-2 Table 6-9 Table 6-10 Table 6-11 Table 7-1 Table 7-2 Chart 7-1 Chart 7-2 Table 7-3 Table 7-4
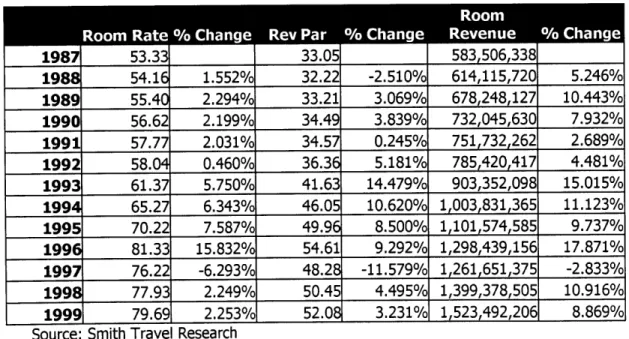
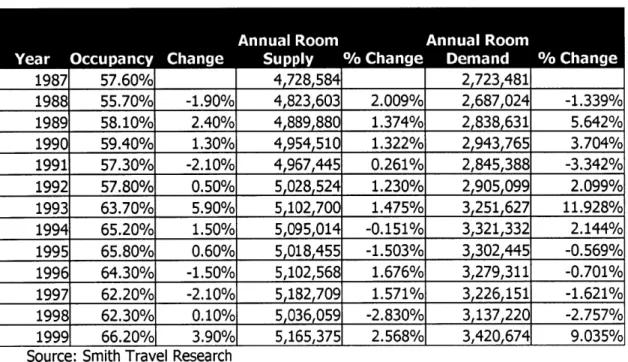
Regional Atlanta Hotel Supply and Demand Regional Atlanta Hotel Rates and Revenues Atlanta MSA Occupancy and Room Rate Trends
Summary of Olympic Impact on Atlanta Downtown/Midtown Hotel Market Analysis of Olympics on Local and Regional Hotel Market Trends
In-town Atlanta Hotel Supply and Demand In-Town Atlanta Hotel Rates and Revenues
Atlanta MSA Regional Hotel Composition, December 1998 Atlanta In-Town Hotel Composition, December 1998 Post-Olympic Downtown Hotel Development/Renovation In-town Hotel's Share of Annual Regional Rooms Sold
Trends in Tourism in the City of Atlanta (Fulton County) Pre and Post Olympics Summary of Olympic Impact on Atlanta Housing Market
Analysis of Olympics on Local and Regional Housing Trends Growth in Downtown Private Housing Stock
Growth in Midtown Private Housing Stock
July 2000 Survey of Apartment Rents in City of Atlanta
Introduction
Few events draw as much international attention as the Games of the Olympiad, commonly referred to as the Summer Olympic Games. Held every four years since their resumption in 1896 by Baron Pierre de Coubertin, the Summer Olympics are the ultimate dream of most world-class athletes, the culmination of years of training and dedication. Along with thousands of athletes, coaches, and sponsors, millions of spectators attend the Olympic Games. Billions more throughout the world view the athletic contests by television, satellite or internet broadcasts during the two-plus week Olympic period.
Second in importance to participating in the Olympic Games is hosting the Olympic Games. In a rigorous selection process beginning years before the said Games are actually held, the International Olympic Committee (IOC) votes for the best candidate city to host the future Games. Hosting the Olympics provides a unique and valuable opportunity to showcase the host city (and, in certain cases, the country) to visitors and worldwide television viewers. The presumed economic and marketing benefits from hosting the Olympic Games have resulted in an exponential increase in interest in hosting the Games during the last two decades. After the tremendous debts from Montreal's 1976 Games, the City of Los Angeles was the only finalist in the IOC's selection process for the host of the 1984 Summer Olympic Games. In contrast, for the 2008 Summer Games, no less than 60 cities expressed their interest and studied their potential to host this event1. As a result, winning a bid to host the games requires incredible dedication and cost.
In late 1998, information surfaced that certain IOC members and the Salt Lake City, Utah, U.S.A. bid committee may have engaged in inappropriate behavior in connection with Salt Lake City's winning bid to host the 2002 Winter Games. Within a few months, various stories regarding cash bribes, free travel, and other large gifts provided to IOC members by Salt Lake City bid officials and individuals related to the Salt Lake City committee surfaced. During this time the IOC undertook a swift internal investigation of the matter, which led to numerous resignations, and reprimands of IOC members. As part of its investigation into the Salt Lake
City scandal, in 1999, the IOC established an Ethics Commission and instituted a series of reforms in the rules governing Olympic bids and the host city selection process. Now, current rule restrict the travel of IOC members to candidate host cities.
The recent scandal involving the Salt Lake City, Utah Bid Committee suggests the bribery practices may extend well beyond the Salt Lake Games. While the investigation focused solely on Salt Lake City, many believe that the actions in Salt Lake City were not an isolated incident. Past Olympic bidding processes may have been less than fair, involving cash bribes, large gifts and preferential treatment to members of the International Olympic Committee responsible for selecting the host sites.
Why are cities so intent on hosting the games that they are willing to resort to illegal activities in order to win this fiercely competitive and political bidding process? Beyond international recognition, what are benefits of hosting the Olympic Games? Do the benefits outweigh the tremendous costs associated with hosting this event? Tourism and leisure academics refer to
events such as the Olympics as "hallmark events". Hallmark events are characterized as "Major one-time or recurring events of limited duration, developed primarily to enhance the awareness, appeal, and profitability of a tourism destination in the short and or long-term. Such events rely for their success on uniqueness, status, or timely significance to create interest and attract attention."2
Such events produce lasting impacts on the host city, including economic, tourism/commercial, physical, socio-cultural, psychological, and political impacts. The significance of these impacts depends on the nature of the event and the organizational approach of event organizers.
At a minimum, the Olympic Games generate a one-time economic shock to the host area (city and state or country depending on size) from new capital investment and tourist revenues. The benefits of this shock depend on the distribution of investment and tourist revenues within a region and whether revenues exceed the costs of hosting this event. After the 1976 Summer
2 Ritchie, J.R.B., "Assessing the impact of hallmark events: conceptual and research issues", Journal of Travel Research, 23, 1, 1984, as cited in Geoffrey Syme et.al. eds. The Planning and Evaluation of Hallmark Events, Avebury, 1989.
Games, Montreal carried approximately $1 billion (U.S.) in debt3. More recently, the Spanish State and the City of Barcelona invested more than $8 billion (U.S) to prepare for 1992 Barcelona Summer Games4. Consequently, the city and state will be paying off these investments for many years. In spite of this debt, the Barcelona Games are viewed as successful in terms of raising the international status of the city and making significant long-term capital
investments for the citizens of this coastal Mediterranean city.
In the last 20 years, similar to the trend throughout professional sports, the Olympic Games have evolved from a pure athletic contest to commercially sponsored athletic event. The value of broadcast rights and commercial sponsorship in the Olympic Games has changed the cost-benefit equation for host cities. In 1984, for the first time ever, the Olympics were organized and run as a private venture. Although contrary to IOC rules which require the Olympics to be managed by the host city, the lack of host city competition gave the IOC no other choice but to accept the LA plan. By limiting new construction, utilizing the facilities of academic institutions, and selling
corporate sponsorships, the organizers of the LA Games demonstrated that the Olympics could be a profitable venture. The LA Olympic experience forever changed the perceptions on the commercial benefits of hosting the Games.
When the City of Atlanta was announced as the host city for the 1996 Olympic Games in 1990, politicians agreed that Atlanta residents would not pay for the games through new taxes. In other words, Atlanta decided to follow a model more similar to L.A. than Seoul or Barcelona. This no-Olympic taxes pledge was viewed favorably by Atlanta; however, in retrospect this approach would limit the potential long-term benefits to Atlantans. Since the post World War II era, the Olympics have provided opportunities for significant investment and development by host cities. Cities such as Tokyo, Mexico City, Munich, Montreal, Moscow, Seoul and Barcelona invested significant capital for the construction of athletic facilities, lodging, and housing in order to host the game. Consequently, the Games left lasting legacy of physical change in these cities in both infrastructure improvements and new residential neighborhoods. Although the Olympics were
3 Chalkley, Brian and Essex, Stephen, "Urban development through hosting international events: a history of the
Olympic Games," Planning Perspectives, 14 (1999), p. 384.
4 Brunet, Ferran, "An Economic Analysis of the Barcelona 92 Olympic Games: Resources, Financings, Impacts", Morganas, Miquel de, and Botella, Miquel, eds., The Keys to Success. The Social, Sporting, Economic and Communications Impacts ofBarcelona'92, Barcelona: Universitat Autonoma de Barcelona, 1996.
estimated to have a $5.1 billion impact on Georgia residents, primarily within the Atlanta area, it is questionable who actually benefited from the games.
Primary criticisms of the Atlanta Games are that the one-time economic impacts were overstated, few Atlanta residents actually benefited from the games, and that low-income residents were more significantly burdened. In a New Statesman article, C. Rutheiser argued that ". . .unlike Barcelona, the American city has failed to use the games to regenerate its poverty stricken heart. It is an object lesson in how not to run a partnership between the public and private sector"5 Similarly, in a 1997 article, another critic wrote: "Low income predominately African American areas of Atlanta were affected most by the preparations for the games. Residents were relocated from at least six public housing projects and many other households in the path of Olympic construction were also moved. For these individuals, preparations for the Olympics cost them the use value of their homes and neighborhoods."6 While some question the lasting image and the lost opportunities, four years later, the City of Atlanta still praises and markets its Olympic past.
While the actual economic impact may have been less than the initial $5 billion estimate, the Games may have had a more significant impact than initially suggested. Given the investment in facilities and infrastructure in preparation for the games, the marketing exposure from the games, and the private investment in lodging and housing, hosting the games should have some impact, either positive or negative, on real estate markets host cities. The purpose of this study is to examine the long-term economic impact of the 1996 Olympic Games on metropolitan and local Atlanta real estate markets. The metropolitan Atlanta region has undergone tremendous growth in the last two decades. Some of the key questions that will be addressed in this study are:
e How did the Olympics affect Atlanta's regional real estate markets, in particular, the housing and hospitality markets? Did the Olympics contribute to the growth of this already hot market?
* How did the Olympics affect local, in-town housing and hospitality markets? Was the impact simply a one-time economic shock or did it have lasting affects on growth patterns?
5 Rutheiser, Charles, "How Atlanta lost the Olympics," New Statesman, July 19, 1996, p. 28.
6 Newman, Harvey K., "Neighborhood impacts of Atlanta's Olympic Games," Community Development Journal,
" Are these Olympic impacts quantifiable and measurable on either a macro-economic or
micro-economic basis?
" What are the legacies of the Olympics and how are they affecting current property markets?
In order to answer these questions, this study analyzes Atlanta's real estate markets on both a qualitative and quantitative basis. This study reviews the preparation, organization, and administration of the 1996 Olympic Games in order to understand how the Olympics affected Atlanta. In the first chapter of this study, a review of the Olympic movement and recent trends is presented to illustrate the changing nature of the Olympic Games and the drivers facing host cities. Second, in order to understand the context in which the 1996 Summer Games were held, Atlanta's recent economic performance and demographic trends are presented. The third chapter reviews the preparations and investments made in anticipation of the 1996 Summer Games by Olympic organizers, as well as public and private organizations. The fourth chapter presents the theory and methodology for the quantitative analysis of Olympic impacts. The fifth chapter presents the results of the quantitative analysis on regional employment and construction. In this section, these results are compared against estimated impacts prepared by Jeffrey Humphrey's and Michael Plummer in a series of studies on the economic impact of the 1996 Olympics presented in Georgia Business and Economic Conditions. The next two chapters present the results of the quantitative analysis of regional and local hotel and housing markets. The quantitative results are explained along with an analysis of recent development activity and trends. Chapter eight discusses the role of specific Olympic legacy programs and Atlanta organizations in on-going redevelopment of the City of Atlanta. Chapter nine summarizes the conclusions from this study.
This study will demonstrate that contrary to the arguments of critics in the years subsequent to the Games, the Olympics left more than a legacy of sporting facilities for the residents of the City of Atlanta. However, these long-term economic impacts are concentrated primarily within the central business district (CBD) in the City of Atlanta and in the neighborhoods surrounding this area. The Olympics left no measurable impact on regional real estate markets in spite of the
In the four years since the Games, the Atlanta's center-city area has experienced the beginnings of a renaissance. Although the Olympics are not the sole reason for this revitalization, they played an important role that is only realized and understood today in looking back at the efforts involved with hosting the 1996 Olympic Games. This study will demonstrate that the Olympics were an important psychological and economic catalyst to the City of Atlanta's current revitalization. First, the Olympics re-introduced many Atlantans to their downtown. Second, the Olympics provided opportunities for one-time high-rent corporate apartment rentals for speculative residential projects. The post-Olympic lease up of these projects demonstrated the demand for downtown housing leading to further projects and a more than doubling the residential multi-family stock from 1995 - 2000. Third, the AHA efforts to improve, redevelop, and privatize its projects through the Olympic Legacy Program has improved the overall environment for in-city housing. Fourth, infrastructure and streetscape improvements made for the Olympics have improved the desirability of in-town real estate markets. Recent initiatives around Centennial Olympic Park should encourage continuing redevelopment of the downtown and inner city neighborhoods.
Chapter 1. Olympic Background
History of the Olympic Movement
The modem Olympic movement began more than one hundred years ago with the resumption of the ancient Olympic Games by the Baron Pierre de Coubertin, a French educator. De Coubertin established the International Olympic Committee and, among other things, set forth the tradition of holding the games in a different city every four years as a means to extend and expand the Olympic spirit throughout the world7. In 1896, not a single real athletic stadium existed in the world8. Thus, one of Coubertin's objectives would be to create the proper physical environment for the participation, viewing and celebration of sports and the arts. In fact, Coubertin envisioned an Olympic City whose function did not end with the beginning and end of the Games. While Coubertin never lived to see his city, due to the size and scale of modem Olympic Games, hosting this event requires the physical and organizational infrastructure of a city.
A network of organizations, centrally managed by the IOC, controls the modem Olympic Movement. According to the Olympic Charter, the primary role of the IOC is the promotion of the principles of modem Olympism9. The IOC establishes the regulations and policies of the Olympic Games and coordinates the selection process for the site of the Summer and Winter. The IOC owns the rights to the Olympic symbols, flag, motto, anthem and the Olympic Games. IOC Members are delegates that represent the IOC in member countries. The IOC includes among its members active athletes and presidents or senior leaders of the international sports federations (IFs), National Olympic Committees (NOCs). Members serve a seven year term which may be renewed until age 70, if nominated prior to December 1999, or until age 80, if nominated after December 1999.10
7 Chalkley, Brian and Essex, Stephen, op. cit., p. 372.
8 Gordon, Barclay, Olympic Architecture Buildingfor the Summer Games (New York: John Wiley & Sons, 1983), p.
2.
9 According to the Principles preceding the Olympic Charter, Olympism is defined as "a philosophy of life, exalting and combining in a balanced whole the qualities of body, will and mind. Blending sport with culture and education, Olympism seeks to create a way of life based on the joy found in effort, the educational value of good example and respect for universal fundamental ethical principles."
In addition to the IFs and NOCs, the Olympic network also includes the site specific Organizing Committees of the Olympic Games (OCOG). Each organization has a defmed role in the Olympic Movement. The IFs establish the rules for participation and competition in each sport, including the design and specifications of sports facilities. In addition to providing training centers for athletes, the NOCs organize their country's teams that will participate in the Olympic Games. The NOCs are also responsible for designating a city to be a bid applicant to the IOC as part of the host city selection process. Once a city has been selected to host the Games in the IOC process, it forms an OCOG responsible for the organization and management of the Olympic Games, including the construction of required sport arenas, stadiums, etc. all in accordance with the policies of the IOC, IFs, and the Olympic Charter.
The IOC selection process was revised in December 1999 to implement a two-stage process for candidates: a bid acceptance phase and final bid phase. This change was designed to limit final bidding process only to cities that are adequately prepared and in compliance with IOC. Thus, helping unprepared or unlikely-to-win cities avoid the unnecessary expense of completing a final bid package.
Chronology of the Modern Games
In 1896, the first modern Olympics were held in Athens, Greece. Approximately 311 athletes from 13 countries participated in these Games. With the exception of the Panathenean Stadium, few facilities were constructed in order to stage this event. Various sources document the history of the modern games from its initiation in Athens through the present. Table 1-1 provides a chronological listing of the host cities for the past and future Summer Olympic Games."
Table 1-1
Games of the Olympiad Year Number
Site
1896 I Athens, GRE
1900 II Paris, FRA
1904 III St. Louis, USA
" Given the focus of this study on the City of Atlanta, host of the 1996 Summer Games, data is reported for Summer Olympic Games. In contrast with the Summer Olympic Games which are held primarily in urban locations, Winter Olympic Games which began in 1924, are held in less populated, mountainous regions. Thus, in comparing Atlanta to other Olympic sites, only sites of Summer Olympic Games are referenced.
Year Games of the Olympiad
Number Site
1906 Intercalated Athens, GRE
1908 IV London, GBR
1912 V Stockholm, SWE
1916 VI Cancelled
1920 VII Antwerp, BEL
1924 VIII Paris, FRA
1928 IX Amsterdam, HOL
1932 X Los Angeles, USA
1936 XI Berlin, GER
1940 XII Cancelled
1944 XIII Cancelled
1948 XIV London, GBR
1952 XV Helsinki, FIN
1956 XVI Melbourne, AUS
1960 XVII Roma, ITA
1964 XVIII Tokyo, JPN
1968 XIX Mexico City, MEX
1972 XX Munich, FRG
1976 XXI Montreal, CAN
1980 XXII Moscow, URS
1984 XXIII Los Angeles, USA
1988 XXIV Seoul, KOR
1992 XXV Barcelona, ESP
1996 XXVI Atlanta, USA
2000 XXVII Sydney, AUS
2004 XXVIII Athens, GRE
2008 XXIX TBA, 2001
Source: Olympic Almanac web site,
http://www98.pair.com/msmonaco/Almanac/
Although the focus of this study is the 1996 Olympic Games, a review of the modern Olympic Movement is useful in understanding the trends that led up to the 1996 Atlanta Games and the resulting criticisms of the Atlanta experience. While recent host cities cities such as Montreal, Barcelona and Seoul did spend significant amounts in preparing to host the Olympic Games in contrast with Los Angeles and Atlanta, these cities, like Rome in 1960 and Tokyo in 1964, each required different amounts of infrastructure investment as part of the City's own long-term development plans. Thus, in many cases, the Olympics prompted or accelerated public infrastructure investments by host cities. As will be presented below, for various circumstances including lack of funds and availability of existing facilities, some host cities have spent billions to host the games, while others played host with limited new investments. Atlanta and L.A. were
by no means the first to avoid excess expense with hosting the Games. There have been few, if any, comprehensive studies that analyzed or quantified the long-term economic benefits from substantial Olympic investment. This study makes no attempt to evaluate the merits of these past Olympic investments but presents these prior host cities as a comparison to the Atlanta Games.
Chalkley and Essex's Four Phase Characterization
A recent study by Chalkley and Essex on the history of urban development related to the Olympics categorizes the modern Olympic Movement into four phases, each having progressively more significant impacts on the Olympic host city'2. Chalkley and Essex' four phase categorization is a useful structure to present a brief review of Olympic development trends leading up to the Atlanta Olympic Games. However, in recognizing the significance of increased commercialization in the hosting of the Olympic Games, the discussion below separates Phase Four into a two distinct sub-phases: the period before the 1984 Los Angeles Games and the period after, and including, the 1984 Games.
Phase One, including the 1896 to 1908 Games, represents the early Olympic period when the games were relatively small in scale and still evolving into a formal, regular, international event. During this evolutionary time, Olympic organizers were preoccupied with such basic issues such as amateur participation, number and type of Olympic events, and regulation of the Games.
13 Thus, the Games had virtually no impact on the urban fabric of the host cities
Phase Two, including the 1908 to 1932 Games, is characterized by increasing size of the Games and the construction of facilities specifically for the purpose of hosting the Olympic Events. Concerns such as lodging for athletes and visitors and financial costs of hosting the Games were becoming increasingly significant. Technological breakthroughs led to increased media coverage and subsequent interest in the Games. Although the 1924 Paris Games provided barracks for athletes near the Colombes stadium, the 1932 Los Angeles Games proposed the first Olympic Village providing lodging, board and local transport for all participating athletes on a substantial scale.
12 Chalkley, op. cit. p. 374.
Phase Three, including the 1936 to 1956 Games, signifies a trend towards increasing scale and significance of the Games following the 1932 Los Angeles Olympic Games. For example, the 1936 Berlin Games were notable not only for the substantial Olympic-related development but also for their showcasing the wealth and organization of the Nazi regime. In addition to the more than 20 new sporting facilities constructed for the Games, a separate Olympic Village was erected beyond the western suburbs of Berlin. A ceremonial boulevard, the Via Triumphalis, was routed from the center of the Old City through Brandenbourg Gate to the redeveloped Olympic Sports Complex in Grunewald. World War II led to the cancellation of the 1940 and 1944 Games and a short reversal of the Berlin trend. In the first post-war Games in London in 1948, no new facilities were constructed for these Games. For the 1952 Helsinki Games, the city built new a stadium, Olympic Park, as well as other sport venues; however, many had been constructed more than 12 years before the Games when Helsinki had been asked to host the 1940 Games. The Olympic Village had already been converted for residential use and the new village as well as a separate village for Soviet athletes had to be constructed again for the Games. The 1956 Melbourne Games resulted in limited construction. The most significant facility constructed, the aquatic center, was dismantled after the Games due to the high cost of maintenance.
Chalkley and Essex define Phase Four in the Olympic Movement as the period from the 1960 to 1996 Summer Games. This phase, they argue was characterized by both an increasing investment in sporting facilities and substantial improvements in urban infrastructure. However, there are various reasons for the degree of investment undertaken in preparation for the Games. For example, for the 1960 Games in Rome, the city invested in a new municipal water system, new airport facilities, improved public transport, street lighting, and other streetscape improvements in addition to sporting venues. Many of public infrastructure investments were made to raise the living standards for residents after the Games. Similarly, for the 1964 Tokyo Games, the city accelerated its planned investments in recreation and sports venues, road improvements, harbor developments, housing and tourist accommodations. Other upgrades to the water supply and sewage treatment system were also prompted by the 1964 Games.
Mexico's staging of the 1968 Games reversed the trend established by Rome and Tokyo in terms of substantial Olympic-related public infrastructure investment. Mexico undertook some new construction but renovated a number of existing facilities including University City Stadium for the Games. Mexico's decentralized plan for the Games maximized the use of existing facilities. The primary legacy of the 1968 Games was the two Olympic Villages (i.e., one for athletes and journalists, another for judges and entertainment teams) which became residential communities following the Games. In all subsequent Games with the exception of the 1984 Los Angeles Games and the 1996 Atlanta Games, host cities not only made substantial investments in new sports facilities and Olympic Villages but also in related public infrastructure projects (i.e., roads, transit systems, highways, airports, etc.) in preparation for hosting the Summer Olympic Games. In some cases, investments were made at substantial costs requiring long term public financing from state and national governments.
Increased Commercialism and The Los Angeles Experience
After the substantial investment and indebtedness following the 1976 Montreal Games, interest in hosting the Olympics waned. Few cities and countries saw themselves able to take on the development programs initiated by host cities in the post-World War II era. Consequently, the City of Los Angeles was the only finalist for the 1984 Summer Olympic Games. For the first time, the Olympics were managed by a private, for-profit entity, an exception by the IOC given the lack of competition to host the 1984 Games. Few facilities were constructed for the Los Angeles Games. The 1932 Olympic Stadium along with various University facilities was used to stage the Games. Events were scattered widely throughout the metropolitan area. Student residences were used to house athletes. Renovations to existing facilities and temporary seating were used to stage certain events. In spite of the lack of construction, the LA Games marked a turning point in the Olympic movement. The LA Games demonstrated that the Olympics can have a substantial economic impact for organizers. Due to increased value for television broadcast rights and the introduction of large scale corporate sponsorship programs, the Games produced a $215 million surplus for organizers'5. LA's commercial success prompted new interest in hosting the games.
14 Gordon, op. cit., p. 106. 15 Chalkley, op. cit., p.3 8 4.
Criticism of Atlanta Games primarily stems from a comparison of the two previous Olympic hosts, the cities of Seoul and Barcelona. In both cases, these cities incorporated major urban investment and renovation into their Olympic development program, including the significant redevelopment of blighted areas. In Seoul, the Chamsil area to the southeast of the city, a polluted, frequently flooded, residential area underwent substantial transformation in preparation for the 1988 Games. In Barcelona, Olympic development, including the construction of the Olympic Village in the Parc de Mar area rejoined 5.2 km of coastline to the residents of Barcelona. Both Seoul and Barcelona made substantial investment in public infrastructure, including transport management, streetscape beautification, and cultural promotion. New parks, arts centers, and shrine and museum renovations accompanied the preparation for the Games. Atlanta did not attempt a Barcelona or Seoul-scale of urban transformation as part of its preparation for the 1996 Games. However, as will be presented later, Olympic investments have contributed to a post-Olympic urban renaissance in downtown Atlanta. A review of the organization, preparations and investments for 1996 Atlanta Games is provided in Chapter 3 of this report.
As illustrated in the Table 1B below, there has been an exponential increase in interest following the 1984 Los Angeles Games. For the 1988 Games, 9 cities expressed early interest in hosting the Games. Two decades later, sixty-six cities were interested in hosting the 2008 Games.
Table 1-2 - Olympic Interest, 1984 - 2008
Olypi Year 1984 198 19 19g00 204 20
Los
Angeles, Seoul, Barcelona, Atlanta, Sydney, Athens,
Host City USA KOR ESP USA AUS GRE TBD
Interested Cities 9 9 22 28 35 48 66
Finalists 1 2 6 6 5 5 TBD
Runner-Ups* 0 0 0 0 0 6 TBD
Total Final Candidates 1 2 6 6 5 11 10
Former Bidders 8 7 16 22 30 37 56
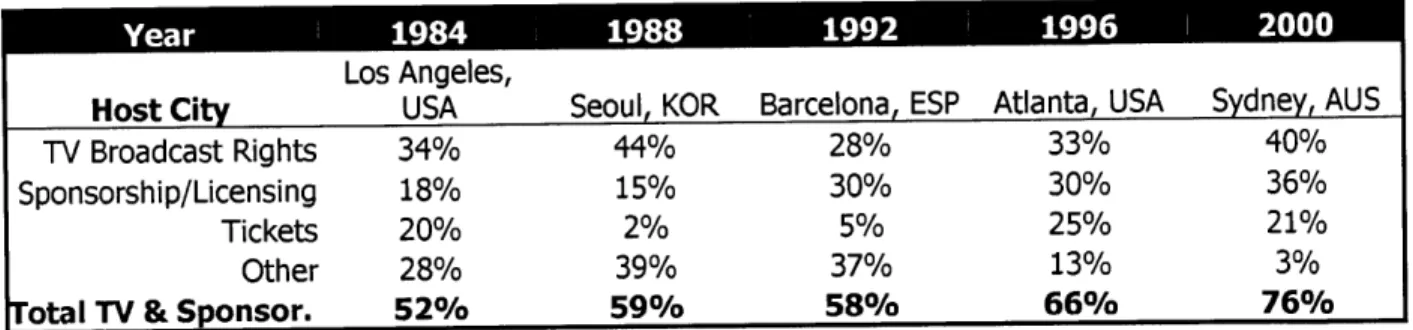
As shown in Table 1-3 below, since the 1984 Games, television broadcast rights and corporate sponsorships provide approximately 50 to 75% of the revenue source used to fund the hosting of the Games.
Table 1-3 - Revenue Share from Broadcast and
Sponsorship Rights, 1984
-200016
Los Angeles,
Host City USA Seoul, KOR Barcelona, ESP Atlanta, USA Sydney, AUS
TV Broadcast Rights 34% 44% 28% 33% 40%
Sponsorship/Licensing 18% 15% 30% 30% 36%
Tickets 20% 2% 5% 25% 21%
Other 28% 39% 37% 13% 3%
Total TV & Sponsor. 52% 59% 58% 66% 76%
16 Compiled from multiple sources: 1984 - 1992 data as reported in Boston Organizing Committee Report, Steps
Toward a Boston Olympics: A Study on the Feasibility of Hosting the 2008 Games, March 1994, 1996 data as reported in Atlanta Committee for the Olympic Games, Official Report of the Games of the XXVI Olympiad, 2000 data per 1997 Sydney Olympic Budget posted on www.olympics.com.
Chapter 2. Overview of the Atlanta Metropolitan Market
Population
The Atlanta metropolitan area has been one of the fastest growing areas in the United States over the last decade. The Atlanta metropolitan area commonly refers to the region comprising the following ten counties: Cherokee, Clayton, Cobb, DeKalb, Douglass, Fulton, Fayette, Gwinnett, Henry, and Rockdale. However, in certain cases (i.e., for federal and census data reporting purposes), the Atlanta metropolitan statistical area (Atlanta MSA) refers to a larger 20 county region including the additional ten counties of: Barrow County, Bartow County, Carroll County, Coweta County, Forsyth County, Newton County, Paulding County, Pickens County, Spalding County, Walton County. In this study, data from the Atlanta MSA refers to the 20 county region unless otherwise noted.
Reflecting the national trend of sunbelt areas, the population of the Atlanta MSA has been steadily climbing over the last two decade. With cheaper land, better climate and a healthy job market, the Atlanta region continues to draw an influx of residents from the northeast and Midwest regions as well as smaller cities in the Southeast. For southerners, Atlanta offers the largest job market in the region. In the last decade, Holiday Inn, United Parcel Service, Home Depot and Hitachi Electronic relocated their headquarters to the Atlanta Metropolitan Area due to the favorable economic climate and high quality of life." Within the 10 county area, total population has increased more than 26% (in 20 county area, the increase is almost 30%)18. The annual compound growth rate for the Atlanta MSA (10 county) has been 2.4% from 1990 to
1999.
The city of Atlanta exists primarily within the county of Fulton; however, a small portion lies within the county of DeKalb. In contrast with the larger metropolitan area, the city of Atlanta has been undergoing much slower growth in the last decade, a trend which dates prior to 1990. In fact after steady increases throughout much of the 2 0th century, Atlanta's population experienced
dramatic decline beginning around 1970. In the last decade, the population appears to be 17 CB Richard Ellis 1st Quarter 2000 Office Report.
18 All population calculations based on data from the U.S. Census Bureau, Population Estimates for Metropolitan
leveling off around 400,000 residents. Chart 2-1 below shows the U.S. Census Bureau population statistics for the city of Atlanta from 1900 to 1998 (estimated).
Chart 2-1
City of Atlanta Population, 1900 to 1998e
600,000 -500,000 -400,000 -300,000 200,000 100,000 0 I I I 1900 1910 1920 1930 1940 1950 1960 1970 1980 1990 1998
As shown in the chart, the population of the City of Atlanta declined by 20 percent from 1970 to 1990 even as the region's population more than doubled. According to a recent study by Research Atlanta, this loss has been heavily concentrated among the white residents, which fell by nearly half during the period. The greatest loss occurred among white school age children, although non-white school age population declined substantially (about 20 percent) during the 1980s. The number of black female-headed households nearly doubled in the 1980s and 58 percent of all households in the City now consisting of only one adult19.
Over the last decade, Fulton and DeKalb counties were two of the slowest growing areas within the Atlanta MSA. However, the City did show positive growth, reversing the decline that began in the 1970's. In contrast with the regional trend, since the 1990 census, total municipal population has only increased 2.7%; during this period, the compound annual growth rate for the city of Atlanta has only been 0.27 %20. The Chart 2-2 on the next page compares the annual percentage change in population for the city of Atlanta and the ten-county Atlanta MSA.
19 Research Atlanta, A Population Profile of the City of Atlanta: Trends, Causes and Options, 1996.
20 Source: U.S. Census Bureau, Population Estimates for States, Cities and Places, Annual Time Series, July 1990 to
Chart 2-2
Comparison of Annual Percentage Change
in Local and Regional Population
a 4.00% *~3.00% U W 2.00% 5 1.00% 0.00% CL -1.00%
Year
-+- City of Atlanta -=- Atlanta MSASource: US Census Bureau, Population Division Employment Trends
Employment trends mirror population trends in the Atlanta regional and local markets. Consistent with the population trend, there has been much more substantial growth in commercial activity outside the municipal border than within. Regional employment growth over the last decade has been significantly higher than employment growth within the city of Atlanta. During the 1990 to 1998 period, regional employment growth totaled 29% while cumulative employment growth in the city was only 7%21.
Copon Ana Emlymn
Grwt by Inuty 198 - 199 Atlanta Region 4.05% Miscellaneous 8.09% Construction 3.19% Manufacturing 1.31% TCU 3.92% Wholesale Trade 3.99% Retail Trade 4.80% FIRE 3.42% Services 6.23% Government 2.40%
Source: Atlanta Regional Commission
21 Employment calculations from data reported by the Atlanta Regional Commission at
http://www.atlantaregional.com/index.html. Z
The Atlanta metropolitan region is home to some of the largest companies in the world, including Coca-Cola, CNN, The Southern Co., Delta Airlines, and Georgia Pacific. In fact, Atlanta ranks 4th among U.S. cities as the home to the most Fortune 500 companies. Consequently, Metropolitan employment by industry is not relatively concentrated in one area. The largest concentration is in the Services area which, as the Table 2-1 shows, has been growing at the highest rates over the last two decades. Charts 2-3 and 2-4 compare the employment share by major industry in the Atlanta MSA and the City of Atlanta.
Chart 2-3
Atlanta MSA Employment by Major Industry Group, 1998
M Misc
5% N Construction
12% 9%/ 0 Manufacturing
9% 0 Telecom & Utilities * Wholesale
30% 9% M Retail
7% 18% N FIRE
o Services N Govt.
Source: Atlanta Regional Commission
In the city of Atlanta, approximately 65% of employment is concentrated in the Services, FIRE and Government while these industries account for only 50% of regional employment.
Chart 2-4
19%
City of Atlanta Employment by Major Industry Category, 1998
0%
2% E Misc
8 Construction 80/o 8% 0 Manufacturing
6% 0 Telecom & Utilities
U Wholesale
12% a Retail
80/ FIRE
0 Services U Govt.
Source: Atlanta Regional Commission
Atlanta Real Estate Markets
Given this growth in regional population and employment, the regional real estate markets in Atlanta have been relatively strong since the 1980's. The downtown markets have recently begun to heat up. Since the mid 1980's Atlanta's stock of office space has just about doubled. Current office inventory in the Atlanta MSA is at 111 million square feet with approximately 25 million square feet concentrated in the downtown/midtown areas. Vacancy rates in both markets average about 10%.22 Downtown rents which were previously below rents in some suburban sub-markets are now competitive and often exceed the rents in these markets. Demand for space by high technology users and increased awareness of the accessibility of downtown is fueling
this demand.
One example of downtown's resurgence is the new Centennial Tower at 101 Marietta. After the opening of the 1.5 million sq. feet, Atlanta Federal Center in 1997, Insignia Commercial Group renovated 101 Marietta, a 638,000 s.f. tower downtown previously 100% leased to government users. Steve Rothschild of Insignia reported that the planned 36-month lease up was completed in less than 18 months at rents exceeding the pro-forma estimates by 20 to 50%.
Economic growth has also spurred significant regional retail development during the last decade. More than 30 million square feet of new retail space has been added to the regional market since 199323. The majority of this space is in the form of grocery-anchored strip centers and big-box anchored power centers. In addition a number of department store anchored regional malls have opened as well, including the 1.7 million s.f. Mall of Georgia, 1.2 million s.f. Arbor Place, and the Perimeter Mall. Although suburban development has been exceptionally strong, in-town development has lagged. The most significant developments have been the opening of two grocery stores, Publix and Kroger serving in-town residents.
Atlanta's housing markets have tracked the overall regional economic growth. Approximately 600,000 new single family units and 200,000 multi-family units have been added to the regional
22 Colliers International Research Publication, Office 2000.
Chart 2-5 below illustrates the annual growth in new single and multi-units during this period as reported by the U.S. Census Department of Residential Construction..
Chart 2-5
Annual Growth in Atlanta MSA Housing Units
1980-1999
70,000 60,000 50,000 -- --40,000 - Multi 30,000 - 7= 0 Single 20,000 -10,000 -0During this same period, both single family housing prices and monthly rents have more than doubled. Chart 2-6 below illustrates the trend in Atlanta MSA nominal single family home prices as reflected in the Home Price Index calculated by the Office of Federal Housing Enterprise Oversight (OFHEO) from 1975 to 1999.
Chart 2-6
Atlanta MSA House Price Index
180 160 140 120. 100 80 60 40 20 0 stock since 1980.
Chapter 3. Atlanta's Planning and Hosting of the 1996
Summer Games
Prior to the Olympics, Atlanta has had a history of public private partnerships through such organizations as Central Atlanta Progress and its predecessors. However, the Olympics required partnership and cooperation on a scale never before experienced in the Atlanta region. The six-year planning effort involved more than 53,000 volunteers and hundreds of full-time staff to prepare for the 197 Olympic delegations and 5 million spectators. Although a significant number of sports facilities already existed in Atlanta, a number of new facilities and other improvements were required to host the 1996 Olympic Games. This section discusses the planning, organization and administration of the Olympic Games by the Atlanta Committee for the Olympic Games (ACOG) and the numerous related organizations that contributed to the preparation and success of the 1996 Atlanta Summer Games. Through the work of these groups and the various preparations made for the Games, the Olympic legacy continues to be an important force for change in the City of Atlanta.
The decision to pursue an Atlanta Olympic bid is primarily due to the efforts of one man, William Porter "Billy" Payne, a former college athlete and Atlanta attorney2 4. Through Payne's perseverance, Atlanta was selected as the host for the Centennial Olympic Games on September 18, 1990 at an IOC meeting in Tokyo, Japan. Other Atlanta business and political leaders viewed the Olympics as most host city's do, as a means to achieve national and international recognition. While Payne built business support for the Games touting the marketing and economic benefits, to gain public support, organizers assured the public that no new taxes would be instituted to fund the Games. This no-new taxes pledge, more than any other factor, assured the immediate impact of the Games as a stimulus for urban change would not be as far reaching as some would hope.
After winning the bid, a number of new organizations were established to manage the financial, administrative, and operational aspects of hosting the Games. A tri-party agreement between the
24 Information on the planning and hosting in this section was reported in the Atlanta Committee for the Olympic
City of Atlanta, the Metro Atlanta Olympic Games Authority (MAOGA), and ACOG set forth the responsibilities of each entity in the preparation and hosting of the Games. ACOG, a private, non-profit organization, consisting of a coalition of business leaders and elected officials led by Billy Payne, was responsible for the management and day-to-day operations of the Games. ACOG was the central organization responsible for planning all aspects of the Games including facilities construction, marketing, ticket sales, accreditation, medical services, security, negotiation of media contracts, participant lodging and transportation, vendor certification, etc. Since the State of Georgia prohibited the City of Atlanta from assuming the IOC obligation of host cities to fund all necessary expenses in hosting the Games, the tri-party agreement established that ACOG would indemnify the city and state of financial obligations for the 1996 Games. MAOGA, a temporary state agency, was created specifically to oversee ACOGs finances to ensure the long-term financial viability of the Games. MAOGA operated in some respects as the Board of Directors of ACOG. MAOGA met quarterly with ACOG, performed an annual audit of ACOG's finances, and was required to approve all contracts in excess of $250,000.
The Table 3-1 on the following page presents the cumulative revenues and spending (both capital and expense spending) of the ACOG for the planning, management, operation, and closedown of the 1996 Olympic Games. As shown in this table, the largest budget items were for construction and technology.
Venue Construction and Facility Improvements
In order to host the games, ACOG invested a significant sum for the construction and improvement of sporting venues. While the IOC and the IFs established the criteria for venue dimensions, equipment, and accessibility. ACOG's goal was to ensure that the facilities met IOC
and IF requirements as well as their own goals for each sporting venue:2 5 e to achieved symmetry with surroundings,
* to provide post-Game use,
* to produce no long-term negative environmental impact
e to meet accessibility standards for persons with disabilities, and " to be cost-effective
Revenues TOTAL Share
Broadcast Rights $568,290 33.02%
Joint Venture $426,448 24.78%
TOP III (corporate sponsorship) $81,180 4.72%
Ticket Sales $425,140 24.70% Merchandising $31,910 1.85% Other Revenues $188,050 10.93% Total Revenues $1,721,018 Expenses Executive Management $24,898 1.45% Associated Organizations $7,655 0.44% Corporate Services $65,879 3.83%
Olympic Programs & Physical Legacy $67,471 3.92%
Communications & Government Relations $25,553 1.48%
Olympic Ceremonies $26,647 1.55%
Senior Policy Advisor $9,487 0.55%
Operations Management $2,942 0.17% Logistics $41,104 2.39% Transportation $91,545 5.32% Medical Services $3,365 0.20% Accreditation $2,438 0.14% Security $32,743 1.90% Technology $218,983 12.72% Venue Management $37,396 2.17%
Games Services Management $2,053 0.12%
Games Services Marketing $14,662 0.85%
Accommodations $22,136 1.29%
Ticket Sales $35,309 2.05%
Spectator Services $921 0.05%
Food & Beverage Services $21,686 1.26%
Merchandising $17,933 1.04%
Host Broadcast $141,343 8.21%
International Relations $3,355 0.19%
Olympic Village $109,784 6.38%
Olympic Family Relations $9,112 0.53%
Sports $48,460 2.82%
Administration & Human Resources $39,835 2.31%
Construction $494,239 28.72%
Financial & Management Services $69,958 4.06% Non Departmental Reserves ($6,543) -0.38%
Reserves for Contingencies $19,476 1.13%
Reserves for Operations & Construction $19,193 1.12%
The majority of Olympic events were centered in an concentrated area within 2 miles of downtown referred to as the Olympic Ring. A handful of events, including rowing, equestrian and sailing were located outside the Olympic Ring. In total, ACOG spent approximately $500 million for the construction and renovation of facilities used in Olympic events. The largest single investment was the construction of the $200 million Olympic Stadium used for the Opening and Closing Ceremonies as well as the track events.
While a number of new facilities were constructed and these exist as part of Atlanta's Olympic legacy, one of the attractiveness of Atlanta's bid to host the 1996 Games was its existing set of facilities, including the Georgia Dome, the Georgia World Congress Center, Atlanta Fulton County Stadium, Omni Coliseum and various sporting facilities at nearby academic institutions. Where necessary, temporary equipment, flooring, and seating were installed to accommodate Olympic events at these existing facilities. The Georgia Dome, a new facility which opened in 1991, hosted basketball, handball and the gymnastic events. Both the Georgia Dome and the Georgian World Congress Center were large enough to hold multiple events at the same time.
Where it was determined that future use beyond the Games would not be substantial, temporary facilities were constructed or leased. Examples of these facilities include the cycling velodrome, archery range, yachting marinas, and electrical systems at each venue. While organizers were criticized for the use of these temporary structures, ACOG argued that the use of temporary facilities was often more economical on both a short and long term basis.
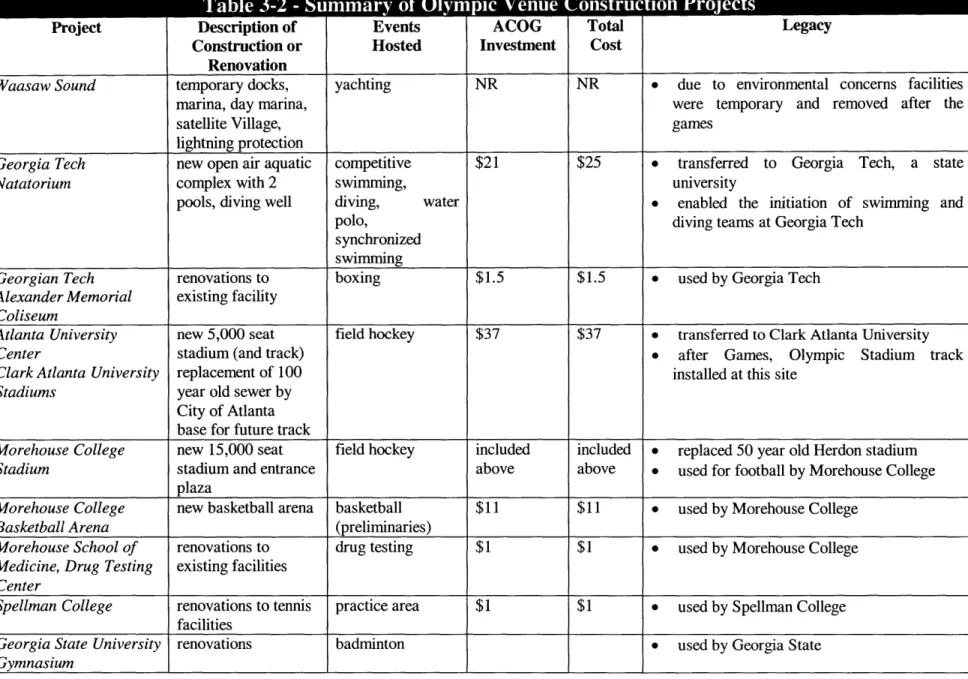
Given the prevalence of academic institutions in the Atlanta area, a number of events were hosted in facilities at these institutions. These institutions also leased facilities to ACOG for practice by Olympic athletes. In many cases, ACOG invested in the renovation of these facilities for the Olympic Games either in lieu of rental lease payment or as required to comply with IF, IOC and ACOG's standards for Olympic venues. ACOG also renovated track, stadium and gym facilities at five Atlanta Public Schools2 6. The table on the following page highlights the major
construction projects managed by ACOG in preparation for the 1996 Summer Games venues.
Project
Table 3-2 - Summary of Olympic Venue Construction Projects
Description of Construction or Renovation Events Hosted ACOG Investment Total Cost Legacy
Olympic Stadium construction of opening, closing $189 $209 e reconfiguration into 45,000 seat baseball
85,000 seat multi- ceremonies, track stadium, Turner Field, home for the Atlanta
purpose stadium in and field events Braves
Summerhill e track given to Atlanta University Center
neighborhood, * removed seating/sections given to Collins
adjacent to Fulton Hill high school for the construction of a
County Stadium new football stadium
Georgian International 32,000 seat arena, dressage, $28 $90 e returned to City of Coyners which
Horse Park, Coyners, 5 barns (360 stalls), jumping, maintains the facility as the Georgia
GA groom housing, 3 day event International Equestrian Center
steeplechase course, * future site plans include addition of golf
cross county course course and hotel
Wolf Creek Shooting outdoor trap and shooting $17 $17 e transferred to Fulton County, owner of the
Complex skeet ranges with existing range on the site
bunkers and indoor
ranges
Stone Mountain Tennis center (hard) court tennis $18 $18 * 4,000 seats removed, given to Stone
Center stadium seating Mountain Park, a state managed park
12,000 e largest tennis facility in southeast U.S.
e used by amateur league, Atlanta Lawn
Tennis Association and others
Stone Mountain Archery archery ranges and archery * temporary venues set up for use during the
Center temporary seating at Games only
center of park * equipment was leased and park returned to
Stone Mountain Cycling steel supported cycling use after the games
Velodrome structure
Lake Laneir Rowing 17,3000 temporary rowing, $10 $10 e transferred to City of Gainesville and Hall
Center seating, permanent canoe/kayak County
judge tower, boat houses and docks
Project
Table 3-2 - Summary of Olympic Venue Construction Projects
Description of Construction or Renovation Events Hosted ACOG Investment Total Cost Legacy
Waasaw Sound temporary docks, yachting NR NR 0 due to environmental concerns facilities
marina, day marina, were temporary and removed after the
satellite Village, games
lightning protection
Georgia Tech new open air aquatic competitive $21 $25 * transferred to Georgia Tech, a state
Natatorium complex with 2 swimming, university
pools, diving well diving, water * enabled the initiation of swimming and
polo, diving teams at Georgia Tech synchronized
swimming
Georgian Tech renovations to boxing $1.5 $1.5 e used by Georgia Tech
Alexander Memorial existing facility
Coliseum
Atlanta University new 5,000 seat field hockey $37 $37 0 transferred to Clark Atlanta University
Center stadium (and track) * after Games, Olympic Stadium track
Clark Atlanta University replacement of 100 installed at this site
Stadiums year old sewer by
City of Atlanta base for future track
Morehouse College new 15,000 seat field hockey included included o replaced 50 year old Herdon stadium
Stadium stadium and entrance above above e used for football by Morehouse College
plaza
Morehouse College new basketball arena basketball $11 $11 e used by Morehouse College
Basketball Arena (preliminaries)
Morehouse School of renovations to drug testing $1 $1 e used by Morehouse College
Medicine, Drug Testing existing facilities
Center
Spellman College renovations to tennis practice area $1 $1 * used by Spellman College
facilities
Georgia State University renovations badminton * used by Georgia State