READ THESE TERMS AND CONDITIONS CAREFULLY BEFORE USING THIS WEBSITE. https://nrc-publications.canada.ca/eng/copyright
Vous avez des questions? Nous pouvons vous aider. Pour communiquer directement avec un auteur, consultez la première page de la revue dans laquelle son article a été publié afin de trouver ses coordonnées. Si vous n’arrivez pas à les repérer, communiquez avec nous à [email protected].
Questions? Contact the NRC Publications Archive team at
[email protected]. If you wish to email the authors directly, please see the first page of the publication for their contact information.
NRC Publications Archive
Archives des publications du CNRC
This publication could be one of several versions: author’s original, accepted manuscript or the publisher’s version. / La version de cette publication peut être l’une des suivantes : la version prépublication de l’auteur, la version acceptée du manuscrit ou la version de l’éditeur.
Access and use of this website and the material on it are subject to the Terms and Conditions set forth at
Contribution to pointing mortar durability
Maurenbrecher, A. H. P.; Suter, G. T.; Trischuk, K. J.; Fontaine, L.
https://publications-cnrc.canada.ca/fra/droits
L’accès à ce site Web et l’utilisation de son contenu sont assujettis aux conditions présentées dans le site LISEZ CES CONDITIONS ATTENTIVEMENT AVANT D’UTILISER CE SITE WEB.
NRC Publications Record / Notice d'Archives des publications de CNRC:
https://nrc-publications.canada.ca/eng/view/object/?id=ce9c6d02-b22d-4687-bd3e-d428995871c0 https://publications-cnrc.canada.ca/fra/voir/objet/?id=ce9c6d02-b22d-4687-bd3e-d428995871c0Contribution to pointing mortar durability
Maurenbrecher, A. H. P.; Suter, G. T.;
Trischuk, K.; Fontaine, L.
A version of this paper is published in / Une version de ce document se trouve dans : International RILEM Workshop on Historic Mortars: Characteristics and Tests, Paisley,
Scotland, 12th-14th May 1999, p. 361-369
MAURENBRECHER, Contribution to pointing mortar durability, 1/8
CONTRIBUTION TO POINTING MORTAR DURABILITY
A H P Maurenbrecher, G T Suter, K Trischuk & L Fontaine
Institute for Research in Construction, National Research Council Canada (author 1 & 3) Dept of Civil Engineering, Carleton University, Canada (2)
Heritage Conservation Program, Public Works & Government Services Canada (4)
Abstract
A measure of the durability of Portland cement, lime mortars suitable for heritage stone masonry was obtained by testing small stack bonded masonry specimens for flexural bond strength, stress-strain under compression and freeze-thaw resistance. The bond strength of the mortar to Ohio stone was generally very poor in contrast to Nepean stone. The poor bond also caused relatively high initial deformation under compressive load. Loss of bond was also the most common form of failure observed during the freeze-thaw tests. Additional factors probably affecting the freeze-thaw resistance of the mortar are air entrainment, carbonation and the higher than expected lime content in the lime putty.
1. Introduction
The work discussed in this paper is part of a testing program to identify durable repair mortars which are compatible with stone masonry [1-3]. The mortar should be durable, practical in application (eg workmanship, quality control), and not have a negative effect on the durability of the stone (eg be sacrificial to the stone). Much of the emphasis of the program is on the freeze-thaw resistance of weaker more deformable, breathable mortars. The mortar is tested using small masonry specimens (prisms) to simulate as much as possible actual conditions. Stack bonded masonry prisms were tested using mortars largely based on 1:2:8 Portland cement:lime:damp sand mixes by volume. Tests included flexural bond strength, stress-strain under compressive load, freeze-thaw resistance, resistance to salts, and lime staining. The first three are discussed in this paper.
2. Test specimens
Twenty-five mortar mixes were evaluated of which two were site mixes (Table 1). All mixes were meant to have pointing mortar consistency except two which had bedding
mortar consistency (2 & 30). Mix proportions, mix ingredients and workability reflect current field practices at the Parliamentary Precinct in Ottawa. All the mixes used white Portland cement except the two site mixes which used sulphate resistant Portland cement. Type S lime was used in the form of dry hydrated lime, lime putty (made from equal weights of hydrated lime and water and stored at least 24 hours) or lime roughage (wet mix of hydrated lime and sand stored at least 3 days before use). Sand was local natural sand with an added coarse fraction to give a rougher texture. Two mixes were made from a proprietary pre-mix mortar (30 & 30a); a coarse sand fraction was also added (8% by volume). An air entraining agent was added to most mortars (as a separate additive or as part of the lime). Most mortars were mixed in a mortar mill, with others mixed by hand, in a paddle mixer and a drum mixer.
Masonry prisms were built using 90 mm wide x 90 mm deep x 30 mm high stone units stack bonded with 10 mm mortar joints. Most of the prisms in these tests used Ohio sandstone with a few using Nepean sandstone. The prisms were built in a jig using a mortar template giving good vertical alignment and a consistent joint thickness. Two prisms had been built beforehand with a Type N masonry cement mortar with the joint raked back 25 mm on one face (10a & 17a). These were then pointed to simulate con-struction in practice. Stone was wetted before concon-struction. Prisms and mortar cubes were cured under plastic for the first 5 days and then in air in a laboratory controlled environment until tested (50±5% RH; 22±2°C). The site specimens were covered in wet burlap for an undetermined period and later stored in a site trailer until being transferred to the laboratory at 26 days.
3. Tested properties
3.1 Material propertiesTable 1 gives the properties of the mortars and the masonry prisms. The Nepean & Ohio stone had strengths of 100 & 65 MPa, bulk densities of 2325 & 2151 kg/m3, porosities of 12 & 22%, and 24 hour water absorption of 2.3 & 5.8%.
3.2 Bond strength between mortar and stone
The flexural bond strength between mortar and stone was assessed using a test arrange-ment based on an ASTM standard [4]. Two, nine stone high, masonry prisms were tested for each mortar mix (total of 16 joints) except the site mixes which used three, six stone high prisms to make them easier to transport. One prism was first tested in compression to determine the elastic compression modulus.
The self-weight of the loading arm applies an initial flexural stress of 0.02 MPa. Many mortar joints in the Ohio stone prisms failed under the weight of the arm. In such cases the bond strength was assumed to be 0.02 MPa, and the second of the two prisms was not tested. With the exception of the proprietary mortar, bond to the Ohio stone was very poor in contrast to the Nepean stone. Results are given in Table 1.
MAURENBRECHER, Contribution to pointing mortar durability, 3/8 3.3 Compressive deformation of masonry specimens
For each mortar mix, strain was measured on both sides of a nine high prism using a 300 mm hand-held Demec gauge (200 mm gauge for the 6 high prisms). The prisms were loaded to a stress of 8.2 MPa representing approximately 30% of the failure stress. Table 1 gives the tangent elastic modulus of the masonry prisms (where an initial large defor-mation occurred, the tangent is measured at the point where the curve straightens out).
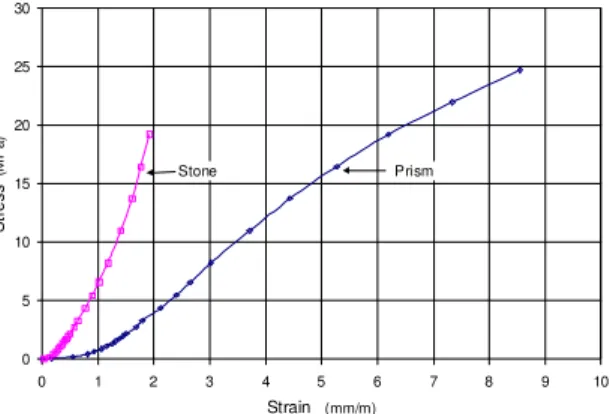
The stress-strain relationship for two prisms tested to failure is shown in figures 1 & 2 (in these the strain on the stone was also measured with electrical resistance strain gauges). The prism with Ohio stone in contrast to the prism with Nepean stone shows an initial large deformation at low stress indicating poor bond conditions at the mortar/stone inter-face. 0 5 10 15 20 25 30 0 1 2 3 4 5 6 7 8 9 10 Strain (mm/m) St re s s (M P a ) Stone Prism
Figure 1 Stress-strain relationship for prism with Ohio stone and mortar mix 17 tested to failure (failure stress 26.8 MPa)
0 5 10 15 20 25 30 0.0 0.5 1.0 1.5 2.0 2.5 3.0 Strain (mm/m) S tre s s (MP a ) PRISM STONE
Figure 2 Stress-strain relationship for prism with Nepean stone and mortar mix 23 tested to failure (failure stress 29.7 MPa)
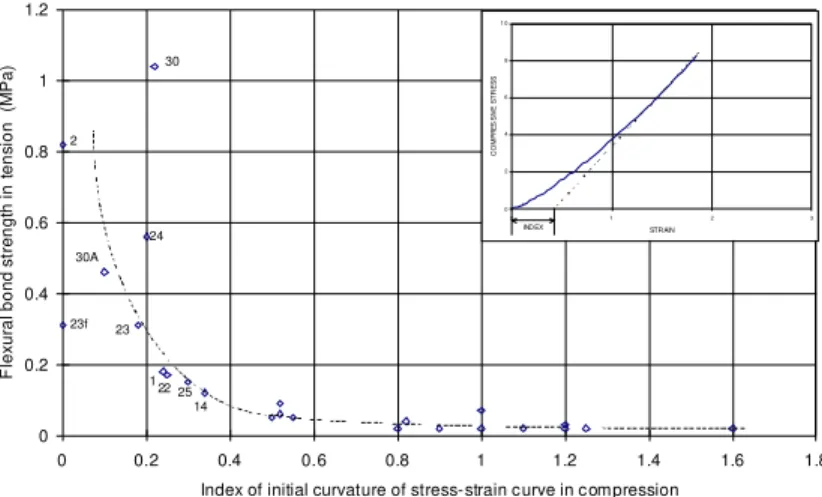
Figure 3 shows the stress-strain relationship for an Ohio stone prism with a good mortar bond. There is hardly any initial deformation. Figure 4 shows the relationship between the degree of initial non-linear deformation and the bond strength. Prisms with poor bond strength had greater initial deformation.
0 2 4 6 8 10 0 0.5 1 1.5 2 2.5 3 Strain (mm/m) St re s s ( M Pa )
Figure 3 Stress-strain relationship for Ohio stone prism with mortar mix 30A
0 0.2 0.4 0.6 0.8 1 1.2 0 0.2 0.4 0.6 0.8 1 1.2 1.4 1.6 1.8
Index of initial curvature of stress-strain curve in compression
F lex ur a l b o nd s tr e n g th in t e n s io n (M P a ) 0 2 4 6 8 1 0 0 1 2 3 STRAIN C O M P R E SS IV E S T R E S S INDEX 30 24 30A 2 23f 23 25 14 1 22
Figure 4 Relationship between bond strength and degree of initial deformation of the stress-strain curve (mortar mix number shown for results with better bond).
MAURENBRECHER, Contribution to pointing mortar durability, 5/8
4. Resistance to frost damage
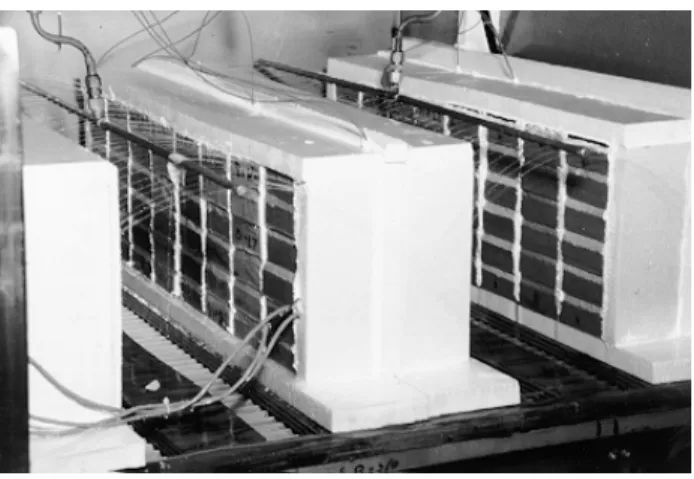
4.1 TestsSix stone high, masonry prisms were tested under uni-directional freezing. This simulates more accurately what occurs in practice. The test was based on a Dutch standard [5]. Freeze-thaw testing began after prisms had achieved at least 28 days curing. The prisms were first immersed in water for 8 days. The average water absorption was 3.5% by weight for the Nepean masonry prisms, and 6.8% for the Ohio prisms. Four rows of prisms were then placed in the freeze-thaw cabinet, jacketed in polystyrene (25 mm on top, bottom and sides, and 50 mm at the back [6]). The 24-hour freeze-thaw cycle was set up as follows:
(1) 8 hours thawing at 15±3°C with a sprinkler continuously spraying water onto the face of the prisms to simulate surface runoff from rain or melting snow (Fig 5).
(2) 8 hours freezing to -12°C (-4°C for the slow freeze cycle). The initial settings of -12 and -4°C were used to achieve the cooling rates specified in the Dutch standard [5], 300±60 & 100±20 W/m2.
(3) 8 hours to -20°C (-5°C for the slow freeze cycle). The Dutch standard specifies cooling down to -15±3°C and -5±1°C. In this test the lower temperature was reduced to -20°C to more closely simulate the more severe conditions in Ottawa.
After 24 cycles the specimens were removed from the cabinet and examined closely for damage. The water content of the prisms had increased a further 0.4 & 0.9% for the Nepean and Ohio prisms repectively (this assumes negligible material loss). Undamaged prisms were reinstalled in the cabinet, and the freeze-thaw cycles continued until a total of 60 cycles was reached (using the fast freeze cycle only). The water content of the prisms increased a further 0.2 & 0.6% for the Nepean and Ohio prisms respectively.
4.2 Results
Results are given in Table 1. Observed failures of the mortar were divided into two categories: failure of the mortar itself in the form of crumbling, horizontal cracks and/or vertical cracks, and bond failure at the mortar/stone interface. Loss of bond was the most common form of failure. Loss of bond may also allow more water into the mortar joint increasing the risk of damage to the mortar itself.
After the 60 cycles, nearly all of the 29 prisms tested had bond failure. Bond failure tended to be less with prisms having better bond strengths but there were exceptions. For example, three joints had debonded in the prism with mortar mix 23 which had given a bond strength of 0.3 MPa, while mix 27 with a bond of 0.03 MPa only had one joint debonded.
After the 60 cycles, nine prisms had mortar failure. This was attributed to various causes. Five had mortar mixes without an air entraining agent. Of these one was also the weakest mix (1:3:12) which was expected to fail. This weak mix and mix 1 also had the lowest workabilities which may contribute to the failure (Vicat cone 8 mm). Another mix (#6) with low workability (9 mm) also failed even though an air entraining agent was added (air entrainment does not seem to be effective at low workabilities).
Three mixes without air entrainment survived when used with Nepean stone (mixes 1, 23 & 24). Mix 24, 1:1:6, was also the strongest mix tested. Mix 17 also survived when used with Nepean stone instead of Ohio stone (it was used in the raked joints of a Nepean stone prism, 17a). The stone properties therefore also affect the mortar as was shown with the flexural bond tests.
Mixes 14, 16 & 17, which failed, formed part of a group to evaluate lime putty. The main contributing factor here is likely to be an excessive amount of lime in the mix compared to the other mixes. A given volume of lime putty was found to contain more lime than the same volume of hydrated lime (16% and 56% more for the two type S limes used). Mortar mixes 16 & 17 with the lime putty with the highest increase in lime both failed after 24 cycles (but mix 17 did not fail in the raked joints of a Nepean stone prism (17a)).
None of the mortars tested had time to achieve significant carbonation. The estimated depth of carbonation from check measurements using a phenolphthalein solution was 3 to 5 mm. The effect of carbonation needs to be further investigated (using prisms with raked mortar joints).
The proprietary pre-mix mortar behaved well. The higher porosity, finer sand grading and good bond may all have influenced the result.
MAURENBRECHER, Contribution to pointing mortar durability, 7/8
5. Conclusions
• Poor bond between mortar and stone leads to increased deformation under compressive load, increased water penetration, and a likely increase in the risk of frost damage. Methods of improving bond need to be further investigated (including the effect of shrinkage on bond which was not checked in these tests). Further tests to check the interaction between bond and frost resistance are also needed.
• Air entraining agents are not likely to be effective for mortars with low workability.
• The method of batching lime (by volume or weight) and the appropriate proportions to add need further evaluation. A given volume of lime putty may have a much larger quantity of lime than the same volume of dry hydrated lime. Mixes made with the lime putty had a lower frost resistance.
6. Acknowledgements
The tests were part of a collaborative research program financially supported by Public Works and Government Services Canada, National Research Council Canada, the Gen-Lime Group and the Chemical Gen-Lime Company.
7. References
1. Fontaine L, Thomson M L & Suter G T. ‘In search of durable repair mortar for historic masonry in northern climates: a prologue’. APT Bulletin. 24 (2) (1998) 39-40.
2. Thomson M L, Suter G T & Fontaine L. ‘Frost durability testing of stone masonry mortars: restoring the Canadian Parliament Buildings’. APT Bulletin. 24 (2) (1998) 42-49.
3. Suter G T, Thomson, M L & Fontaine L. ‘Mortar study of mechanical properties for the repointing of the Canadian Parliament Buildings’. APT Bulletin. 24 (2) (1998) 51-58.
4. ASTM Standard C1072: ‘Measurement of masonry flexural bond strength’. (American Society for Testing and Materials 1994).
5. NEN 2872: ‘Testing of stone like materials - determination of frost resistance (uni-directional freezing in a fresh water environment)’. (Netherlands Standards Institute. 1989).
6. CEN. ‘Draft method of test for masonry units: Part X Determination of frost resistance’. (European Committee for Standardisation. 1996).
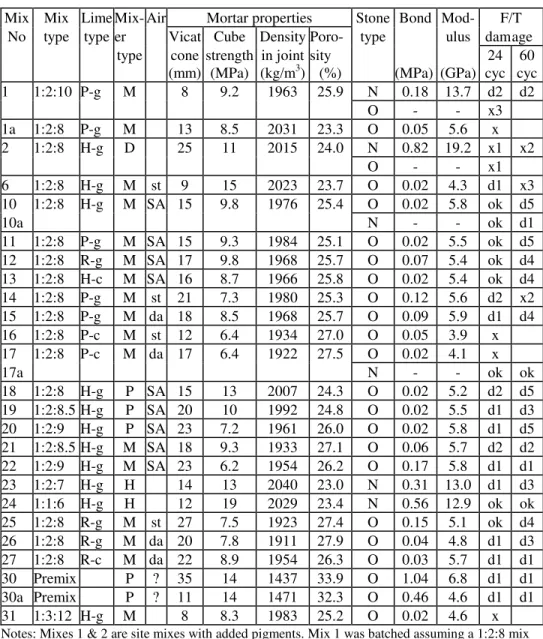
Table 1 Mortar properties and masonry prism test results
Mix Mix Lime Mix- Air Mortar properties Stone Bond Mod- F/T No type type er Vicat Cube Density Poro- type ulus damage
type cone (mm) strength (MPa) in joint (kg/m3) sity (%) (MPa) (GPa) 24 cyc 60 cyc 1 1:2:10 P-g M 8 9.2 1963 25.9 N 0.18 13.7 d2 d2 O - - x3 1a 1:2:8 P-g M 13 8.5 2031 23.3 O 0.05 5.6 x 2 1:2:8 H-g D 25 11 2015 24.0 N 0.82 19.2 x1 x2 O - - x1 6 1:2:8 H-g M st 9 15 2023 23.7 O 0.02 4.3 d1 x3 10 1:2:8 H-g M SA 15 9.8 1976 25.4 O 0.02 5.8 ok d5 10a N - - ok d1 11 1:2:8 P-g M SA 15 9.3 1984 25.1 O 0.02 5.5 ok d5 12 1:2:8 R-g M SA 17 9.8 1968 25.7 O 0.07 5.4 ok d4 13 1:2:8 H-c M SA 16 8.7 1966 25.8 O 0.02 5.4 ok d4 14 1:2:8 P-g M st 21 7.3 1980 25.3 O 0.12 5.6 d2 x2 15 1:2:8 P-g M da 18 8.5 1968 25.7 O 0.09 5.9 d1 d4 16 1:2:8 P-c M st 12 6.4 1934 27.0 O 0.05 3.9 x 17 1:2:8 P-c M da 17 6.4 1922 27.5 O 0.02 4.1 x 17a N - - ok ok 18 1:2:8 H-g P SA 15 13 2007 24.3 O 0.02 5.2 d2 d5 19 1:2:8.5 H-g P SA 20 10 1992 24.8 O 0.02 5.5 d1 d3 20 1:2:9 H-g P SA 23 7.2 1961 26.0 O 0.02 5.8 d1 d5 21 1:2:8.5 H-g M SA 18 9.3 1933 27.1 O 0.06 5.7 d2 d2 22 1:2:9 H-g M SA 23 6.2 1954 26.2 O 0.17 5.8 d1 d1 23 1:2:7 H-g H 14 13 2040 23.0 N 0.31 13.0 d1 d3 24 1:1:6 H-g H 12 19 2029 23.4 N 0.56 12.9 ok ok 25 1:2:8 R-g M st 27 7.5 1923 27.4 O 0.15 5.1 ok d4 26 1:2:8 R-g M da 20 7.8 1911 27.9 O 0.04 4.8 d1 d3 27 1:2:8 R-c M da 22 8.9 1954 26.3 O 0.03 5.7 d1 d1 30 Premix P ? 35 14 1437 33.9 O 1.04 6.8 d1 d1 30a Premix P ? 11 14 1471 32.3 O 0.46 4.6 d1 d1 31 1:3:12 H-g M 8 8.3 1983 25.2 O 0.02 4.6 x
Notes: Mixes 1 & 2 are site mixes with added pigments. Mix 1 was batched assuming a 1:2:8 mix based on dry sand (equivalent to 1:2:10 based on damp sand).
Mortar mixes 30 & 30a: Jahn M110 pointing mortar for limestone & sandstone respectively. Lime types: P=putty; H=hydrated; R=roughage; g & c lime from two different manufacturers. Air entrainers: st & da = liquid air entraining agents. SA = type S lime with dry air entrainer. Mixer type: M=mill; D=drum with granite boulders; P = Hobart paddle mixer; H = mixed by hand. F/T damage: d = debonding + number of joints; x = mortar failure + number of joints.