Publisher’s version / Version de l'éditeur:
Leukos, 4, July 1, pp. 7-29, 2007-07-01
READ THESE TERMS AND CONDITIONS CAREFULLY BEFORE USING THIS WEBSITE.
https://nrc-publications.canada.ca/eng/copyright
Vous avez des questions? Nous pouvons vous aider. Pour communiquer directement avec un auteur, consultez la première page de la revue dans laquelle son article a été publié afin de trouver ses coordonnées. Si vous n’arrivez pas à les repérer, communiquez avec nous à [email protected].
Questions? Contact the NRC Publications Archive team at
[email protected]. If you wish to email the authors directly, please see the first page of the publication for their contact information.
NRC Publications Archive
Archives des publications du CNRC
This publication could be one of several versions: author’s original, accepted manuscript or the publisher’s version. / La version de cette publication peut être l’une des suivantes : la version prépublication de l’auteur, la version acceptée du manuscrit ou la version de l’éditeur.
Access and use of this website and the material on it are subject to the Terms and Conditions set forth at
Energy saving lighting control systems for open-plan offices: a field study
Galasiu, A. D.; Newsham, G. R.; Suvagau, C.; Sander, D. M.
https://publications-cnrc.canada.ca/fra/droits
L’accès à ce site Web et l’utilisation de son contenu sont assujettis aux conditions présentées dans le site LISEZ CES CONDITIONS ATTENTIVEMENT AVANT D’UTILISER CE SITE WEB.
NRC Publications Record / Notice d'Archives des publications de CNRC:
https://nrc-publications.canada.ca/eng/view/object/?id=b23dfd7d-3280-4740-b2fa-c57cd48806e9 https://publications-cnrc.canada.ca/fra/voir/objet/?id=b23dfd7d-3280-4740-b2fa-c57cd48806e9
http://irc.nrc-cnrc.gc.ca
E n e r g y s a v i n g l i g h t i n g c o n t r o l s y s t e m s f o r
o p e n - p l a n o f f i c e s : a f i e l d s t u d y
N R C C - 4 9 4 9 8
G a l a s i u , A . D . ; N e w s h a m , G . R . ; S u v a g a u , C . ;
S a n d e r , D . M .
A version of this document is published in / Une version de ce document se trouve dans: Leukos, v. 4, no. 1, July 2007, pp. 7-29
The material in this document is covered by the provisions of the Copyright Act, by Canadian laws, policies, regulations and international agreements. Such provisions serve to identify the information source and, in specific instances, to prohibit reproduction of materials without written permission. For more information visit http://laws.justice.gc.ca/en/showtdm/cs/C-42
Les renseignements dans ce document sont protégés par la Loi sur le droit d'auteur, par les lois, les politiques et les règlements du Canada et des accords internationaux. Ces dispositions permettent d'identifier la source de l'information et, dans certains cas, d'interdire la copie de documents sans permission écrite. Pour obtenir de plus amples renseignements : http://lois.justice.gc.ca/fr/showtdm/cs/C-42
ENERGY SAVING LIGHTING CONTROL SYSTEMS FOR OPEN-PLAN OFFICES: A FIELD STUDY
Anca D. Galasiu, Guy R. Newsham, Cristian Suvagau, Daniel M. Sander
Anca D. Galasiu (corresponding author) Tel: +1 (613) 993-9670
E-mail: [email protected] National Research Council Canada Institute for Research in Construction Indoor Environment Program
Building M-24, 1200 Montreal Road Ottawa, ON, Canada, K1A 0R6 Guy R. Newsham
National Research Council Canada Institute for Research in Construction Indoor Environment Program
Building M-24, 1200 Montreal Road Ottawa, ON, Canada, K1A 0R6 Cristian Suvagau
BC Hydro
Technology Solutions Power Smart 900-4555 Kingsway
Burnaby, BC, Canada V5H 4T8 Daniel M. Sander
National Research Council Canada (retired)
Abstract - We conducted a field study in a deep-plan office building equipped with suspended direct-indirect luminaires located centrally in cubicle workstations. In order to reduce lighting energy use, the luminaires employed integral occupancy sensors and light sensors (daylight harvesting), as well as individual dimming control accessed through occupants’ computer screens. Data were collected from 86
workstations over a year to examine the energy savings and power reduction attributable to the controls, and how the controls were used. An awareness campaign that used e-mail reminders to encourage the occupants to use the
individual control feature of the lighting system was also conducted. Results indicate that the lighting system generated substantial energy savings and peak power reductions compared to a conventional fluorescent lighting system installed on a neighboring floor. The installed lighting power was 42% lower than that of the conventional system. The three controls combined saved 42 to 47% in lighting energy use compared to the same lights used at full power during work-hours; this
translated into overall savings of 67 to 69% compared to the conventional lighting system. If the three lighting controls systems had been installed separately,
occupancy sensors would have saved, on average, 35% if used alone, light sensors (daylight harvesting) 20%, and individual dimming 11%. The light sensor savings were, as expected, higher in perimeter workstations, and would have matched the performance of the occupancy sensors with some modifications to the control
parameters. The average daily peak power demand for lighting was also reduced by a similar amount, which resulted in an average effective lighting power density of only 3 W/m2. Although not detailed in this paper, surveys indicated that the studied lighting system was also associated with higher occupant satisfaction. This was likely due to the individual dimming control, although use of this control beyond an initial preferred setting was rare.
Keywords - lighting, daylighting, lighting controls, occupancy sensors, individual controls, lighting systems, daylight-linked dimming, energy savings, open-plan offices
1 INTRODUCTION
As part of the effort towards sustainability buildings need to use less energy. In 2004, Canadian office buildings accounted for 33% of the total energy used by the commercial/institutional sector, with lighting accounting for 10% of the total building energy use, and 24% of the electricity use (NRCan 2006). Several research studies have generated promising results suggesting that electrical energy use can be substantially reduced by using lighting control systems such as daylight-linked dimming and occupancy sensors (Maniccia and others 1999; Jennings and others 2000; Lee and Selkowitz 2006). Individual (personal) dimming controls have also been shown to reduce energy use, while increasing occupant satisfaction (Boyce and others 2003; Newsham and others 2004).
Despite the fact that various energy saving technologies have been available for some time, their implementation continues to be very slow. This is not surprising, however, given the scarcity of long-term performance assessments demonstrating that these systems do work as asserted and justify their higher initial cost. Many earlier investigations either took place in laboratory settings, or reported failures in attaining the projected energy savings, revealing significant problems with
commissioning and user acceptability (Bordass and others 1994; Love 1995; Slater 1995, 1996; Heschong Mahone Group 2006). Even fewer studies have surveyed concurrently the opinions and preferences of the users of these systems. A review of the scientific literature to date showed that there is almost no information available on the long-lasting success of energy-saving lighting control technologies when used in combination in real buildings. This study was designed to partially remedy this gap and to generate information that could improve the uptake of such lighting controls in buildings.
The study took place in an open-plan office building featuring a lighting control system equipped with occupancy sensors, daylight-linked dimming, and individual dimming control accessed through occupants’ computer screens. It included the monitoring of the energy use of the lighting system over the course of a year, along with an evaluation of the occupants’ satisfaction with the lighting system and their work environment, and the occupants’ use of the horizontal blinds. In this paper we focus on the energy performance of the lighting control system; other aspects of the study will be reported in future publications. Specifically, we present here:
• The overall energy savings and power demand reductions attributable to the lighting control system compared to (1) the energy used at full power during work-hours by the installed system, and (2) a static, ceiling-recessed,
conventional fluorescent lighting system on a neighboring floor.
• The separate energy-saving contributions from individual control, occupancy sensors and daylight photosensors, a key factor toward optimizing the
performance of automatic lighting control systems.
• The effect on the energy use and power demand of an intervention to the workplace expected to increase energy savings. The intervention consisted of an awareness campaign, which used e-mail reminders to encourage the occupants to use the individual control feature.
• The energy-saving potential of four other design/operation options that, in theory, could have further reduced the energy use of the lighting system. 2. LITERATURE REVIEW
A number of prior research studies relevant to this study are summarized below. Jennings and others (2000) found that in private offices occupancy sensors that turned the lights off after a 15-20 minute period of no-occupancy saved between 20-26% in lighting energy compared to the manual operation of a wall switch alone. Daylight-linked dimming provided additional savings of about 20%. In the offices where occupancy was low, energy savings resulted mostly from the occupancy sensors, while in the offices with high occupancy, savings were mostly attributable to light sensor dimming. In the offices where manual wall dimmers were available, savings were in the range of 9% by occupant dimming alone, while savings in areas with occupant bi-level switching of a 3-lamp fixture were 23%. The authors noted that “by the time the (dimming) system had been in place for over a year there was little significant (manual) dimming activity taking place”. When the lights were on, they were usually used at more than 90% of full power. The authors speculated that the occupants may have used the manual dimmers more actively had they been placed closer to their working area (desktop mounted or hand-held remotes). Comparing the occupants’ switching behavior in the offices that had occupancy sensors to the ones that did not have them, the authors did not find any evidence to suggest that people without occupancy sensors would be more likely to manually switch the lights off when leaving the office for long periods of time than the people having them.
In contrast, based on a study conducted in 63 private offices over 11 months, Pigg and others (1996) concluded that people are likely to change their behavior in the presence of controls. In offices equipped with occupancy sensors, the occupants were “half as likely to turn out the lights” when leaving the space compared to people without occupancy sensors. The authors noted that if the occupants with occupancy sensors had switched the lights manually, the savings from that group would have increased by 30%. The additional energy used was due to the lights remaining on during the time-delay of the occupancy sensors. Similar to Jennings and others (1999), people in both groups selected full lighting output from the luminaires when using wall-mounted dual-level switches: 95% of the time in the offices with
occupancy sensors, and 89% of the time in the control group. The authors
speculated that people who rely on controls to operate the lights are less likely to choose “a switch setting other than full illumination.” While the occupants did not adjust their lights very often, they appreciated the ability to do so.
Boyce and others (2000) speculated that given control over lighting, people would “initially explore the range of illuminances available and then gradually home-in on the illuminances they like.” This suggests a decrease in the frequency of use of controls over time. However, the authors did not perceive this as an argument against the provision of such control. The participants in Boyce’s experiment viewed the ability to select lighting levels as highly desirable, and the light levels they
selected were linked to the type of work that they did.
In daylit private offices, based on responses to questionnaires, Maniccia and others (1999) found that occupants did not consciously use their manual light dimmers to save energy but rather to accommodate the tasks they performed. Nevertheless, data showed that the selected light levels did not vary with the type of task. Offices were occupied an average of 4½ hours a day and 74% of the 58 occupants
observed over a 7-week period used their wall-mounted or portable desk-dimmers to adjust their lights. Over half of the time the lights were either dimmed or turned off. Energy savings from the manual controls were 15% in addition to savings from occupancy-based controls, which provided 43% savings on their own. Upon re-entering the office after the occupancy sensors had extinguished the lights, the lights remained off unless the occupant used the dimmers to restore them. The occupants appreciated having the dimmers located on their desks, and removing the desk-dimmers (so that dimming was possible via a wall switch only) resulted in fewer dimming adjustments.
Several investigations into various open-plan office buildings in the UK showed that occupants generally prefer to have the capability to choose their own lighting
environment rather than having to accept lighting levels chosen for them (Slater and Carter 1998; Slater and others 1998; Carter and others 1999; Moore and others 2001, 2002). Questionnaires from 410 occupants collected over a 3-year period showed that the occupants viewed the installations that they could control more positively, even when the measured lighting conditions did not meet the currently
recommended lighting levels for offices. The authors noted that individuals purposely used the controls to set their preferred lighting levels and not only to counteract discomfort. They reported that “by far the most frequent response was that people wanted control over an individual luminaire” (Moore and others 2002). In the winter, 20% of the users chose illuminance levels below 100 lux, while over 50% worked at levels below 300 lux, and less than 25% worked under the recommended 300-500 lux range. All lighting installations were used at less than full power, the average power demand varying between 50 to 60% all year round. Building depth,
percentage of glazed area, or degree of obstructions had no effect on these outputs. Conflicts were reported in areas where groups of luminaires were linked together and controlled by more than one user. While the authors found that individuals generally worked in a very wide range of illuminances, they also noted “a strong correlation between luminaire output and distance of the workstation from the window” (Carter and others 1999). This suggests that people actively changed the electric light levels in response to the available daylight.
After surveying several open-plan office buildings in the UK incorporating various types of lighting controls, Bordass and others (1994) also reported that unfamiliarity with controls or the bad locations of controls discouraged their use. These authors suggested that the best location for switches while working is at the workstation. The authors also reported high rates of dissatisfaction with photocontrolled lighting due to the lights going on/off inappropriately; distracting transitions; incorrect installation and calibration; and lack of possibility to override them. Occupancy sensing was also not always perceived positively due to the lights going off inappropriately. The very few successful installations they found, from both occupant satisfaction and energy efficiency points-of-view, were installed according to workstation layout and daylight availability; had local controls with clear user interfaces permitting easy-tuning to individual requirements; had easy access to blinds; well-informed occupants; and good building management. Similar observations were made by Slater (1995, 1996), Escuyer and Fontoynont (2001), Roche and others (2001), and Wyon (1999). Based on 26 case studies that investigated the effectiveness of occupancy sensors to generate energy savings in various space types, Figueiro (2004) proposed estimates for expected energy savings from occupancy sensors in private and shared spaces, with scheduled versus sporadic use. In private offices with sporadic use, occupancy sensors accounted for an average of about 25% energy savings during 7.5 to 10 hours of use, while in shared spaces with sporadic use, including open-plan offices, the average savings were around 40%. In shared spaces with scheduled use, such as classrooms, the average savings were around 30%. The larger energy savings related to occupancy sensors installed in shared spaces was attributed to the fact that in such spaces the occupants generally do not feel as responsible for manually switching off the lights when leaving a space as they would when leaving a private office.
In a full-scale open-plan test installation with 1.2 m high workstation partitions, Lee and Selkowitz (2006) tested two types of daylight-linked lighting system (open-loop
dimming system with proportional control, and a DALI dimming system) and found that the lighting energy savings were still substantial at a depth of 7 meters from a window wall equipped with automated roller shades. In a side-lit area with an open-loop dimming system, from mid-February to mid-September, the average savings for a 7-meter depth zone were 20-23%. At the same distance from the window, in a bilateral daylit zone featuring the DALI dimming system, the average savings were 52-59%. In the DALI area, the lights were turned off when there was sufficient daylight (0 light = 4% of full power draw), whereas in the area featuring the open-loop dimming system, the lights were dimmed only down to a minimum power (5-10% light = 35% of full power consumption). The authors noted that “without active shade management” the energy savings would have been significantly lower “due to non-optimal control by the occupants”.
3 SITE DESCRIPTION
The study was conducted on floors 8 to 11 of a 12-storey rectangular, curtain-wall, green-tinted glazed structure (Fig. 1) located in Burnaby, British Columbia, Canada, (latitude 49°11’ N, longitude 123°10’ W). The study floors consisted mostly of open-plan areas (75% of total floor area) furnished with cubicle-type workstations and no private offices. A few enclosed areas were located at the core of the building
providing shared spaces for meeting rooms, break rooms, and storage. All perimeter workstations had two or three window panes equipped with manually operated off-white standard horizontal blinds. Each floor had an approximate area of 835 m2. The heightof the partitions between the workstations varied from 0.84 m next to the windows, to 1.25 m between two adjacent workstations, and 1.42 m next to the aisles.There were few external obstructions to hamper daylight admittance into the building.
Fig. 1 North-east view of the test-site.
The majority of workstations on the study floors had commercial direct-indirect luminaires suspended at about 0.3 meters below the ceiling and located centrally in each workstation (Fig. 2). When fully on, the system provided an average
illuminance of 450 lux in the centre of the workstation at 0.85 m above the floor (desktop height).
Fig. 2 Typical installation of the luminaires and the window shading.
Each luminaire (Fig. 3) consisted of 3x32-W lamps (3500 K) connected by a network to a central control computer and to each occupant’s desktop computer. The fixture also included an occupancy sensor and a daylight photosensor. The lamp in the center of the luminaire was equipped with a static electronic ballast and directed the light mainly upward, providing constant general lighting around the open-plan space. During the study, these lamps were controlled centrally based on a daily schedule that kept them continuously on at full power from 7:30 AM to 5 PM on workdays. Outside of these hours, the uplight lamps were turned on by an integrated
occupancy sensor when sensing occupancy in the vicinity.
The two lamps at the sides directed the light mainly downward. The downlights were controlled during the study based on the following three control options:
• An integrated occupancy sensor (OS). It consisted of an infrared motion sensor mounted directly on the luminaire. On detecting vacancy, the sensor prompted the downlights to gradually dim down to zero and switch-off. When presence was detected, the downlights were automatically restored to the previously set lighting level.
• An integrated light sensor (LS), used to monitor the surrounding light levels and dim the downlights when sufficient light (from either daylight or
neighboring electric light) was present to maintain the occupant preset light level. The light sensor consisted of a photocell mounted directly on the luminaire.
• Individual control (IC), consisting of an on-screen slider located on the
occupants’ desktop computers that allowed both on/off switching or dimming of the downlights to a preferred level.
IC
OS LS
Fig. 3 Illustration of the three control options of the luminaire downlights
During the study, the field installation comprised a total of 195 luminaires distributed over floors 8, 9, 10 and half of floor 11. At installation (4 years prior to this study), these fixtures replaced a total of 530 2’x4’ (60x120 cm) conventional ceiling-recessed fluorescent louvered luminaires with 2x32-W T8 lamps (3500 K) and electronic static ballasts, which reduced the lighting power density by almost half (5.8 W/m2 versus 10 W/m2). This conventional lighting system remained in the other half of floor 11, and provided a comparison group in the occupant satisfaction survey conducted as part of the larger project.
4 METHOD
4.1 CHARACTERISTICS OF LIGHTING SYSTEM OPERATION
Data related to the luminaires was continuously collected over a 12-month period in three phases:
• Phase 1 was conducted from January 18 to March 11, 2005 (39 workdays) with the light sensor disabled. During this time the downlights were controlled only by the occupancy sensors and the on-screen individual controls. The occupancy sensors were set to operate with a time-delay of 8 minutes. This time-delay was followed by a period of 7 minutes of continuous dimming before the downlights turned off.
• Phase 2 was conducted between March 12 and October 2, 2005 (140 workdays) with all the controls enabled. The occupancy sensors were set to operate with a time-delay of 12 minutes. This time-delay was followed by a period of 3 minutes of continuous dimming before the downlights turned off, which resulted in a total time between the last detected motion and the downlights off condition of 15 minutes (equivalent to the previous period). • Phase 3 (Awareness Campaign) was conducted from October 3 to December
31, 2005 (61 workdays) similar to Phase 2 with the exception that monthly e-mails were sent to the employees to: remind them about the lighting control
system; provide them with information on how to use it; and encourage them to save energy by using the on-screen individual lighting controls. The
following wording was used in the e-mail regarding how the individual control might be used: ” Remember that you can reduce the energy use substantially
by setting the brightness of the light fixture in your workstation to the lowest level that is comfortable for you, and by turning the lights out completely when not needed”.
All lighting fixtures were preset at installation to restrict downlight dimming to 50% light output when controlled by the light sensor. This was done to prevent large variations in light levels, which the design team believed might inconvenience the occupants. The occupants could still dim the downlights using the on-screen control to any levels below this limit, if desired. When turned on, but dimmed to minimum output, the power demand of the downlights was 19 W (or 51 W/luminaire, including the 32 W uplight), whereas dimmed at 50% output, the power demand of the
downlights was about 41 W (or 73 W/luminaire).
4.2 MONITORING OF LIGHTING SYSTEM ENERGY USE AND POWER DEMAND Each individual luminaire was monitored using a modified version of the
communication software provided by the manufacturer as part of the standard
installation of the lighting system. The software was adapted to automatically log the energy use of each luminaire every 15 minutes, and record the occupant use of the on-screen control slider, and the status of the occupancy and daylight sensors. The field installation reported the energy use of each luminaire with all available controls in operation simultaneously. However, since we also wanted to derive the separate saving contribution of each control, we developed a mathematical model to calculate the energy use and power demand of each luminaire if only one control, or two controls combined, had been in operation. The mathematical model used
correlations between the dimming level, electric power demand, and light sensor, occupancy sensor and on-screen individual control setpoints, determined based on the field-collected data and measurements from a similar system installed in a laboratory setting.
To calculate the savings associated with the controls, we considered the following three basic cases, which assumed full lighting energy use during work-hours:
• energy use and power demand in the absence of controls during the basic daily work-schedule of the lighting system (7:30 AM to 5 PM).
• energy use and power demand in the absence of controls during the total work-hours (basic work-schedule, 7:30 AM to 5 PM, plus the additional time that the lights were reported to have been on outside the scheduled hours).
• energy use and power demand of a conventional lighting system consisting of 2’x4’ (60x120 cm) parabolic louvered luminaires with 2x32-W T8 fluorescent lamps, during the total work-hours.
For each of the three phases of the study, we calculated the percentage in energy savings and the power demand reductions with the downlights controlled by:
• occupancy sensors only (os); In this case it was considered that no individual control or light sensor control were available, therefore, the downlights would have been used continuously at full power when the occupants were present in their workstations (actual occupancy), and off at other times.
• individual controls only (ic); In this case it was considered that no occupancy or light sensor control were available, therefore, the downlights would have been used at the occupant-selected level during the total work-hours. • light sensor controls only (ls); In this case it was considered that no
occupancy or individual control were available, therefore, the downlights would have been used continuously at the light sensor selected dimming level during the total work-hours.
• occupancy sensors and individual controls combined (os+ic); In this case the downlights would have been used at the dimming level set by the occupants during the workstation actual occupancy, and off at other times.
• occupancy sensors and light sensor controls combined (os+ls); In this case the downlights would have been used at the dimming level set by the light sensors during the workstation actual occupancy, and off at other times. • individual controls and light sensor controls combined (ic+ls); In this case the
downlights would have been used at a dimming level selected to be the minimum between the dimming level dictated by the light sensor setting and the dimming level dictated by the individual control setting during the total work-hours.
• all available controls combined; (os+ic) for Phase 1; (os+ic+ls) for Phases 2 and 3; In this case the downlights would have been used at a dimming level selected to be the minimum between the dimming level dictated by the light sensor setting and the dimming level dictated by the individual control setting during the workstation actual occupancy, and off at other times. These
values, calculated with the same mathematical model used for the one-control and two-control scenarios described above, were subsequently compared to the real energy use reported by the lighting system monitoring software, being indicative of the accuracy of our theoretical model.
All calculations included the energy used by the uplights, which were continuously on at full power during scheduled hours, and on outside these hours when
occupancy was detected in the workstations.
In order to identify the effect of the downlight dimming restriction on the energy use, we also calculated the energy savings if the downlights had been allowed to drop to zero on light sensor control. Furthermore, we also calculated the energy savings associated with three other design/operation options that could have, theoretically, further reduced the energy use, as follows:
Option 1 = lighting system equipped with 32-W static uplights and 2x32-W dimmable downlights (as installed), but with the downlights allowed to dim to zero on light sensor control;
Option 2 = lighting system with 25-W static uplights and 2x32-W dimmable downlights allowed to dim to zero on light sensor control;
Option 3 = system with 3x32-W dimmable uplights and downlights, both restricted at 50% output on light sensor control;
Option 4 = system with 3x32-W dimmable uplights and downlights, both allowed to dim to zero on light sensor control.
The above calculations apply only to the data collected during Phases 2 and 3 when the lighting system operated with all three controls enabled.
4.3 DATA ACCESS AND SAMPLE SIZE
Because the study included the examination of the lighting control usage data at the individual level, formal consent to analyze the lighting system data was sought from each occupant, in accordance with the requirements of our Research Ethics Board (similar requirements were met for the survey aspect of the larger study). Only the records logged in the workstations where the occupants gave specific permission to release their data for analysis were included. This reduced the sample size from 195 to 86 luminaires, of which 57 were in workstations located at the perimeter of the building with direct access to windows; 18 were located in 2nd row workstations adjacent to the perimeter workstations at distances between 2.5 and 4.5 meters from the windows; and 11 were located at the core of the building at distances greater than 5.0 meters from the closest window. The sample size was not big enough to permit analysis by façade orientation.
5 RESULTS
Data collected throughout the year showed that during all three phases of the study, the actual average daily time-of-use of the lighting system was higher than the 9.5 hours used by the lighting system schedule (7:30 AM to 5 PM), as shown in Fig. 4. Whereas, due to the occupancy sensors, the average daily on-time of the downlights was between 4-6 hours/day, the uplights were used at full power for an average of 10-11 hours/day. 0 2 4 6 8 10 12
Jan 18 - Mar 11 (LS OFF) Mar 12 - Oct 2 (LS ON) Oct 3 - Dec 31 (Awareness campaing) D a il y a v e ra g e ti m e -o f-u s e [h rs ] Downlights Uplights
Weekdays only (86 workstations)
Fig. 4 Average daily time-of-use of the lighting system during all three phases of the study.
The average daily energy that would have been used by the downlights if maintained at full power during the actual work-hours was 0.69 kWh/workstation/day for Phase1; 0.72 kWh/workstation/day for Phase 2; and 0.74 kWh/workstation/day for Phase 3. These values are about 10-17% greater than the energy used by the downlights at full power during scheduled hours (0.65 kWh/workstation/day from 7:30 AM to 5 PM). Therefore, we calculated the percentage in energy savings for the various control scenarios mentioned above relative to the energy used by the fixtures at full power during the total daily work-hours, which we considered to be a more realistic comparison baseline than the 9.5 hours used by the lighting system’s daily schedule. The average daily energy used by the uplights was about 0.33 kWh/workstation/day.
5.2 PERFORMANCE OF THE LIGHTING SYSTEM AS INSTALLED
Table 1 presents a summary of the luminaire daily average percentage energy savings and power demand reductions associated with all the control scenarios, compared to full light output from the studied system. Additionally, the table also includes the theoretical energy savings associated with the other four
Table 1 Summary of luminaire daily average energy savings and power demand reductions for various control scenarios compared to full light output from the studied system
As Installed Option 1 Option 2 Option 3 Option 4 Phase 1 Phase 2 Phase 3 Phase 2 Phase 3 Phase 2 Phase 3 Phase 2 Phase 3 Phase 2 Phase 3 Jan18-Mar11 Mar12-Oct2 Oct3-Dec 31 Mar12-Oct2 Oct3-Dec 31 Mar12-Oct2 Oct3-Dec 31 Mar12-Oct2 Oct3-Dec 31 Mar12-Oct2 Oct3-Dec 31 Energy Savings % % % % % % % % % % %
occupancy sensors (os) 29 35 38 35 38 38 40 52 54 52 54
individual controls (ic) 20 11 5 11 5 11 5 15 7 15 7
light sensors (ls) - 20 11 32 16 34 18 29 16 47 24
occupancy sensors + individual controls 40 40 39 40 39 43 42 59 56 59 56
occupancy sensors + light sensors - 45 44 51 46 55 49 66 62 75 66
individual controls + light sensors - 24 14 34 19 37 21 35 20 51 27
all available controls (estimated) 40 47 44 52 47 56 50 69 64 76 67
all available controls (real) 39 47 42 - - -
Power Demand Reductions % % % % % % % % % % %
occupancy sensors (os) 31 36 38 36 38 39 41 54 57 54 57
individual controls (ic) 21 12 5 12 5 13 5 17 7 17 7
light sensors (ls) - 23 15 39 24 42 25 34 23 59 35
occupancy sensors + individual controls 41 41 40 41 40 45 43 62 59 62 59
occupancy sensors + light sensors - 47 46 55 50 59 54 70 68 82 74
individual controls + light sensors - 26 18 41 26 44 28 39 26 61 38
all available controls (estimated) 41 48 46 55 50 59 54 72 69 82 75
all available controls (real) 40 49 43 - - -
Phase 1 = Installed system with the light sensor disabled (January 18 to March 11, 2005); Phase 2 = Installed system with all three controls enabled (March 12 to October 2, 2005);
Phase 3 = Installed system with all three controls enabled during the Awareness Campaign (October 3 to December 31, 2005); Option 1 = Installed system if downlights were allowed to dim to zero on LS (maximum as installed saving potential);
Option 2 = System with static 25 Watt uplights and downlights allowed maximum dimming on LS; Option 3 = System with dimmable uplights and downlights restricted at 50% output;
5.2.1 ENERGY USE
Figure 5 shows the daily average energy used per luminaire during Phase 2 for the various control scenarios. Also shown in Fig. 5 is the calculated energy use of the conventional lighting system (providing a similar target desktop illuminance) at 1.83 kWh/workstation/day. Due to its reduced lighting power density, the installed system would have saved 42% in electric energy if used at full power during work-hours compared to the conventional system.
0 0.2 0.4 0.6 0.8 1 1.2 1.4 1.6 1.8 2 no controls, conventional system
no controls, scheduled occupancy no controls, real occupancy occupancy sensors (os) individual controls (ic) light sensors (ls) os+ic os+ls ic+ls os+ic+ls, estimated os+ic+ls, real
Fixture average daily energy use [kWh] Interior WS 2nd Row WS Perimeter WS Mar 12 - Oct 11, 2005
(Phase 2)
Fig. 5 Luminaire daily average energy use for various control scenarios from March 12 to October 2, 2005 (Phase 2); the energy use of a conventional lighting system is shown for comparison (data shown by luminaire proximity to windows).
Three-controls scenario
As shown in Fig. 6 (for Phase 2) and Table 1 (for all three phases), the three controls combined (os+ic+ls, real) saved 42-47% compared to the energy used by the same luminaires at full power. This translated into energy savings of 67-69% compared to the static conventional system (Fig. 7)
The energy use reported by the system was also remarkably close to the estimated energy use (os+is+ls, estimated), obtained using the theoretical model we used to separate the saving contributions from each control feature if used individually, which provides confidence in the accuracy of the model (Fig.6).
35% 11% 20% 40% 45% 24% 47% 47% 0% 20% 40% 60% 80% 100%
occupancy sensors (os) individual controls (ic) light sensors (ls) os+ic os+ls ic+ls os+ic+ls, estimated os+ic+ls, real
Fixture (Downlight + Uplight) average energy savings Mar 12 - Oct 2, 2005
(Phase 2)
Fig. 6 Luminaire average energy savings for various control scenarios from March 12 to October 2, 2005 (Phase 2) compared to full lighting use of the installed system during total work-hours (data shown averaged across all locations; downlight restricted to 50% output on light sensor).
42% 63% 48% 54% 65% 68% 56% 69% 0% 20% 40% 60% 80% 100%
full power (no controls) occupancy sensors (os) individual controls (ic) light sensors (ls) os+ic os+ls ic+ls os+ic+ls, real
Fixture (Downlight + Uplight) average energy savings (Phase 2) Mar 12 - Oct 2, 2005
Fig. 7 Luminaire average energy savings for various control scenarios from March 12 to October 2, 2005 (Phase 2) compared to the energy use of a conventional static lighting system during total work-hours (downlight restricted to 50% output on light sensor).
Occupancy sensor control scenario
Calculations of the energy use of the lighting system had it been controlled by occupancy sensors only, revealed that the occupancy sensors were the single control option with the highest potential for energy savings. As shown in Table 1, the fixture average daily savings across all three phases of the study were between 29-38% compared to lights fully on during work-hours. These values are slightly higher than those reported for private offices by Jennings and others (2000) and Figueiro (2004), but close to Maniccia and others (1999). A small difference of 4-8% in occupancy sensor savings was observed in our study based on workstation
proximity to windows (as shown in Fig. 8 for Phase 2), which was most likely linked to the occupants’ type of work rather than to their window/daylight exposure.
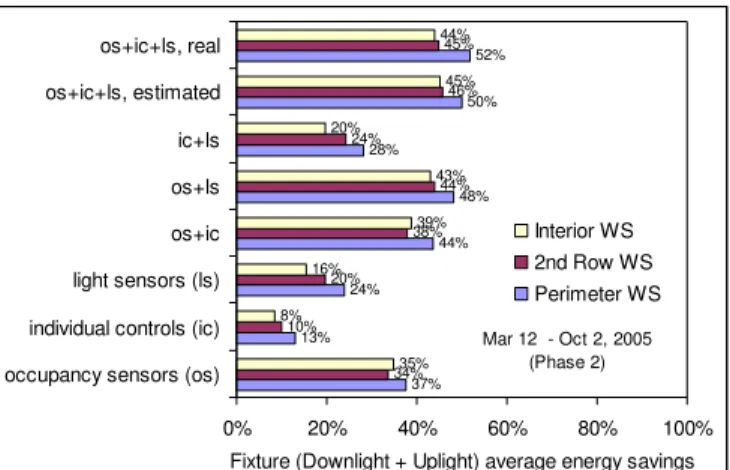
37% 13% 24% 44% 48% 28% 50% 52% 34% 10% 20% 38% 44% 24% 46% 45% 35% 8% 16% 39% 43% 20% 45% 44% 0% 20% 40% 60% 80% 100%
occupancy sensors (os) individual controls (ic) light sensors (ls) os+ic os+ls ic+ls os+ic+ls, estimated os+ic+ls, real
Fixture (Downlight + Uplight) average energy savings Interior WS 2nd Row WS Perimeter WS
Mar 12 - Oct 2, 2005 (Phase 2)
Fig. 8 Luminaire average energy savings for various control scenarios from March 12 to October 2, 2005 (Phase 2) compared to full lighting use of the installed system during total work-hours (data shown by luminaire proximity to windows; downlight restricted to 50% output on light sensor).
Light sensor control scenario
Had they been used as the only control option of the lighting system, the light sensors showed an overall potential for energy savings in the range of 11 to 20% compared to the energy use at full power (Table 1). As shown in Fig. 8 for Phase 2, the savings were, as expected, higher in the perimeter workstations (24%) versus the interior workstations (16%). Across both Phases 2 and 3, the light sensor saved between 17-24% in the perimeter workstations; 9-20% in the 2nd row workstations, and 9-16% in the interior workstations. These findings are consistent with Jennings and others (2000) and Lee and Selkowitz (2006). However, in Lee and Selkowitz’s study the windows were equipped with automated roller shades, whereas in the present study the windows were covered by manual horizontal blinds. In addition, the height of the partitions between the workstations was 1.2 meters in Lee and Selkowitz compared with varying partition heights of 0.84, 1.25 and 1.42 meters in this study.
The energy savings from light sensor control beyond the perimeter workstations (16-20%) were a direct result of the relatively high daylighting levels available in the interior workstations. Illuminance data collected on the top of 12 partitions separating the workstations and measured at 10-minute intervals from 6 AM to 6 PM during all weekends of the study, in the absence of electric lighting, showed that the average daylight illuminance was between 200 to 400 lux at distances between 2.5 and 4 meters from the nearest window (average of 4 locations), and about 100 to 150 lux beyond 5 meters from the nearest window (average of 8 locations).
Individual control scenario
As shown in Table 1, if used as the only control option, the on-screen individual controls showed the lowest potential for energy savings, ranging from 5 to 11% during Phases 2 and 3, when the light sensor was enabled, to 20% during Phase 1, when the light sensor control was disabled. These values are generally consistent
with Jennings and others (2000), Maniccia and others (1999), and Veitch and Newsham (2000). Note that our calculation is likely an underestimate of the true energy savings in this scenario, as we cannot account for the additional switching that some occupants would enact on leaving the space.
Table 2 presents the number of workstations with dimming and on/off occupant-requested adjustments for each phase of the study. During Phase 1 (39 workdays), user light level adjustments occurred in 81 out of the 86 workstations considered. However, most of these adjustments occurred at the beginning of Phase 1, in the two days following an unannounced lighting system reset that deactivated the light sensor at the start of the project. During these two days only, there were a total of 55 on/off and 71 dimming user-requests. Throughout the rest of Phase 1, however, the occupants used the on-screen individual controls only occasionally, and the number of workstations where user adjustments occurred (active workstations) was similar to that shown for Phases 2 and 3. During Phase 2 (140 workdays), on-off
user-requested adjustments were observed in only 40% of the 86 workstations
considered, and user-requested dimming occurred in 60% of these workstations. Similarly, throughout Phase 3 (61 workdays), on-off user-requested adjustments were observed in 25% of the workstations, while user-requested dimming occurred in 50% of the workstations.
Even among the occupants who used the on-screen controls, half used them only once or twice during each phase of the study, the average number of user-requested light level adjustments per active workstation being 1.8 on/off and 2.5 dimming
adjustments for the whole of Phase 1; 2.5 on/off and 2.7 dimming adjustments for Phase 2; and 5.2 on/off and 3.5 dimming adjustments for Phase 3. The apparent higher average rate-of-use of the individual control during Phase 3 was, however, due to one single occupant who used the system very actively (50-57 adjustments). The average number of light level adjustments for Phase 3 drops to 2.6 on/off and 2.4 dimming adjustments if this outlier user is excluded. The maximum number of either on/off or dimming adjustments occurring in any other workstation during each period was eight.
Table 2 Frequency-of-use of the on-screen individual controls (dimming and on/off occupant-requested adjustments)
Phase 1 Phase 2 Phase 3
Workdays in period 39 140 61
No.of workstations with manual on/off adjustments (out of 86) 81 (37)* 34 21 No.of workstations with manual dimming adjustments (out of 86) 82 (50)* 52 44 Total number of manual on/off adjustments for all workstations and days 145 (68)* 86 109 (52)** Total number of manual dimming adjustments for all workstations and days 205 (108)* 138 152 (102)** Average manual control adjustments/workstation/day (across 86 workstations) 0.10 (0.05)* 0.02 0.05 (0.03)** *excluding the first week after the initial lighting system reset (Jan 18-25, 2005)
**excluding one outlier user
During Phase 1, there was a daily average of 3.72 on/off adjustments/day across the 86 workstations and 5.26 dimming adjustments/day. However, if we exclude the
adjustments which occurred during the first week after the lighting system’s reset, these numbers drop to 1.74 on/off and 2.77 dimming adjustments/day. During Phase 2, the number of individual control adjustments dropped even more to an average of 0.99 dimming adjustments/day and 0.61 on/off adjustments/day, which shows that the active occupants used the individual control less frequently when the lighting system was controlled by the light sensor. This suggests that once the occupants selected a light level, if that light level was reasonably well regulated and maintained by the light sensor, the users were satisfied with the selected level for long periods of time. Jennings and others (2000) also noted very little dimming activity after wall dimmers in their study had been in place for more than a year.
Data presented in Table 2 also shows that the awareness campaign (Phase 3) did increase slightly the daily rate-of-use of the individual controls to 0.85 on/off
adjustments/day and 1.67 dimming adjustments/day (when excluding the outlier user). However, the average daily energy savings from the individual controls dropped from 11% during Phase 2 to only 5% during Phase 3. This was a direct result of the fact that in 20 out of the 44 active workstations in Phase 3, the light levels selected were higher than those recorded during Phase 2, whereas 12 settings were the same as Phase 2, and another 12 lower. We speculate that this was a result of both the occupants being reminded periodically about the lighting controls available to them, combined with a seasonal effect that reduced indoor daylight availability.
Calculated on a per workstation per day basis, the frequency-of-use of the individual controls was notably low, averaging only 0.02-0.05 control actions (on/off and
dimming together) per workstation per day (Table 2).
There was a 5% difference in downlight energy savings from individual control based on workstation proximity to windows (as exemplified in Fig. 8 for Phase 2), with the savings being a little higher closer to the window. This is, generally, consistent with an earlier finding that people manually reduced electric light levels in response to the available daylight (Moore and others 2003). However, in our study this phenomenon was observed only for the period with longer daylight hours (Phase 2, March 12 to October 2).
Two controls scenarios
Data collected during Phases 2 and 3 show that the occupancy control combined with light sensor control would have generated energy savings almost as high as those generated by the system operating with all three controls (estimated average savings of 44-45%; Table 1). The next best two-control scenario was the
combination between occupancy and individual control (average savings of 39-40%). The light sensor and the individual control used together would have saved only 14-24% in energy for lighting, which is 11-24% lower than the energy savings generated by the occupancy sensors used alone. Especially for Phase 2, the period with longer daylight hours, this was mainly because of the downlight’s restriction to
50% output when controlled by the light sensor. Nevertheless, during Phase 3, the occupancy sensor remained the single best energy-saving strategy.
5.2.2 POWER DEMAND
Data showed that the lighting system also generated significant reductions in the peak power demand for lighting. Table 1 shows the daily average reductions in peak power demand for all phases of the study, for the various control scenarios
investigated. When used together, the three controls reduced the daily peak power demand during work-hours on average by 43-49% compared to the same fixtures used at full power (97 W/workstation), and by 65-70% compared to a conventional lighting system (174 W/workstation). This is an important benefit for electric utilities seeking to balance supply and demand at reasonable cost on high electricity demand days (Newsham 2006). Because the controls ensure that not all the installed lighting power is used simultaneously, in this study the installed lighting power density of the studied system (5.8 W/m2) was reduced to an effective average lighting power density of only 3 W/m2. This compares very favorably with the 12 W/m2 installed allowed for open-plan offices in the widely used ASHRAE 90.1 Energy Standard (2004).
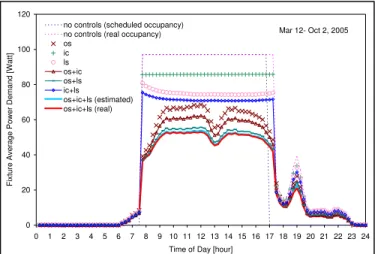
Figure 9 shows the average daily power demand profile of the luminaires during Phase 2. The average peak load was about 53 W/luminaire and occurred from 9 AM to 12 AM, and from 2 PM to 4 PM. The average power demand dropped to about 45 W/luminaire at 1 PM due to the lunchtime break. The controls also reduced the power demand during non-scheduled hours and during the rounds of the cleaning and security staff.
0 20 40 60 80 100 120 0 1 2 3 4 5 6 7 8 9 10 11 12 13 14 15 16 17 18 19 20 21 22 23 24 Time of Day [hour]
Fixture Average Power Demand [W
att]
no controls (scheduled occupancy) no controls (real occupancy) os ic ls os+ic os+ls ic+ls os+ic+ls (estimated) os+ic+ls (real) Mar 12- Oct 2, 2005
Fig. 9 Luminaire average daily power demand for various control scenarios compared to full lighting use from March 12 to October 2, 2005 (Phase 2) during scheduled and total work-hours (downlight restricted to 50% output on light sensor).
5.3 LIGHTING SYSTEM ENERGY SAVINGS POTENTIAL
Below we present the potential for energy savings and power demand reductions of four system and control alternatives, compared to the one installed.
5.3.1 OPTION 1: SYSTEM WITH STATIC UPLIGHTS (AS INSTALLED) AND DIMMABLE DOWNLIGHTS ALLOWED TO DIM TO ZERO ON LIGHT SENSOR CONTROL
As shown in Table 1, if the downlights had been allowed to dim to zero on light sensor control, then all the control scenarios incorporating light sensor control would have reduced the fixture average peak power demand by an additional 7 to 16% for Phase 2, and by an additional 4 to 9% for Phase 3, compared to the actual case. It is interesting to note that in terms of demand reduction, during Phase 2, the light sensors alone would have performed slightly better than the occupancy sensors alone for most of the workday (39% power reduction compared to 36% from occupancy control alone). Nevertheless, during Phase 3, because of the reduced daylight availability, the occupancy sensors would have still been the single control option with the greatest power reduction.
The average energy savings of the lighting system with all three controls in operation would have been by only 3-5% higher during both periods. Data sorted by fixture proximity to windows showed that in terms of energy use, the light sensor savings would have exceeded those of the occupancy sensors only in the perimeter workstations and only during Phase 2, the period with longer daylight hours. On average, under light sensor only control during Phase 2, the energy savings would have been 12% higher had the downlight been allowed to dim to zero. The savings would have been by only 5% higher during Phase 3.
5.3.2 OPTION 2: SYSTEM WITH REDUCED POWER STATIC UPLIGHTS AND DIMMABLE DOWNLIGHTS ALLOWED TO DIM TO ZERO ON LIGHT SENSOR CONTROL
In this case the luminaire average energy savings with the three controls in operation would have increased by an additional 6 to 9% compared to the actual case (Table 1). The luminaire average peak power demand would have been reduced on average by an additional 8-11%, the peak power demand being in this case about 40-46 W/fixture. Of course, reducing the wattage of the uplights would have slightly reduced the overall light levels.
5.3.3 OPTION 3: SYSTEM WITH DIMMABLE UPLIGHTS AND DOWNLIGHTS, BOTH RESTRICTED TO 50% OUTPUT ON LIGHT SENSOR CONTROL
In this case the average energy savings with all three controls in operation would have increased by an additional 20-22% compared to the actual case (see Table 1). The luminaire average peak power demand would have also been reduced by an additional 24%, the peak power demand dropping in this case to about 33-36 W/fixture.
5.3.4 OPTION 4: SYSTEM WITH DIMMABLE UPLIGHTS AND DOWNLIGHTS, BOTH ALLOWED TO DIM TO ZERO ON LIGHT SENSOR CONTROL
In this case the average energy savings with all three controls in operation would have increased by an additional 23 to 29% compared to the actual case (see Table 1). The luminaire average peak power demand would have also been reduced by an additional 29-34%, the peak power demand being in this case between 20-32
W/luminaire depending on the season. Uplights, however, are often not switched off with direct-indirect luminaires because this would create an uneven light distribution on the ceiling.
6 FURTHER DISCUSSION
One of the goals of this project was to weigh the relative contribution of the three different control systems to the energy savings. Data indicated that if only one type of control were to be installed in this building, and the energy savings and power demand reductions were the principal performance criteria, then the occupancy sensors would be the best choice. As installed, they provided savings in lighting energy use in the range of 30 to 40% compared to full lighting use. Note, however, that these savings were a result of a period of 12 minutes between the moment the last motion was detected and the start of gradual dimming, followed by a period of 3 minutes of continuous dimming before the lights turned off. Changes to either of these two intervals would have affected the energy savings.
Light sensor control (“daylight harvesting”) would have provided similar power demand reductions and energy savings to the occupancy sensor control only in the perimeter workstations, only seasonally during periods with long daylight hours, and only if downlight dimming to zero were permitted. On average, the light sensors saved about 10-20% energy compared to full lighting use of the installed system, and 16-32% had the dimming to zero been allowed. Note that data on blind use collected throughout this study showed a high average blind occlusion of the
facades of this building of 55%; clearly blind use may strongly affect energy savings with such controls.
If they had been installed independently, the individual controls in this installation would have been the worst single control choice in terms of energy savings (average savings of less than 10% compared to full lighting use), and adding individual control
to the system already controlled by occupancy and light sensors provided very little additional energy saving benefit. Nonetheless, the ability of the occupants to choose their own preferred light level remains an important benefit not offered by the other two control types. Individual control has been linked to improved occupant mood, satisfaction and comfort (Newsham and others 2004), and improved environmental satisfaction has been linked to improved job satisfaction (Charles and others 2003). The occupant surveys conducted as part of our larger study supported these earlier findings, demonstrating significantly higher satisfaction for the occupants with the multi-control direct-indirect system compared to those with conventional lighting. Given previous research, it seems likely that this benefit can be attributed to the individual control. The survey results will be discussed in more detail in a future publication.
Table 1 illustrates that the energy savings from two or three controls used together (os+ic, os+ls, ic+ls, os+ic+ls) are not equal to the sum of the savings of the controls when used separately (os, ic, ls). This has a straightforward explanation, but one which is often not appreciated. For example, if an occupancy sensor would save 40% on its own, and a light sensor 20% on its own, the saving with both sensors is not 60% (40% + 20%), but somewhat less. The light sensor cannot contribute energy savings during the period when the lighting has already been switched off due to occupancy. Similarly, the occupancy sensor could not claim all of the savings during absence if daylight harvesting would have reduced the lighting load during that period anyway.
Note that we did not attempt to analyze the effect of the lighting energy savings on the thermal energy use in the building. Reducing lighting energy use means
reducing the internal heat gains. During the cooling season, the lower internal gains will reduce the cooling load, which is also an electrical end use. However, in the heating season, the internal gains would have to be made up by the heating system, which was fuelled by natural gas in this building. In general, the overall thermal effect will depend strongly on the local climate, the building design and properties, and the characteristics of the building HVAC system (Newsham and others 1998). It is also important to note that the lighting system in the studied building was maintained and operated by a highly qualified and motivated employee. This likely played an important role in realizing energy savings of the magnitude reported here. 7 CONCLUSIONS
The results of this study are drawn from long-term data of a single building using a particular lighting system. This lighting system was a workstation-specific, 3-lamp direct-indirect system with integral occupancy and light sensors, and individual dimming control. The three controls affected the light output of the two lamps directed downwards, while the single lamp directed upwards was always on during scheduled occupancy. The sample of luminaires investigated was smaller than the one originally targeted and it is possible that the performance of the luminaires
assigned to people who did not volunteer their data for study was different from those that were studied. Nevertheless, despite the specifics of this field study, we believe the following findings are likely helpful to general office lighting practice:
• Due to its reduced lighting power density alone, the direct-indirect, workstation-specific, lighting system saved 42% in lighting energy use compared to the static ceiling-recessed system it replaced. With all three controls in operation, the lighting system saved an additional 42-47%, which translates into energy savings of 70% compared to the conventional lighting system.
• If the three lighting controls systems had been installed separately,
occupancy sensors would have saved, on average, 35% if used alone, light sensors (daylight harvesting) 20%, and individual dimming 11%. The light sensor savings were, of course, higher in perimeter workstations, and would have matched the performance of occupancy sensors on the perimeter if the downlights had been permitted to dim to zero under light sensor control, rather than to only half output.
• There were concomitant reductions in peak power demand for lighting. The three controls reduced the average daily peak power demand by 65-70% compared to a conventional lighting system, and by 40-50% compared to the installed fixtures used at full power. This is an important benefit for electric utilities seeking to balance supply and demand at reasonable cost on high demand days.
• The peak power reductions due to the controls meant that the installed lighting power density of the system (5.8 W/m2) was reduced to an effective average lighting power density of only 3 W/m2.
• Several other design/operation options that would have further reduced lighting energy use were identified: allowing the downlights to dim to zero instead of only 50% output when under light sensor control; reducing the wattage of the uplights; or controlling the uplights identically to the downlights. However, design options including the uplights risk greater ceiling
non-uniformity.
• Occupant surveys conducted as part of our larger study demonstrated significantly higher satisfaction for the occupants with the multi-control direct-indirect system, compared to those with conventional lighting. Given previous research, it seems likely that this benefit can be attributed, at least in part, to the individual dimming control.
Although previous research has addressed various aspects of lighting control, this study is unique in addressing three different control options simultaneously, over a long-term field study, in an open-plan office, and with detailed occupant surveys (to be reported in subsequent publications). Overall, the results of this field-study show that lighting systems incorporating both automatic and personal controls have the potential to realize considerable energy savings and peak power reductions in
open-plan environments, while being at the same time positively perceived by the occupants. Demonstrating these findings in an open-plan setting is particularly important because this is the most common office environment in North America, and because recommended practice has often assumed that controls such as occupancy sensors and individual dimming cannot be successfully implemented in spaces without full-height walls.
ACKNOWLEDGEMENT
This project was a collaboration between the Institute for Research in Construction (IRC) of the National Research Council of Canada (NRC), Program on Energy Research and Development (PERD), Public Works and Government Services Canada (PWGSC), BC Hydro Power Smart, and Ledalite Architectural Products. The authors are grateful to Roy Hughes, Sunny Dhannu, Tyler Nitsch, Caroline Ngan, Kevin White, Rico Luk, and Zorawar Bhatia, all of BC Hydro Power Smart, for their support in the field implementation of the data acquisition systems and their regular interaction with the building occupants. Special thanks are also due to Jindra Ryvola and Ron Scott, of Ledalite Architectural Products, for customizing the lighting system monitoring software for this project and for their valuable assistance with the data interpretation. We would also like to acknowledge Cara Donnelly, Jennifer Veitch, Chantal Arsenault, Roger Marchand and Christoph Reinhart, all of NRC-IRC, for their contributions in all of the aspects of the project.
REFERENCES
ASHRAE. ANSI/ASHRAE/IESNA Standard 90.1-2004. Energy Standard for Buildings Except Low-Rise Residential Buildings. American Society of Heating, Refrigerating and Air-Conditioning Engineers, Atlanta, USA.
Bordass W, Heasman T, Leaman A, Perry MJ.1994. Daylight use in open plan offices: The opportunities and the fantasies. Proceedings of National Lighting Conference and Daylighting Colloquium. Cambridge. Robison College. London. UK:CIBSE; p 243-256.
Boyce PR, Eklund NH, Simpson SN. Winter 2000. Individual lighting control: Task performance, mood, and illuminance. Journal of the Illuminating Engineering Society; p 131-142.
Boyce PR, Veitch JA, Newsham GR, Myer M, Hunter C. 2003. Lighting quality and office work: A field simulation study. Richland. WA. USA. Pacific Northwest National Laboratory. <http://irc.nrc-cnrc.gc.ca/pubs/fulltext/b3214.1/> last accessed April 2007.
Carter D, Slater A., Moore T. 1999. A study of occupier controlled lighting systems. Proceedings of the 24th Session of the CIE. Warsaw. Poland.1(2): 108-110.
Charles KE, Veitch JA, Farley KMJ, Newsham GR. 2003. Environmental satisfaction in open-plan environments: 3. Further scale validation (IRC-RR-152), Ottawa.
Canada. National Research Council of Canada. Institute for Research in
Construction. <http://irc.nrc-cnrc.gc.ca/pubs/fulltext/nrcc47630/> last accessed April 2007.
Escuyer S, Fontoynont M. 2001. Lighting controls: A field study of office workers’ reactions. Lighting Research and Technology. 33(2): 77-96.
Figueiro MG. January 2004. Occupancy Sensors: Are there reliable estimates of the energy savings?. Lighting Design + Application (LD+A).
Heschong Mahone Group. 2006. Sidelighting photocontrols field study. Report #06-152, prepared for the Northwest Energy Efficiency Alliance.
<http://www.nwalliance.org/research/reports/152.pdf> last accessed May 2007. Jennings JD, Rubinstein FM, DiBartolomeo D, Blanc SL. 1999. Comparison of control options in private offices in an advanced controls testbed. Ernest Orlando Lawrence Berkeley National Laboratory. Environmental Energy Technologies Division. LBNL-43096.
Jennings JD, Rubinstein FM, DiBartolomeo D, Blanc SL. 2000. Comparison of control options in private offices in an advanced controls testbed. Journal of the Illuminating Engineering Society. 29(2):39-60.
Lee ES, Selkowitz SE. 2006. The New York Times Headquarters daylighting mock-up: Monitored performance of the daylighting control system. Energy and Buildings. 38(7): 914-929.
Love J, 1995. Field performance of daylighting systems with photoelectric controls. Proceedings of the 3rd European Conference on Energy-Efficient Lighting – Right Light 3. Newcastle. England. p 75-82.
Maniccia D, Rutledge B, Rea MS, Morrow W. 1999. Occupant use of manual lighting controls in private offices. Journal of the Illuminating Engineering Society. 28(2): 42-56.
Moore T, Carter DJ, Slater AI. 2001. A comparative study of user opinion in offices with and without individually controlled lighting. Proceedings of the 9th European Lighting Conference (Lux Europa). Reykjavik. Iceland. p 234-241.
Moore T, Carter DJ, Slater AI. 2002. A field study of occupant controlled lighting in offices. Lighting Research and Technology. 34(3):191-205.
Moore T, Carter DJ, Slater AI. 2002. User attitudes toward occupant controlled office lighting. Lighting Research and Technology. 34(3): 207-219.
Moore T, Carter DJ, Slater AI. 2003. Long-term patterns of use of occupant controlled office lighting. Lighting Research and Technology. 35(1):43-59.
Natural Resources Canada (NRCan). August 2006. Energy Use Data Handbook, 1990 and 1998 to 2004.
<http://oee.nrcan.gc.ca/corporate/statistics/neud/dpa/data_e/handbook05/Datahand book2005.pdf> last accessed April 2007
Newsham GR, Mahdavi A, Mathew P, Cornick SM, Sander DM, Brahme R. 1998. Impact of the adoption of efficient electrical products and control technologies on office building energy use. ASHRAE Transactions. 104(2): 286-298, 1998.
Newsham GR, Veitch JA, Arsenault C, Duval C. 2004. Effect of dimming control on office worker satisfaction and performance. Proceedings of the IESNA Annual
Conference. Tampa. FL. USA. p 19-41. <http://irc.nrc-cnrc.gc.ca/fulltext/nrcc47069/> last accessed April 2007
Newsham GR, Mancini S. 2006. The potential for demand-responsive lighting in non-daylit offices, Leukos, 3(2):105-120.
Pigg S, Eilers M, Reed J. 1996. Behavioral aspects of lighting and occupancy
sensors in private offices: A case study of a university office building. Proceedings of ACEEE Summer Study on Energy Efficiency in Buildings. Pacific Grove. USA. p 8.161-8.170.
Roche L, Dewey E, Littlefair P. 2000. Occupant reactions to daylight in offices. Lighting Research and Technology. 32(3):119-126.
Slater A. 1995. Occupant use of lighting controls: A review of current practice, problems, and how to avoid them. Proceedings of the CIBSE National Conference. Eastbourne. London. UK. p 204-209.
Slater A. 1996. Lighting controls in offices: How to improve occupant comfort and energy efficiency. Proceedings of the CIBSE National Lighting Conference. Bath. UK. p 178-184.
Slater A, Carter D. 1998. A field study of lighting levels in offices. Proceedings of the CIBSE National Lighting Conference. London. UK. p 23-33.
Slater A, Carter D, Moore T. 1998. A study of lighting in offices equipped with occupant controlled systems. Proceedings of the 1st CIE Symposium on Lighting Quality. Ottawa. Canada. p 219-227.
Veitch JA, Newsham GR. 2000. Preferred luminous conditions in open-plan offices: Research and practice recommendations. Lighting Research and Technology, 32:199-212.
Wyon DP. 1999. Enhancing productivity while reducing energy use in buildings. RAND Conference Proceedings.
<http://www.rand.org/pubs/conf_proceedings/CF170.1-1/CF170.1.wyon.pdf> last accessed April 2007