READ THESE TERMS AND CONDITIONS CAREFULLY BEFORE USING THIS WEBSITE. https://nrc-publications.canada.ca/eng/copyright
Vous avez des questions? Nous pouvons vous aider. Pour communiquer directement avec un auteur, consultez la
première page de la revue dans laquelle son article a été publié afin de trouver ses coordonnées. Si vous n’arrivez pas à les repérer, communiquez avec nous à [email protected].
Questions? Contact the NRC Publications Archive team at
[email protected]. If you wish to email the authors directly, please see the first page of the publication for their contact information.
NRC Publications Archive
Archives des publications du CNRC
This publication could be one of several versions: author’s original, accepted manuscript or the publisher’s version. / La version de cette publication peut être l’une des suivantes : la version prépublication de l’auteur, la version acceptée du manuscrit ou la version de l’éditeur.
Access and use of this website and the material on it are subject to the Terms and Conditions set forth at
Creation of Live Virtual Reality Model of Real Environments from
Sensor Fusion
Boulanger, Pierre; Lapointe, Jean-François; El-Hakim, Sabry
https://publications-cnrc.canada.ca/fra/droits
L’accès à ce site Web et l’utilisation de son contenu sont assujettis aux conditions présentées dans le site LISEZ CES CONDITIONS ATTENTIVEMENT AVANT D’UTILISER CE SITE WEB.
NRC Publications Record / Notice d'Archives des publications de CNRC: https://nrc-publications.canada.ca/eng/view/object/?id=5ea8db33-3f2a-4687-a7b9-0acb5a174b79 https://publications-cnrc.canada.ca/fra/voir/objet/?id=5ea8db33-3f2a-4687-a7b9-0acb5a174b79
National Research Council Canada Institute for Information Technology Conseil national de recherches Canada Institut de technologie de l’information
Creation of Live Virtual Reality Model of Real
Environments from Sensor Fusion *
Boulanger P., Lapointe J.F., El-Hakim, S.F. May 2000
* published Proceedings of the 24th Workshop of the Austrian Association for Pattern Recognition, Applications of 3D-Imaging and Graph-based Modeling. Villach, Austria. May 25-26, 2000. NRC 45000.
Copyright 2000 by
National Research Council of Canada
Permission is granted to quote short excerpts and to reproduce figures and tables from this report, provided that the source of such material is fully acknowledged.
Creation of Live Virtual Reality Model of Real Environments
from Sensor Fusion
1Pierre BOULANGER, Sabry ELHAKIM, and Jean-François LAPOINTE National Research Council of Canada
Institute for Information Technology
[Pierre.Boulanger] [Sabry.Elhakim][Jean-Francois.Lapointe]@nrc.ca
ABSTRACT
This paper describes a generic technology for modeling in real time the various operations of surface and underground mines. Based on various sensor fusion techniques and high-speed
network, a virtual reality model of a mine capable of representing not only static infrastructures but also mobile equipment such as trucks and excavators is created. The modeling technique deal with a wide range of sensors such as survey data, satellite pictures, ore concentration, machine
condition indicators, video, sound, real-time GPS locator, range sensor, etc. The model created allows for every piece of information to be displayed in context allowing for a better temporal and spatial correlation of events by mine operators, planners, and supervisor. Syncrude, a Canadian mining company located in northern Alberta, is planning to use this technology, not only to
understand oil sands mining processes better, but also to give decision-makers better access to the timely, accurate information from the field that they need to make informed decisions.
1
In the proceeding of the 24th Workshop of the Austrian Association for Pattern Recognition "Applications of 3D-Imaging and Graph-based Modeling", Villach, Austria, May 25th and May 26th, 2000 (invited).
1 INTRODUCTION
One of the goals of this project was to demonstrate that safe, effective and reliable monitoring and control of mine operations can be performed over satellite and terrestrial communication links, including the Internet [Gillett,1999][Lipsett,1998]using models created from various sensors located in a mine. Using this system, supervisors and planners can easily access information from equipment, such as production data and condition monitoring information anywhere around the world. With such a system, a specialist can remotely access data to solve a problem without having to be transported near the mining site, thus saving time and money.
The system uses the NRC Virtualized Reality toolkit developed especially for this type of
application. The toolkit is an add-on to the SGI Performer library allowing for the direct connection between sensor data located on the Internet and a graphic action in the VR world. Based on this library, a generic viewer was developed allowing visualization of the multitude of information necessary to create an advance mining information management system.
The live 3D model of the mine used in this system is created from various sensor fusion techniques ranging from photogrammetry to dynamic 3D geometric modeling. This virtual reality model represents not only static infrastructures such as building and underground mine corridor, but also mobile equipment such as trucks and excavators. The modeling technique deal with a wide range of sensors such as survey data, satellite pictures, ore concentration, machine condition indicators, video, sound, real-time GPS locator, range sensor, etc.
Using this virtualized reality system, every piece of information is displayed in context allowing for a better temporal and spatial correlation of events. Syncrude, a Canadian mining company located in northern Alberta, is planning to use this technology, not only to understand oil sands mining processes better, but also to give decision-makers better access to the timely, accurate information from the field that they need to make informed decisions.
In the following sections, we will discuss the different aspects of this system from the point of view of model building, network data communication, sensor systems, system integration, and human factors.
2 ARCHITECTURE
OF
THE
SYSTEM
The system is composed of five main sub-systems (Figure 1 shows a block diagram of the system): • a modeling station,
• an observer station, • an operator station,
• a data communication controller,
• an on board remote monitoring sensing system.
Each sub-system is connected via available terrestrial or satellite links possessing various levels of quality and speed over potentially great distances. To achieve this over any distributed system node, whether it is remote equipment, an operator station, or an observer station; the system must be capable of receiving data communications from any other system node in as timely manner as possible. Additionally, given the bandwidth and latency limitations of data communication links over large distances, the system must address the time differences that are inevitable between physical events and the corresponding received data.
This current prototype employs the XT Communicator software from Xyphos corporation to form this communication backbone. This product consists of agents installed in every computer
comprising the system and then forms a virtual private network amongst them. Using this product, the interconnection of data communications between network nodes and the sharing of data that is of interest to several nodes is made transparent to the application software.
With this approach, the system interconnections are open and scaleable to any number of network node entities. Furthermore, the actual physical layer of the communications network is left open. Data formats for the system are also open and determined by the producers of data.
Sensors Real-time Database Physical Simulation Video Sound Joint Encoders, Etc. Corporate memory Operational Instructions Manuals Operator and Modeling Stations Observer Stations High Speed Networks Parallel Computers Actuators Automated Data Analysis Network
The data communications networks used in this prototype are based on Internet communication and employ RF data links at the remote work site to tie mobile equipment into the network. In order to vary the network performance over a wider range for comparison purposes, an additional high-speed link employing a satellite to yield higher data rate communications between the operator station and the work site equipment, was used.
3 MODELING
STATION
In order to locate information in a geographic information system one must first create a 3D model of the mine terrain and infrastructures as well as dynamic objects populating this terrain such as excavators and trucks. Many techniques are used to create such models but most of these models must follow some basic criteria.
• The model must be accurate.
• The model must be easily interpreted.
• The model must be compatible with VR display systems. • Each model should have various levels of detail.
The most common representation of a VR model is by the use of a scene graph technique
[Wernecke, 1994]. Contrary to a pure geometrical representation where no optimization is possible, a scene graph can be optimized to hide various latencies of the display and communication system. This is because a scene graph is a structured representation of the various relationships between elements of a scene. A scene graph allows for easy propagation of properties along the hierarchy as well as allows the notion of level of details and context switching.
One of the most important and fundamental problems in VR modeling is the selection of the right level of detail (LOD). This requirement comes from a fundamental compromise between display speed and model complexity. By using a well designed scene graph one can hide various latencies such as display speed and communication load using techniques such as geometric and
communication LOD and graph culling. This is an important consideration since a complete mine model can be extremely large.
To prepare the various models used in this system a modeling workstation combining various in-house and commercial software was developed. Realax Corporation developed the scene graph editor RxScene used in this project. This editor allows for easy graphic style editing of the scene graph and is truly compatible with the Performer library. In the next section, we will describe the various phases used to prepare the VR mine model.
4 TERRAIN
MODELING
The mine terrain model was created from differential GPS survey data supplied by Syncrude. The precision of the data set was in the order of 20 cm. This is quite good considering the fact that the mine covers an area of approximately 5-km by 5 km. As one can see in Figure 2b, these data come in a relatively sparse form, usually because surveyors follow roads or the edge of a cliff. To
transform the sparse data into a useful terrain model, we created a triangle mesh approximating the measured data. In order to do so, we used a 3D Delaunay triangulation algorithm [Edelsbrunner, 1998] implemented in a commercial software called WRAP supplied by Geomagic Inc. The software produced very good results and the resulting terrain model required minimal post-processing.
The second phase of the modeling project was to register a LANDSAT satellite picture against the terrain model (see Figure 2c). Using the road structures as our guide and a projective texture mapping software developed in-house, we were able to manually locate the correspondence between the terrain model and the texture. One can see in Figure 2b the resulting terrain model combining the satellite texture and the survey data. We also experimented with various automated registration algorithms [Weinhaus, 1997] but most of them did not produce results as good as the manual technique. The main reason is that it is hard to detect the same structures between the terrain model and the picture.
The third phase of the terrain modeling process was to add the ore concentration as an overlay. In most mining operations a series of regularly spaced drillings are performed in a rectangular manner over the region to be excavated. The drillings positions are determined using a differential GPS (DGPS) system in a central mine coordinate system. Each drilling core is then analyzed for bitumen concentration as a function of depth. The resulting data set is a volumetric map of ore concentration. In order to create a color map of the ore concentration for a given terrain condition, a color texture was generated and overlaid over the terrain model. Since each ore concentration datum is not really on a regular volume, an interpolation algorithm was implemented to estimate the ore concentration over a regular volume of size 20 m x 20 m x 20 m. From the resulting structure one can then slice the volume of data to any depth and produce a high-density texture map used to create the overlays. The slicing surface is the terrain model at its current depth. An update of the texture can be
performed as new estimates of the terrain shape are computed. One can see in Figure 2a the various layers of the ore data and in Figure 2b the texture map over the terrain model.
Figure 2: Model creation process for the north mine model.
(a) Ore concentration data, (b) Final model with survey data overlaid, and (c) LANDSTAT picture of the region
The last part of the modeling technique consists on optimizing the geometry for VR viewing. Techniques such as dividing the terrain model in smaller sections to optimize the culling process and the transformation of the LANDSAT texture into Clip Texture to minimize the usage of texture memory were used.
5 MODELING INDOOR STRUCTURES
One of the main problems in indoor mapping, particularly for large underground mine, is error propagation in the absence of GPS or control points. All measurements are made relative to a mobile platform that digitize the mine corridors while the absolute position is not accurately known
because of the inaccuracy (drift, or error rapidly increases over time) of dead-reckoning devices (wheel odometers) or inertial navigation systems. Our solution is specifically designed to solve this error propagation problem. It has the following features:
1. Solve all data simultaneously, rather than sequentially, using dead-reckoning data only as initial values and using range sensor data as constraints.
2. Use sufficient number of cameras, the relationships between which, in one position, are known from the calibration procedure. This will be used as additional constraints.
3. Design camera external configuration to provide a strong geometric solution thus reducing error propagation.
5.1 System Components
The proposed systemhas been designed to implement the features mentioned above. The sensor configuration is designed for coverage of side wall and ceiling of an indoor site. Modifications can be easily made to cover other views, for example a front view. The system consists of a data acquisition platform, a calibration structure, and a workstation. A relatively large site has been constructed to test the system. Each component will be described in some detail in the following sections.
5.1.1 The Data Acquisition Platform (DAP)
Figure 2 shows the mobile data acquisition platform (DAP) and the mounted cameras. There are twelve CCD cameras, one Biris range sensor mounted on a pan and tilt unit, and a color digital camera used to get high precision color textures. A PC dedicated to acquire and store the images is also shown.
5.1.2 The 3-D range sensor: BIRIS
Biris
Figure 3 : Data Acquisition Platform Color Digital
Camera Positioning
Cameras
Local Computer
One of the unique components of this system is the range sensor: Biris (named for bi-iris). It is designed to acquire accurate range data at a wide variation of ranges (between 0.5m to 4.0m for the model used here). The basic optical principle of the range sensor is shown in Figure 3. The
technique uses a modified Biris principle that includes a standard plane of light method to increase both range and depth of field of the basic technique[Blais, 1991]. Because of the two apertures mask and the defocusing of the image, range is obtained by either measuring the average position
p=p1+p2 of the two laser spot images p1 and p2 on the CCD photo-detector (plane of light method),
or their separation b=p2-p1 (Biris method). The Biris sensor itself has already been demonstrated for
applications of mobile navigation and environment modeling and mapping[Blais, 1996]. However for large volume of measurements with large depth of focus (e.g. 0.5 m < z < 4 m) such as those expected within indoor virtual environments, the defocusing of the laser images on the CCD, can become prohibitive.
In order to reduce this effect one can focus the lens such that depth offocus is maximized, but then a sign ambiguity in the measurement b=p2-p1 of the Biris method is present. Splitting the imaging
lens in two or using an axicon [Rioux, 1991] automatically creates a small offset/separation in the peak positions. Depth of focus is then doubled compared to the original method and sign ambiguity is resolved. p2 Laser CCD Object p1 mask
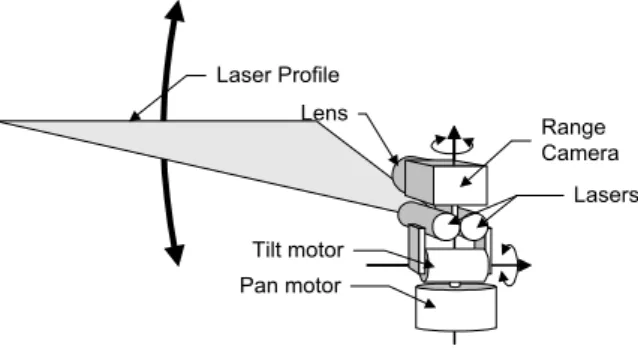
Figure 5: Optical Principle of the Biris/Plane of Light method 5.1.3 Mounting devices: Pan-Tilt Scanning Unit
In order to completely cover the surrounding of the vehicle, the range sensor was mounted on a pan-tilt scanning unit from Directed Perception Inc. The pan-pan-tilt unit (Figure 6 and 7) can be used to scan the 3-D laser profile around a 360° pan angle and a 85° tilt angle.
Figure 6. Photograph of the 3-D Range Sensor and its Pan-Tilt Unit
Lasers Range Camera Lens Pan motor Laser Profile Tilt motor
The scanning parameters as well as the image resolution are computer controlled and therefore fully programmable. Different modes of low resolution and high-resolution images can be
preprogrammed to almost completely cover the surroundings of the vehicle. 5.1.4 The calibration and registration structure (CRS)
One of the most critical steps in the mapping procedure is the calibration of the sensors. The aim of calibration is to find the parameters defining the relationship between sensor measurements, in its local coordinate system in image space, and the desired measurements in the global coordinate system in the object space. The calibration parameters can be determined using sensor
measurements on targets of known positions in the global coordinate system. These targets must be firmly and securely placed on a solid and stable structure. These targets are also used to register the data from all the different sensors in the same global coordinate system.
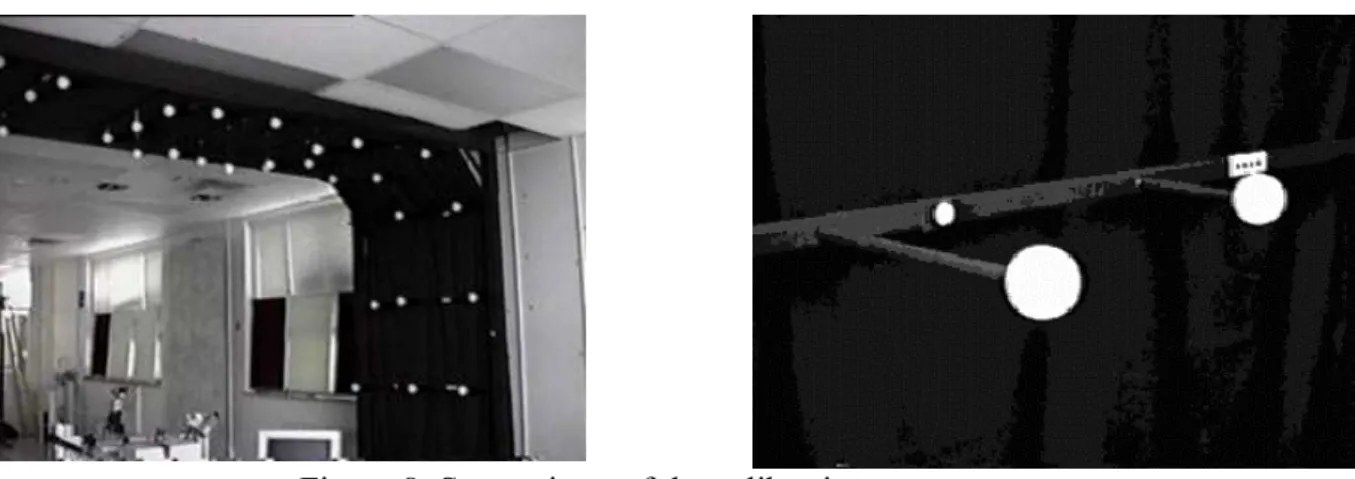
Figure 8 shows the calibration and registration structure from various viewing angles. The calibration targets are chosen to be spherical in shape. This allows them to be viewed from any angle or direction without being geometrically distorted. The targets were surveyed with a Leica T101 3”-theodolite to a positioning accuracy of 0.08 mm.
Figure 8: Some views of the calibration structure
The CRS is used to calibrate the 8-CCD cameras and the Biris scans taken at a single position. The calibration parameters for the cameras and scans are all in the same coordinate system defined by the theodolite measurements of the spherical targets.
5.2 THE 3-D MAPPING PROCEDURES
The computational mapping paradigm consists of the following steps:
1- Data collection and processing.
2- Building of the 3-D model.
3- Texture mapping.
Several software modules was developed to implement the various procedures. Each these steps will be described in the next sections, but let us first describe in some details the method used to position the DAP.
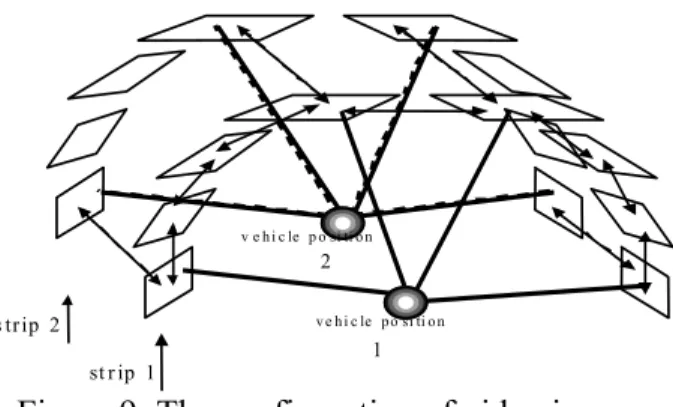
In Figure 9, images within one strip (in one vehicle position) are pre-calibrated, i.e. their parameters relative to each other are known. Images in different strips are of unknown location relative to each other. These parameters are computed from the so-called bundle adjustment approach[ Brown, 1976]. Therefore, in the bundle adjustment, additional constraints in the form of the known relationship of the image in each strip are utilized to strengthen the solution.
Each point p, extracted from an image i, has two image coordinate, x and y, and contributes two equations:
)
,
,
,
,
,
,
,
,
(
)
,
,
,
,
,
,
,
,
(
i i i i i i p p p y p i i i i i i p p p x proll
yaw
pitch
Z
Y
X
Z
Y
X
f
y
roll
yaw
pitch
Z
Y
X
Z
Y
X
f
x
=
=
(1)The parameters on the right-hand-side of the above equations are the XYZ coordinates of the point
p in the required 3-D coordinate system, and the camera position and orientation (six parameters) in
the same coordinate system. Those six camera parameters are the same for all points measured in the same image, however each point adds three new XYZ coordinates.
st r ip 1
s tr ip 2 v e h i c le p o si ti o n v e h i c le p o si ti o n
1 2
Figure 9: The configuration of video images
Since each point adds only two new equations, the solution for all the unknown parameters is not possible. If some of these points appear in another image, they will not add any new XYZ
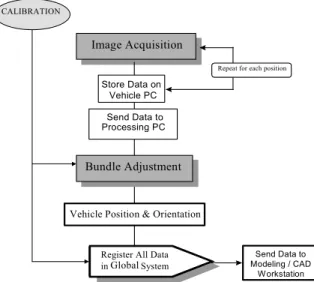
coordinates, but six new camera parameters are added. In the case where sufficient number of overlapped images with sufficient number of common points, the number of equations are usually larger than the number of unknowns thus a solution is possible. This is the main principle of the photogrammetric triangulation approach known as bundle adjustment. The system of equations to be solved is an over-determined nonlinear system that requires an iterative solution. In the first iteration, initial values for the unknowns must be provided. If these values are too far from the correct values and the geometric configuration of the cameras is poorly suited for triangulation, this iterative solution will break down. In outdoor mapping systems, the vehicle position, and thus the camera positions, are determined by GPS and INS combination and thus not solved. In indoor mapping, however, since the GPScan not be used, the system must solve for all the parameters. The proposed solution overcomes the above mentioned problems associated with the bundle adjustment. Figure 10 describes the procedure.The main steps are:
• A dead reckoning system, such as wheel encoders, provides initial values for camera position and orientation.
• In order to strengthen the geometry of the triangulation, data from the range sensor are used.
The added constraint is in the form of geometric relationships between extracted points from the range sensor image and the video image as follows:
The relationships between the images of the 8 CCD cameras are accurately pre-determined by a calibration procedure. This results in another set of constraints to strengthen the solution:
0 ,....) , , , , , , , , ,..., , , , , ,
(X1 Y1 Z1 pitch1 yaw1 roll1 X 8 Y8 Z8 pitch8 yaw8 roll8 a b c =
f i i i i i i i i i i i i (2)
This equation describes the relationship between the positions and orientations of a set of 8 CCD-camera images (a strip of images). The constants a, b, c… are known from the calibration step.
Image Acquisition
Store Data on Vehicle PC Send Data to Processing PC
Repeat for each position
Bundle Adjustment
Vehicle Position & Orientation
Register All Data inGlobalSystem
Send Data to Modeling / CAD
W orkstation CALIBRATION
In the registration procedure a sufficient number of targets of precisely known positions are imaged by all the sensors. The known positions of the targets are used to solve for the CCD-camera
parameters and to establish the relationship between the range sensor coordinate system and the CCD-cameras. The result of this procedure is that all data have a common reference system defined by the coordinates of the calibration targets.
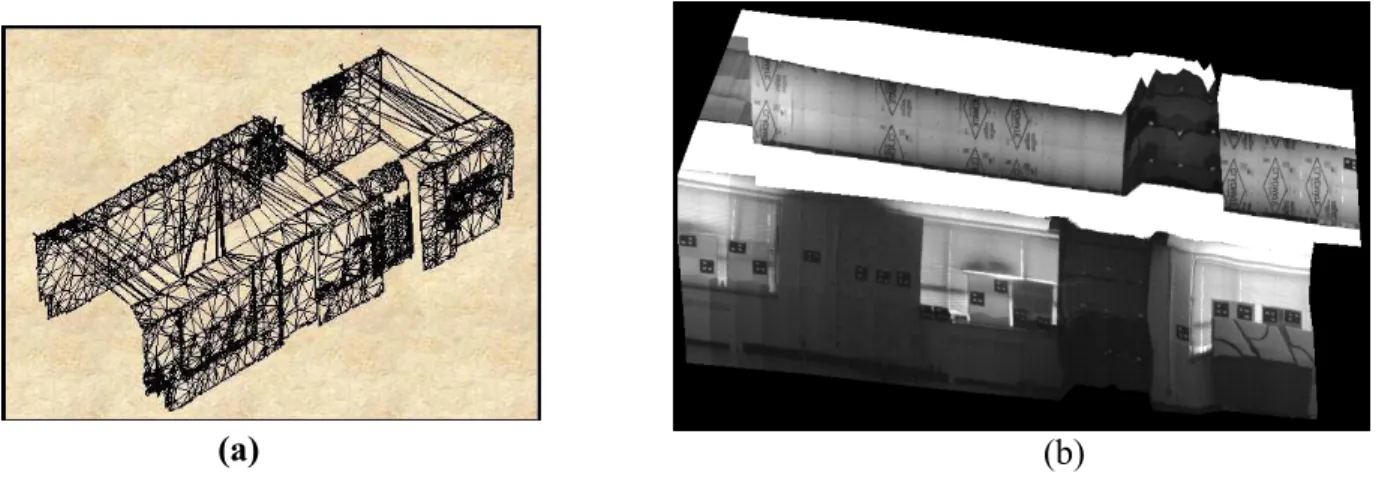
5.2.2 Building the 3-D model
The registered images generated from the previous steps contain a huge number of points each of which has XYZ coordinates in the global coordinate system. Even for a relatively small volume, for example a few meters of space, the size of data may become unmanageable. Therefore, a more suitable geometric representation of the data is required in order to display and interact with this data. The most suitable representation is a non-redundant triangular mesh. The registered 3-D images, from the Biris sensor, will now be converted from XYZ points into a single triangular mesh that can be efficiently rendered on any graphics system. Since there will be an overlap between any successive images, it is required that the redundant data be first removed. An algorithm for building a non-redundant mesh-model from a large number of overlapped 3-D images has been developed at NRC and was applied to all data collected in this experiment[Roth, 1995].
Figure 10: Simplified block diagram of the computation procedure.
(a)
(b)
Figure 11: 3-D model of the site. (a) Geometric model, (b) Geometric model plus texture.
5.2.3 Texture Mapping
While the generated geometric model is useful for managing the 3-D construction of the site, the user may need to work with other types of data or information. Other sensory information, such as light intensity from CCD video images, can be precisely mapped into the geometric model provided that the sensor position and orientation is known in the coordinate system of the geometric model. In this system, this data is available since the parameters for each video image are computed in the bundle adjustment procedure. Given the 3-D coordinates of the vertices of a polygon, the corresponding projections of these vertices in a video image can be located. The light intensity values within the area defined by these projected vertices are stretched and rotated to fit into its counterpart 3-D polygon. This procedure has been implemented and tested in this experiment and the results, applied to the full model, are shown in Figure 11(b).
5.3 Geometric accuracy of the 3-D mapping
All the results shown below are based on two data sets. The first is acquired with the vehicle moving from the west side of the room to the east and the second is acquired with the vehicle moving in the opposite direction and along a different path. Data are collected over a distance of 12 meters. (Volume 12m L x 5m W x 3m H). Table 2 displays the difference between coordinates obtained from the mapping system and the known coordinates of the reference targets obtained from theodolite measurements. Using the absolute mean and the median on all the points (none rejected for poor quality), the accuracy was about 0.6 mm, or one part in 20,000. When poorly defined features were removed, the accuracy numbers improved by a factor of two. The achieved accuracy, particularly on well-defined points, is close to what can be achieved using one strip of images (next section). This shows that error propagation is very small.
Table 2: Difference between computed and known distances. ALL points ALL points Well-defined points | mean | median | mean | 0.69 mm 0.56 mm 0.30 mm 1 : 17,000 1 : 21,000 1 : 40,000 (a)
6 MODELING OUTDOOR INFRASTRUCTURES
In the next phase of model creation, we will describe how to create a 3D representation of the mine infrastructures. In order to start the modeling phase; we first need to get the exact position of the footprint of each building. This is usually performed using the DGPS system. Using this footprint, one can model the building using photogrammetric techniques. Photogrammetric techniques compute the 3D position of a point in an image relative to the camera from two or more pictures taken from different locations. It is beyond the scope of this paper to describe photogrammetric methods in detail. One can refer to the large body of work in this field to get more detailed information [Brown,1976] [ElHakim,1997].
Before any measurement is performed, one must first calibrate the camera to determine all the internal calibration parameters such as pixel size, lens distortions, etc. Once the camera is
calibrated, we need to be able to determine from a common point in the image, the orientation of the camera and the 3D position of the points selected. If some of these 3D points correspond to the footprint of the building as measured by the DPGS, a rigid transformation between these points is computed and applied to the rest of the measurements. The resulting data set is in the central coordinate system of the mine and can be easily integrated with the terrain model.
The last phase of the model building process consists of using these measurements to create a series of textured polygons representing the main features of each building. The textures are extracted from the pictures by using a back projection algorithm [El-hakim, 1998]. This is the lengthiest part of the modeling process.
If one wants to model a building with a large amount of detail, one has to spend a long time extracting the measurements for each of these features. In this project, we used in-house software called ShapeCapture. In Figure 12, on can see a 3D-textured model of the NRC M50 building created by ShapeCapture software.
7 MODELING
EQUIPMENT
So far, we only dealt with the static part of the model. However, we also need to model the
equipment. Contrary to the static part of the model such as the terrain or the infrastructure which do not have any dynamic section, the equipment models must have moving sections that need to be actuated.
One technique to model such systems is to start from a drawing and use an advanced modeling Figure 12: 3D textured model of NRC building created by ShapeCapture.
software such as 3D Studio to build a geometric representation of the equipment, i.e., model separately, every moving parts. Once each moving part of the equipment is built, we can then connect them topologically by using a scene graph technique. One can see in Figure 13 the 3D model of the Hitachi EX200 excavator used in these experiments and in Figure 14 a section of the scene graph representing the model.
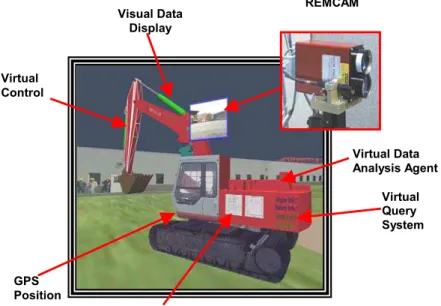
A complete kinematics model of the excavator has been developed, allowing a fully articulated model that can be controlled and animated by data coming from either a control device (a joystick here) or from sensor data measured from the real excavator (joints positions sensors in this case). The animation is performed by associating to each moving joint a dynamic coordinate system that is connected virtually to a sensor. Using this technique, we had to create many new scene graph nodes to accommodate all sorts of new functions. Using this technique one can replace the texture of a polygon by video images coming from an active video camera called REMCAM located on the network, or change the color of a hydraulic actuator as a function of its pressure. In fact, one can map any sensor to any property defined in the scene graph as long as a transfer function is supplied. Added to the excavator model were also hot points allowing for data queries and the activation of video clips or the replay of engine sounds.
REMCAM Virtual Control Virtual Query System Virtual Data Analysis Agent
Virtual Diagnostic Interface Visual Data
Display
GPS Position
Figure 13: Virtual Avatar of the Hitachi EX200 excavator
The system can also allow data browsing through the drawing of the excavator or display
maintenance reports. All these functions were also represented as part of the excavator scene graph. 8 OBSERVER AND OPERATOR STATIONS
The benefit of IIRO for surface mining is that personnel can observe, and in real-time, the status and productivity of equipment, thus providing greater awareness about the ongoing mine activities. The observer station is a prototype version of a display environment in which mine information (payload, machine condition, and other parameters) is shown in the context of the equipment modeled in the virtual environment. An observer can look at the location of a fleet of mobile equipment within a global world model to observe overall mine operations, or zoom in on a specific on-board system, such as an engine. Sound bites and video clips are incorporated to add to reality of the visualization. From the hardware point-of-view the observer station is composed of a large back-projected screen system of 8' x 10' in dimension. The projector is an Electrohome 9500LC producing an image with SXGA resolution at 260 lumens. An Infinite Reality Engine refreshes the stereo images of the virtual environment every 1/10 of a second. Linked to this graphic
supercomputer is a local high-speed network connecting various PC computers in charge of sound, communication, video, and user interface.
A lotof attention has been given to the design of the user interface (UI), since it is a key factor when comes time to evaluate the usefulness of a product. The design criteria used here are the ease of use and the ease of learning. For that purpose, we developed a keyboardless, two-handed UI that combines a mouse and a three DOF joystick that are used in parallel.
Two mutually exclusive operator modes (monitoring and control) are possible and can be selected by using the mouse. In the monitoring mode, the joystick is used to navigate in the environment while the mouse is used to display information about the instrumented machines by clicking on specific parts of them. The clickable parts are highlighted to indicate their function when they are brushed by the mouse, i.e. when the mouse cursor is over them, as illustrated in Figure 4 (virtual query system). The highlighting style indicates the function of the object, which can be either to query and display information about it (sensor information or others), or to toggle between the monitoring and the control mode. Also, in the monitoring mode, the pose of the trucks and the excavator are displayed by placing the avatars in the same pose as the real ones.
In the control mode, the joystick is used for the rate control of the virtual excavator joints in either joint or coordinated control mode [Withney, 1969]. The operator chooses the type of control mode (joint or coordinated) by clicking on a different mouse button. The coordinated control mode allows the direct control of the bucket motion instead of having to coordinate the movement of each
separate joint of the excavator. It has been implemented in order to help novice users for the control of the excavator since it has been shown that this control mode significantly improves their initial performance compared to the traditional joint control [Lapointe, 1999]. Once that the virtual
excavator is positioned correctly, the operator push the joystick’s trigger to transmit joints positions of the virtual excavator through the network to the real excavator. The real excavator then uses a local position controller to position itself accordingly to the virtual excavator pose, before sending back an acknowledgement signal to the operator station. It is important to note that both the monitoring and control mode require a calibration of the virtual world with the real one.
9 DATA COMMUNICATION CONTROLLER
communication infrastructure becomes critical for initialization, maintenance, and failsafe
performance of the system. Within the virtual private network, the current system prototyped here employs a network bulletin board implementation which all network nodes use to post their latest status. In this way, any node that requires data from other nodes can check their status using the bulletin board and thereby avoid the bandwidth overhead associated with the use of embedded heartbeat data and regular dedicated heartbeat packets.
The processing of all the incoming data from the mine site also required the development of a central local communication controller that is exclusively used by the observer station. This controller is in charge of data synchronization, logging operation, dealing with obsolescence, data validity, formatting, firewall, and allow to separate display from communication issues.
9.1 On-board remote monitoring sensing system
The remote equipment system for the Hitachi EX200 excavator was retrofitted with remote-control capabilities using their CAN-networked Genie II controllers and a number of sensors installed to provide condition indicators for overall machine health monitoring. The sensors are used to measure hydraulic pressure, joint angles, motor speed, temperature, position from GPS, etc. One particular sensor monitors the acoustic characteristics of various portions of the machine using an acoustic anomaly detection function. This sensing function also samples audio segments for
playback at the observer station. A digital camera returns up-to-date images of the workspace and a laser range is used to create local terrain model. These two imaging sensors are mounted on a remotely controlled pan-tilt unit. Using this REMCAM system (see Figure 4), video images can be texture-mapped onto polygonal surfaces measured by the time-of-flight range sensor.
Local control of the machine is accomplished with a local version of a script executor called PACE from Dynacom. This script executor issues commands to the robot control computer (RCC). The RCC communicates via a CAN bus to drive the Genie II controllers and collect machine sensor data for networked transmission back to the observer stations.
Communication between this mobile equipment and the internet-based data communication network can use in-house radio modems or digital cellular telephone modems. The RCC also gathers machine status and sensor data for trending and performance evaluation, by using wireless Ethernet modems for data transmission between the machine and local area network hardware. 10 CONCLUSION
This prototype system demonstrates that by using a combination of high-speed network, virtual reality displays, and advanced sensor technology, one can create a tool that will help decision-makers make informed decisions on the daily operations of a complex industrial site. This
technology however is only at its early stage and many research challenges must be solved before such a system becomes fully operational in a mine.
One of these research challenges will be in the collection and transmission of data from a large fleet of mobile mining machines distributed over a large territory. For a large operation, each piece of equipment should transmit their current location and all vital data necessary for maintenance and process optimization through wireless communication. In the mine of the future, there will be a need to develop advanced wireless communication networks capable of dealing with this mass of information.
The next generation of virtualized reality systems should be able to connect to existing databases and should automatically extract the pertinent information in a form that is compatible with its internal representation.
The third challenge consists of developing new algorithms capable of automatically updating the central model from new knowledge about the site. For example:
• update of the terrain model as a function of digging from multiple-sources, • addition of new equipment,
• correction and validation of information,
• addition and registration of various sensing modalities: ex: infrared sensor + range sensor.
ACKNOWLEDGMENTS
This project is the result of a collaboration between MDRobotics, the Canadian Space Agency, the National Research Council, RSI, GasTOPS, and Syncrude, co-funded by PRECARN Associates. REFERENCES
F. Blais, M. Rioux and J. Domey, “Optical Range Image Acquisition for the navigation of a mobile robot”, IEEE Conf. On Robotics and Automation, Sacramento, California, April 9-11, 1991.
F. Blais, M. Lecavalier, J. Bisson, “Real-time Processing and Validation of Optical Ranging in a Cluttered Environment”, ICSPAT, Boston, MA, p.1066-1070, Oct. 7-10 1996.
Brown D.C., “The bundle adjustment- progress and prospective “, International Archives of Photogrammetry, No 3-03-041, 33 pages, ISP Congress, Helsinki, Findland, 1976.
Edelsbrunner H. , Facello M.A., Fu P., Qian J., and Nekhayev, D.V., “Wrapping 3D Scanning Data”, Proceeding of SPIE Conf. Vol. 3313, 1998, pp. 148-158.
El-Hakim, S.F., Brenner C., and Roth G., “ A multi-sensor approach to creating accurate virtual environment”,
ISPRS Journal of Photrgrammetry and Remote Sensing, Vol. 53, 1998, pp. 379-391.
El-Hakim, S.F., Boulanger P., Blais F., Beraldin, J.A., and Roth, G., “A mobile system for 3D mapping and positioning”, Proc. Optical 3-D measurement techniques, Zurich, 1997.
Gillett, G.R., Lipsett, M.G., and Boulanger, P. Interactive intelligent remote operations. Proceedings of the 101th Annual General Meeting of the Canadian Institute of Mining, Metallurgy and
Petroleum, Calgary, AB. May 2-5, 1999. pp. 105-112. NRC 41629.
Lapointe, J.-F., “Étude de la performance humaine en téléopération: le cas forestier”, Ph.D. Thesis, École Polytechnique de Montréal, April 1999.
Lipsett, M.G., Ballantyne, W.J., Greenspan, M. “Virtual Environments for Remote Surface Mining Operations.” CIM Bulletin, January 1998.
G. Roth and E. Wibowo, “A fast algorithm for making mesh models from multi-view range data.” In Proceedings of the DND/CSA Robotics and Knowledge Based Systems Workshop, St. Hubert, Quebec, October 1995.
Weinhaus, M. and Devarjan V., “Texture mapping 3D models of real-world scenes”, ACM Computer Survey, 29(4), pp. 325-365, 1997.
Wernecke, J., “The Inventor Mentor”, Addison-Wesley Publishing Company, ISBN 0-201-62495-9, 1994.
Withney, D.E., “Resolved motion rate control of manipulators and human prostheses”, IEEE Transactions on Man-Machine Systems, Vol. 10, No. 2, 1969, pp. 47-53.