Publisher’s version / Version de l'éditeur:
Proceedings 4th International Conference on Development of the Russian Arctic Offshore, RAO99, Part II, pp. 172-179, 1999-07-06
READ THESE TERMS AND CONDITIONS CAREFULLY BEFORE USING THIS WEBSITE.
https://nrc-publications.canada.ca/eng/copyright
Vous avez des questions? Nous pouvons vous aider. Pour communiquer directement avec un auteur, consultez la première page de la revue dans laquelle son article a été publié afin de trouver ses coordonnées. Si vous n’arrivez pas à les repérer, communiquez avec nous à [email protected].
Questions? Contact the NRC Publications Archive team at
[email protected]. If you wish to email the authors directly, please see the first page of the publication for their contact information.
NRC Publications Archive
Archives des publications du CNRC
This publication could be one of several versions: author’s original, accepted manuscript or the publisher’s version. / La version de cette publication peut être l’une des suivantes : la version prépublication de l’auteur, la version acceptée du manuscrit ou la version de l’éditeur.
Access and use of this website and the material on it are subject to the Terms and Conditions set forth at
First-Year Ice Ridge Loads on the Molikpaq
Timco, Garry; Wright, B.; Johnston, Michelle; Frederking, Robert
https://publications-cnrc.canada.ca/fra/droits
L’accès à ce site Web et l’utilisation de son contenu sont assujettis aux conditions présentées dans le site LISEZ CES CONDITIONS ATTENTIVEMENT AVANT D’UTILISER CE SITE WEB.
NRC Publications Record / Notice d'Archives des publications de CNRC:
https://nrc-publications.canada.ca/eng/view/object/?id=8d4026e6-02f1-4485-bac0-6fb08cb9183f https://publications-cnrc.canada.ca/fra/voir/objet/?id=8d4026e6-02f1-4485-bac0-6fb08cb9183f
Proceedings 4th International Conference on Development of the Russian Arctic Offshore RAO’99, Part II, pp 172-179
St. Petersburg, Russia, July 6-9, 1999.
FIRST-YEAR ICE RIDGE LOADS ON THE MOLIKPAQ
G.W. Timco*, B. Wright**, M. Johnston* & R. Frederking **Canadian Hydraulics Centre National Research Council Ottawa, Ont. K1A 0R6 Canada
**B. Wright and Associates Calgary, Al., Canada
ABSTRACT
The Molikpaq steel caisson structure was used for exploratory drilling for four winters in the Canadian Beaufort Sea. During its deployment, it experienced loads from moving ice fields that had a wide range of morphology. A large number of first-year sea ice ridges interacted and failed against the Molikpaq with a variety of different failure behaviour including spine failures, failure behind the ridge, mixed modal, shear failure and stopping of the ridge. This paper reviews these failure behaviours and provides some representative information on the global loads generated during ridge interaction with the Molikpaq. The global loads were on the order of 45 MN to 90 MN which, compared to level ice crushing, are in the low to moderate range.
1.0 INTRODUCTION
Structures placed offshore have to be designed to withstand the environmental loads without failure. In many offshore regions in ice-covered waters, the loads from first-year sea ice ridges have been considered as the main design criterion. Although there have been a number of analytical theories developed to predict these ridge loads, very little is known about ridge failure processes or the loads that ridges can exert on the structure. The Molikpaq ( see Figure 1) is a wide offshore structure that was used in the Canadian Beaufort Sea for several winters, and during that time, several first-year ridges interacted
with it. This paper looks at the failure process for the ridges and provides quantitative information on measured ridge loads.
2.0 THE MOLIKPAQ
The Molikpaq structure was developed by Gulf Canada Resources Ltd. and operated by Beaudril, a subsidiary of Gulf. The Molikpaq (see Figure 1) is a Mobile Arctic Caisson (MAC) which was first deployed in the Canadian Beaufort Sea in 1984 and used for exploration drilling for four winter seasons in the Canadian Arctic. It consisted of a continuous steel annulus on which sat a self-contained deck structure. The core of
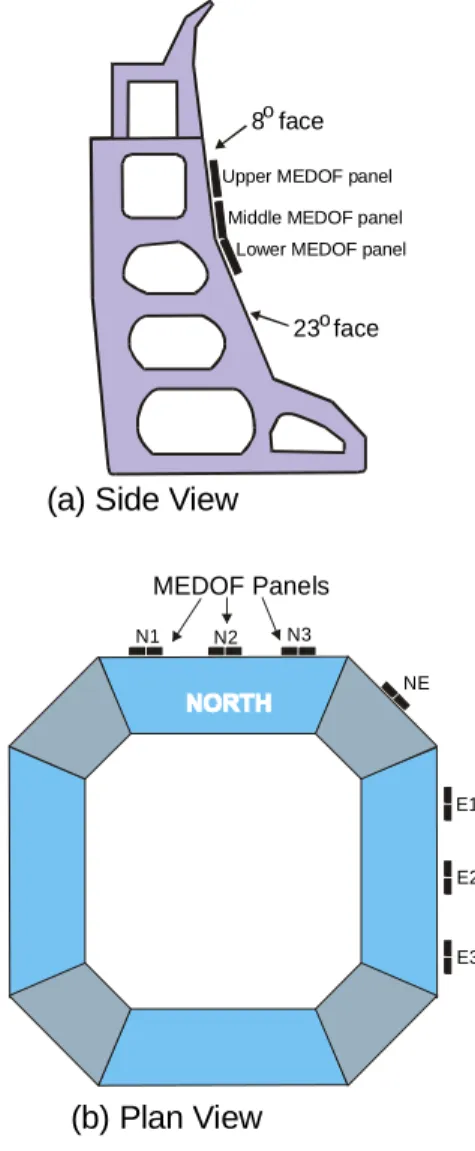
the annulus was filled with sand, which provided over 80 percent of the structure’s horizontal sliding resistance. The Molikpaq was designed to withstand the global and local loads from extreme first-year and multi-year ice. It can be used directly in water depths ranging from 9 to 21 m. In deeper waters, the structure was designed to sit on a submerged berm which varied in depth, as required. For deep water deployments, the angle of the outer face at the waterline was 8°, and in shallower draft deployments, the angle of the face was 23° (see Figure 2). Ballasting of the caissons was entirely by water. The Molikpaq was recently purchased by Marathon Oil, and it has been modified for use in the Sakhalin region offshore Russia, where it was deployed in the summer of 1998.
An extensive array of sensors was installed on the structure to provide data for analysis purposes and to help ensure operational safety. Of particular interest were the instruments for the measurement of ice loads. Three different types of instrumentation were used for this: MEDOF panels, strain gauges and extensometers. All of the instruments provided a consistent picture of the ice loads, but the MEDOF panels gave additional information on the direct ice loads. Therefore they are used here for detailed analysis of ridge interaction Events.
During the construction of the Molikpaq, thirty-one MEDOF panels were installed on the north, northeast and east faces of the caisson, providing direct ice load measurements. The panels were arranged in 7 clusters of 4 or 5 panels (see Figure 2). Each panel was 1.1 x 2.7 m in area. MEDOF panels sense the applied load over the entire panel face. The panels are a sandwich of two steel plates (inner plate about 2 mm thick and the outer plate about 10 mm thick) over an array of polymeric buttons. The panels are closed at the edges and filled with a calcium chloride solution.
Load application to the panel causes the buttons to compress and the internal volume of the panel to change. This volume change caused the calcium chloride fluid level in a standpipe attached to the panel to change. A sensitive pressure transducer is used to measure the hydrostatic head changes in the standpipe. The maximum frequency response is estimated to be about 0.5 Hz.
Figure 1 Molikpaq in the Canadian Beaufort Sea.
“Face” loads were determined from the measurement of loads on the individual MEDOF panels. To calculate the face loads, the loads in individual MEDOF clusters were first determined. There were three clusters of MEDOF Panels across each of the north (N1-N2-N3) and east (E1-E2-E3) faces with only one cluster (NE) on the northeast face (see Figure 2). To determine the load on the north face, the load for each cluster area (i.e. N1, N2, N3) was derived from the panel loads in each cluster. The results were summed to give the total measured face load. Since the panels did not cover the whole face, the summed load was increased by the ratio of the face length (59 m) to the total panel width (7.11 m) on the face. The same procedure was used for the shorter northeast face by using an
appropriate length scale. Global loads were determined using the vector sum of the individual face loads. Simple algebra was used to apportion the principal components of the loads on the short caisson faces. The loading direction was determined from the Arc Tangent of the two principal (N-S and E-W) load vectors.
MEDOF Panels N1 N2 N3 NE E1 E2 E3 (b) Plan View
Lower MEDOF panel Middle MEDOF panel Upper MEDOF panel
(a) Side View
23 faceo 8 faceo
Figure 2 Location of the MEDOF panels on the Molikpaq showing (a) side view
and (b) plan view locations.
3.0 RIDGE LOADING EVENTS
In 1985-86, the Molikpaq was deployed at the Amauligak I-65 site, which was close to the moving pack ice of the Beaufort Sea transition zone. Consequently, the structure
was subjected to a wide range of harsh moving pack ice conditions. Hundreds of ice loading Events occurred at the I-65 site. This produced a unique data set on the various failure modes experienced during first and multi-year ice interaction with a vertically sided structure. Details of these loading Events, including reports, data and videos, have been archived at the NRC Centre of Ice/Structure Interaction (Timco 1996, Timco et al. 1999a) and in the DynaMAC program (Klohn-Crippen 1998). From this information, the interaction of
first-year ridges with the Molikpaq has
been examined. Figure 3 to Figure 7 show the various failure modes that were observed during the failure of the ridges as they interacted with the Molikpaq.
The “spine” failure was a typical failure mode when relatively small ridges interacted with the structure. Failure occurred along the crest of the ridge with breaking apart of the consolidated layer. Figure 3 shows possible ice deformation behaviour that has been noted during spine failure. In Figure 3a, a ridge, which presumably has a discontinuous or variable re-frozen layer under the spine, interacts with the structure. Figure 3b shows the initial spine failure as the re-frozen layer is pushed up and down. This failure behavior continues as the advancing ice sheet is pushed under or over the ridge (Figure 3c). Finally, there is general rubble building and clearing as the ridge fragments rotate and slide along the caisson face (Figure 3d). For a large number of ridges, the ice tended to “fail behind” the ridge (see Figure 4). This occurred for all ridge sizes and across a wide range of drift speeds. It was the most common failure behavior. A ridge, which consists of a relatively thick refrozen layer, is usually frozen into a thinner host ice sheet (Figure 4a). The initial failure occurred in the level ice behind the ridge as the thinner ice deformed out of the plane of the ice cover (Figure 4b). This process
continued (Figure 4c) until there was a general rubble building and clearing (Figure 4d).
a
b
c
d
Ridge with discontinuous re-frozen layer
Initial spine failure
failure of refrozen layer continues general rubble-building, including sliding advancing ice pushed under ridge clearing around structure
Figure 3 Sequence illustration of a spine failure.
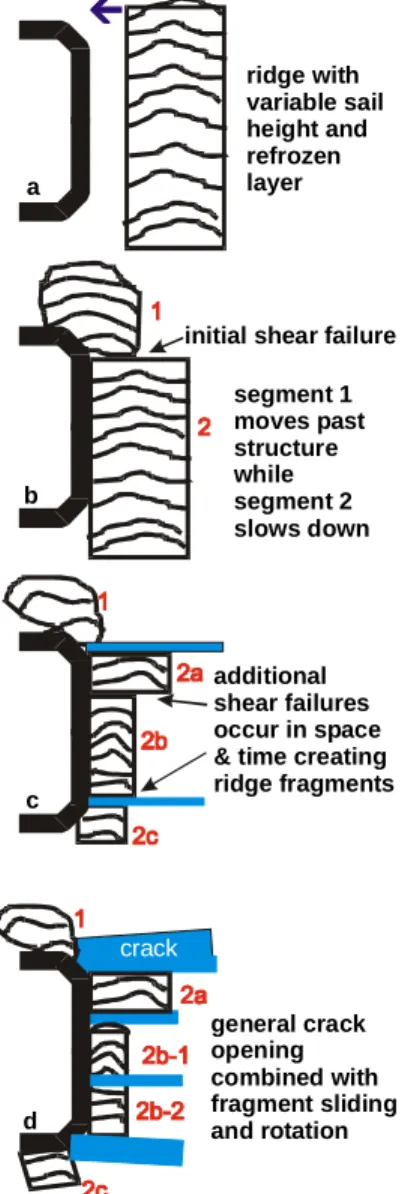
Some of the first-year ridges failed by “shear” (Figure 5). In this case, one or more large cracks formed perpendicular to the face of the caisson and propagated out from it (Figure 5a). Often, secondary cracks would form as the ridge motion continued and cleared around the structure (Figure 5b to Figure 5d). This type of failure was observed in moderate to large ridges that were moving at a relatively slow speed.
a
b
c
d
ridge with thick refrozen layer thinner level ice initial failure in level ice behind ridge thinner ice continues to fail and over-ride ridge general rubble-building clearing around structure
Figure 4 Sequence illustration during a failure of level ice behind the ridge. In some instances of ridge interaction, there were no apparent macroscopic failure immediately observable during the interaction. In this case, the ridge appeared to “stop” until the stress levels were high enough to induce a subsequent failure (see Figure 6). After appearing to stop for a time period (on the order of a minute), the ridges tended to fracture into several large pieces (Figure 6b and Figure 6c) which subsequently cleared around the structure (Figure 6d). This type of behaviour wasn’t that common and was limited to larger ridges that were frozen into a thicker parent ice sheet.
a b d c crack ridge with variable sail height and refrozen layer
initial shear failure segment 1 moves past structure while segment 2 slows down additional shear failures occur in space & time creating ridge fragments general crack opening combined with fragment sliding and rotation
Figure 5 Sequence illustration in plan view of the ridge failing with shear
failure behaviour.
The ridge failures discussed above relate to interaction with the long side of the structure. In some cases, there was direct interaction with the short side as shown in Figure 7. In this case, the ridge tended to fail when a crack formed in a near normal direction with respect to the caisson corner (Figure 7). This would split the ridge into 2 sections (Figure 7b) which would further fragment (Figure 7c) and eventually cleared around the structure (Figure 7d). These failures were similar to horizontal bending failures of the ridge.
Although the above discussion has separated the failure modes into distinct failure behaviours, in most cases the ridge failures were a combination of these categorized failure modes. Most first-year ridges were typified by a combination of shear and flexural behavior behind the ridge. a b c d a crack crack ridge moving against caisson, slows and “stops”
one or more cracks propagate and fragment ridge, but ridge appears to be stationary
cracks open with fragments sliding and rotating. Often ice failure occurs behind ridge or as spine failure
general clearing and crack opening
Figure 6 Plan view illustration of the stopping failure mechanism. 4.0 GLOBAL LOADS
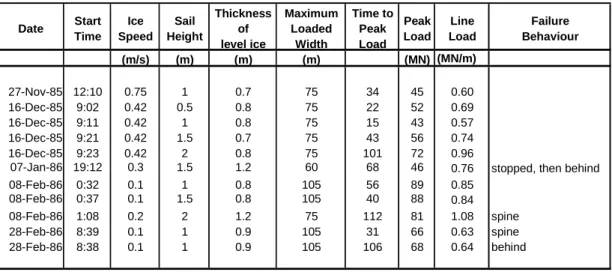
Eleven interactions of first-year ridges with the Molikpaq were analyzed to obtain the global load and the loading times to failure (Table 1). The sail heights for these
interactions ranged from 0.5 to 2 m and the global loads ranged from 45 to 90 MN. These loads are in the low-to-moderate range and are, in fact, lower than a number of crushing events with level ice (Wright and Timco 1994).
a
b
c
d
ridge moving obliquely against one of the short corners of the caisson
initial crack
ridge separates into 2 fragments
cracks propagate
ridge fragments rotate and slide along caisson
general crack opening
fragment rotation, sliding & clearing
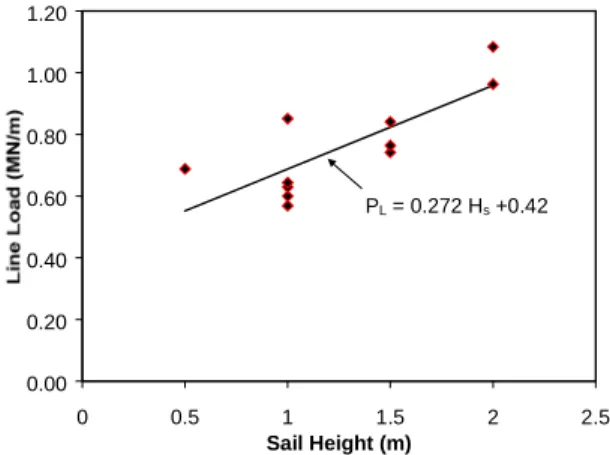
Figure 7 Sequence illustration of the failure along the corner of the structure. Figure 8 shows the global load versus the sail height for all Events. There is no clear trend in this case. Figure 9 shows the global load normalized by the width of the loading face as viewed from the videos (i.e. the Global Line-load PL) as a function of
sail height (Hs) of the ridge. There is a
general trend of increasing Line-load with larger sail heights. A regression curve to this data (for 0.5 ≤ Hs≤ 2) gives:
42
.
0
272
.
0
+
=
s LH
P
where PL is in MN and Hs in is m. 0 20 40 60 80 100 0 0.5 1 1.5 2 2.5 Sail Height (m)Figure 8 Global load on the Molikpaq versus sail height of the ridge.
One ridge Event was analyzed to investigate the load-time series behavior of the loads on the individual clusters of MEDOF panels. Figure 10 shows the global load on the Molikpaq as a function of time for the January 7, 1986 Events. In this case, a ridge with a sail height of 1.5 m approached from the east. During this Event, the load increased to 46 MN in a time span of approximately 70 seconds.
0.00 0.20 0.40 0.60 0.80 1.00 1.20 0 0.5 1 1.5 2 2.5 Sail Height (m) PL = 0.272 Hs +0.42
Figure 9 Line load versus sail height for interaction with first-year ridges.
Table 1 Summary of Loading Events of First-Year Ridges on the Molikpaq. Date Start Time Ice Speed Sail Height Thickness of level ice Maximum Loaded Width Time to Peak Load Peak Load Line Load Failure Behaviour (m/s) (m) (m) (m) (MN) (MN/m) 27-Nov-85 12:10 0.75 1 0.7 75 34 45 0.60 16-Dec-85 9:02 0.42 0.5 0.8 75 22 52 0.69 16-Dec-85 9:11 0.42 1 0.8 75 15 43 0.57 16-Dec-85 9:21 0.42 1.5 0.7 75 43 56 0.74 16-Dec-85 9:23 0.42 2 0.8 75 101 72 0.96
07-Jan-86 19:12 0.3 1.5 1.2 60 68 46 0.76 stopped, then behind 08-Feb-86 0:32 0.1 1 0.8 105 56 89 0.85
08-Feb-86 0:37 0.1 1.5 0.8 105 40 88 0.84 08-Feb-86 1:08 0.2 2 1.2 75 112 81 1.08 spine 28-Feb-86 8:39 0.1 1 0.9 105 31 66 0.63 spine 28-Feb-86 8:38 0.1 1 0.9 105 106 68 0.64 behind
During that time span, the ridge appeared to stop. After the ridge stopped, there was a dramatic reduction in the load as the ice sheet behind the ridge failed and began forming rubble. Figure 11 shows the response of each of the MEDOF panel groups on the East and Northeast side during this Event. Since the ridge approached from the east, there was no response on the north face, as expected. Figure 11 illustrates that the loading sequence was not uniform across the face of the Molikpaq during the January 7 Event. There was essentially no load on the NE group of MEDOF panels and a low load on the E3 Group (see Figure 2 for Group locations). However, there was a significant loading on E2 that occurred for about 70 seconds, with a later load peak on the E1 Group.
A more detailed examination of the spatial and temporal loading during ice interaction with the Molikpaq can be found in Frederking et al. (1999).
It should be mentioned that the first-year ridge loads measured on the Molikpaq are much lower than loads calculated using various analytical models. Recently Timco et al. (1999b) compared a number of load
algorithms and found that the predicted results varied over a wide range depending upon the assumptions made in the calculations. Further, even with reasonable assumptions, the predicted loads were considerably higher than these measured loads. 0 10 20 30 40 50 0 20 40 60 80 100 120 Time (seconds) Rubble building behind ridge January 7, 1986
first-year ridge Event
Figure 10 Global load versus time for the January 7, 1986 Event.
5.0 SUMMARY
A number of the ridge loading Events on the Molikpaq were reviewed and information was provided on both the failure behavior of the ridges and the global loads. In addition, for one Event, the details of the loading sequence are presented.
0 1 2 3 0 20 40 60 80 100 120 Time (seconds) E2 Group E1 Group E3 Group NE Group
Figure 11 MEDOF group loads on the Molikpaq during the January 7, 1986 ridge Event.
The analysis indicates that:
q First-year ridges can fail with a variety of failure behaviour, including spine failures, failure behind the ridge, shear failures and ridge stopping. Usually, the failure is a combination of shear and flexural failure of the level ice behind the ridge.
q The failure of the consolidated layer usually occurs through some type of bending, splitting or fracture process. q There is little evidence of large-scale
crushing behavior in the consolidated portion of the ridge.
q Global loads during ridge interaction results from primarily the failure and clearing of the refrozen layer, and are typically less than 100 MN. These loads are less than loads measured due to the crushing of level first-year ice on the Molikpaq.
q Published analytical models of ridge interactions considerably overpredict the load that a first-year ridge will exert on an offshore structure.
q An analysis of 11 ridges indicated that there was a general increase in the global line-load on the Molikpaq with larger ridges (i.e. increasing sail heights). A simple linear regression through the data indicated that the
Global Line-load (PL) increases with
increasing sail height (Hs) according to:
42
.
0
272
.
0
+
=
s LH
P
where PL is in MN and Hs in is m, and Hs varied from 0.5 to 2.0 m. Although
there is a good fit in this region, caution should be used for extrapolation to larger sail heights.
6.0 REFERENCES
Frederking, R., Timco, G.W. and Wright, B. 1999. Ice Pressure Distributions from First-year Ice Features Interacting with the Molikpaq in the Beaufort Sea. Proceedings
ISOPE’99, Vol II, pp 541-548, France.
Klohn-Crippen, 1998. DynaMAC: Molikpaq Ice Loading Experience.
Klohn-Crippen Report to the National Research Council of Canada.
Timco, G.W. 1996. NRC Centre of Ice-Structure Interaction: Archiving Beaufort Sea Data. Proceedings 13th IAHR Symposium on Ice, Vol. 1, pp 142-149, Beijing, China.
Timco, G.W., Johnston, M. and Frederking, R. 1999a. The NRC Ice Load Catalogue.
Proceedings POAC’99, Vol. 1, pp 444-453, Helsinki, Finland.
Timco, G.W., Frederking, R., Kamesaki, K., and Tada, H. 1999b. Comparison of Ice Load Calculation Algorithms for First-year Ridges. Proceedings of Rational Evaluation
of Ice Loads (REIF), pp 88-102, Mombetsu, Japan.
Wright, B.D. and Timco, G.W. 1994. A Review of Ice Forces and Failure Modes on the Molikpaq. Proceedings of the 12th IAHR Ice Symposium, IAHR'94, Vol. 2, pp 816-825, Trondheim, Norway.