HAL Id: hal-01404562
https://hal.archives-ouvertes.fr/hal-01404562
Submitted on 28 Nov 2016
HAL is a multi-disciplinary open access archive for the deposit and dissemination of sci-entific research documents, whether they are pub-lished or not. The documents may come from teaching and research institutions in France or abroad, or from public or private research centers.
L’archive ouverte pluridisciplinaire HAL, est destinée au dépôt et à la diffusion de documents scientifiques de niveau recherche, publiés ou non, émanant des établissements d’enseignement et de recherche français ou étrangers, des laboratoires publics ou privés.
Which stability for marketing channels ? The case of
short food supply chains in French agriculture
Magali Aubert, Geoffroy Enjolras
To cite this version:
Magali Aubert, Geoffroy Enjolras. Which stability for marketing channels ? The case of short food supply chains in French agriculture. 149. EAAE Seminar ‘Structural change in agri-food chains: new relations between farm sector, food industry and retail sector’, Institut National de Recherche Agronomique (INRA). UMR Structures et Marchés Agricoles, Ressources et Territoires (1302)., Oct 2016, Rennes, France. 21 p. �hal-01404562�
Which stability for marketing channels?
The case of short food supply chains in French agriculture
Magali AUBERT*, Geoffroy ENJOLRAS** * UMR 1110 MOISA, INRA-Montpellier Supagro 2 place Viala, 34060 Montpellier Cedex 2, France
aubert @ supagro.inra.fr ** FRE 3748 CERAG, IAE de Grenoble
Université Grenoble-Alpes
Domaine universitaire, B.P. 47, 38040 Grenoble Cedex 9, France geoffroy.enjolras @ iae-grenoble.fr
Paper prepared for presentation at the 149th EAAE Seminar ‘Structural change in agri-food chains: new relations between farm sector, food industry and retail
sector’
Rennes, France, October 27-28, 2016
Copyright 2016 by Magali Aubert and Geoffroy Enjolras. All rights reserved. Readers may make verbatim copies of this document for non-commercial purposes by any means, provided that this copyright notice appears on all such copies.
Abstract
Short food supply chains are now recognized marketing channels in French agriculture and are adopted widely by some sectors. This article is part of the growing body of studies on short food supply chains by proposing a study of the dynamics of the adoption of retail selling. The analysis relies on the FADN database for the years 2006 to 2012 and considers farms continuously operating over this period. Descriptive statistics are complemented by a two-step Heckman selection model that considers the duration of retail selling adoption, conditioned by the fact that farmers decide at first to adopt or not such marketing strategy. The analysis identifies that the adoption of such strategy is quite stable over the years. The econometric results confirm the link between the farmer's level of education, the use of workforce, phytosanitary products and the adoption of short marketing channels. They highlight the relationship between the reduction of workforce and phytosanitary products, the implementation of a sound financial situation, as well as sectorial peculiarities in the duration of adoption of retail selling. By contributing to a deeper understanding of short marketing modes, these results reflect the emergence of a specific model of farms centered on the use of short food supply chains.
Keywords: Retail selling, FADN, wine-growing, market gardening, fruit production, Heckman
JEL Codes: Q12, Q14, Q15
1. Introduction
Selling through short food supply chains is a marketing channel that arises the most interest at the present time (Goodman et al., 2012). This commercial channel is characterized by the presence of, at most, one intermediary in the supply chain between the producer and the consumer according to the definition of the French Ministry of Agriculture. Chevallier et al. (2015) have noticed a quick and regular increase in the publication of press articles on the subject between 2000 and 2014. This trend goes hand in hand with political interest growing in Europe on the topic of short food supply chains that is materialized through studies and synthesis reports (Kneafsey et al., 2013). The whole picture is characterized by a multidisciplinary approach that is made necessary by the complexity of this topic and the variety of perspectives for such an analysis (Lanciano and Saleilles, 2010).
In France, the Barnier Plan was engaged by the Ministry of Agriculture in June 2009 with the objective of developing direct sales. This effort was officially materialized in article 230-1 of Act No. 2010-874 of July 27, 2010, about the modernization of agriculture and fishing. This text provides actions for the "development of short food supply chains and the encouragement of geographical proximity between producers and consumers". Actions emerge the year after in the National Program for Food. More recently, Act No. 2014-1170 of October 13, 2014 about the future for agriculture refers to three advantages of short food supply chains: territorial anchoring of the production, proximity between producers and consumers and the quality of the production.
As a consequence of this interest in short marketing channels, France appears to be a leading country regarding direct selling in agriculture since in 2010, nearly 84,000 farmers (about one fifth), have sold all or part of their production using this channel (French Ministry of Agriculture, 2012a). However, some analyses using two French databases – the Agricultural Census (French Ministry of Agriculture, 2012b and 2012c; Capt and Wavresky, 2014; Aubert, 2015) and the Farm Accountancy Data Network (Aubert and Enjolras, 2013) – and field studies (Praly, 2010) reveal wide regional and sectorial disparities. Regarding crop productions, fruit production, market gardening, and wine growing are the most concerned by using short food supply chains, which reflects the diversity of the situations. On the one hand, wine growing and fruit production are perennial crops, while market gardening corresponds to annual crops. On the other hand, fruits and vegetables are perishable, while grapes are preferentially converted to wine, which is a storable product.
These various studies highlight the permanence of farms' profiles which sell all or part of their production using retail short marketing channels. However, even if some of them consider the farm’s trajectory mainly in terms of individual dynamics, they are not interested in the specific dynamics of marketing strategies. In particular, one question remains to explore: the stability of the adoption of retail selling as a marketing channel. Indeed, the analysis of the population of farmers shows that they use short food supply chains in addition to standard commercial channels rather than in terms of substitution (Le Velly and Dubuisson-Quellier, 2008). But is this adoption permanent, or does it vary according to the circumstances?
To determine the course of farms regarding distribution channels, we develop an original methodology that follows farmers over several years and determines their course. This method thus allows to define typologies of behaviours. Econometric models help identify the determinants leading to stability (or instability) in the adoption of short marketing channels.
Our work relies on databases from the Farm Accountancy Data Network (FADN) for years 2006 to 2012. This survey provides an annual representative overview of French medium and large farms, particularly in terms of productive orientation. This database is indeed the most complete and the most appropriate to take into account simultaneously the structural and the financial aspects of farms. Information is processed on the basis of a differentiation of farmers whether they adopt, or not, retail selling, and whatever the proportion of sales this marketing channel concerns.
To take into account the fact that selling through short food supply chains corresponds to a more or less stable or perennial business strategy, it is appropriate to consider not only the duration of this activity but also to condition its adoption to the fact that farms that sell at the retail scale have individual, structural, or even financial characteristics different from those that have never adopted this marketing. The corresponding modeling takes the form of a two-step Heckman model. The first two-step is to identify the characteristics differentiating farmers according to their marketing channel in order to correctly appreciate, in a second step, the determinants of the duration of the implementation of this business strategy.
This article is organized as follows. In the first part, we present the theoretical framework of our study. In the second part, we detail the empirical strategy used in this article. In the third part, we present the results of our study. In the fourth part, we conclude by presenting some perspectives related to this work.
2. Theoretical framework
The adoption of short food supply chains implies a change of paradigm related to the implementation of a new way of marketing (Illbery and Maye, 2005; Goodman et al, 2012). For the farmer and his farm, new structural needs (capacity to store and sell by himself), managerial (selling skills) but also economic and financial needs appear. The literature highlights the determinants of adoption of short food supply chains (McNally, 2001; Capt and Wavresky, 2014). From this state of the art, it is possible to make some assumptions about factors that lead to a perennial or a permanent adoption of this marketing channel.
The very structure of the farm predisposes some of them to sell using short marketing channels, as shown by land surveys (Ministry of Agriculture, 2012b and 2012c). Moreover, besides the choice of a specialization, which we mentioned in the introduction, the permanence of this specialization in time is a factor for stability in the adoption of retail selling. Indeed, proximity with the consumer is a key factor of success of the sale using short food supply chains (Brown and Miller, 2008; Daskalopoulou and Petrou, 2002; Langhade, 2010). Another important parameter is the physical size of the farm that promotes both the diversification of production (Timmons and Verhaegen, 2010) and of the marketing channels (Aubert and Perrier-Cornet, 2012) on a long period.
Material and human resources are important drivers for the adoption of short food supply chains (Aubert, 2013; Aubert and Enjolras, 2013; Bowler et al., 1996; Gasson et al., 1988; McNally, 2001). A key factor for success of retailing channels is to employ a workforce dedicated to this activity and which possesses specific marketing skills (Dufour and Lanciano, 2012; Evans et al., 1993). For this reason, Broderick et al. (2011) also highlight the importance of family labor in short food supply chains. The presence of (waged) workforce is therefore likely to contribute to a sustainable adoption of retail selling (Chiffoleau and Gauche, 2013).
At the economic level, the size of the farm is a major and widely discussed criterion explaining the choice of retail selling. Size is measured by considering either the area cultivated, the turnover (total value of sales), or standard output (potential of production). If several studies show that small farms are the most likely to adopt retail selling for reasons of economies of scale (Broderick et al., 2011; Gale, 1997), larger farms are better able to diversify their marketing channels (Aubert and Perrier-Cornet, 2009; Aubert and Enjolras, 2013). The same reasoning applies for the level of profitability: a low profitability induces a farmer to adopt retail selling in order to restore the financial situation of his business (Park et al., 2014). Symmetrically, a farmer with an important profit is also encouraged to adopt retail selling in order to strengthen his situation (Aubert and Enjolras, 2013). Finally, European subsidies linked to the CAP strengthen farmers' revenues and limit their risk (Enjolras et al., 2012), which is conducive to retail selling.
From a financial point of view, changes needed to adopt short food supply chains are characterized primarily by expenditures in the short term, which are supposed to be quickly amortized thanks to higher selling prices and better value added (Verhaegen and Van Huylenbroeck, 2001). This point underlines the need for the company to have sufficient cash in order to optimize the adoption of short marketing channels. Large-scale expenditures may be financed using equity or by increasing debt. In this configuration, the farmer is incited to adopt retail selling for several years. Conversely, farms facing some financial difficulties, i.e. primarily linked to cash and debt issues, are also incited to practice retail selling. This forced
conversion to alternative marketing channels mainly concerns fruit production and, to a lesser extent, market gardening and wine growing (Aubert and Enjolras, 2015). Without being able spend more money on his farm, the farmer is expecting to recover the value added granted by short food supply chains. A possible opportunism may result in an intermittent adoption of retail selling.
The environmental dimension of short food supply chains is part of incentives that lead farmers to adopt this kind of marketing channel (Capt et Wavresky, 2014). In addition to the proximity to consumers which translates into reduced transportation, the quality of the production needs is emphasized (French Ministry of Agriculture, 2012d). More specifically, there is a strong link between the adoption of retail selling and the certification of production with the organic farming label (Aubert and Enjolras, 2015). Finally, on a financial level, farmers demonstrating the quality of their production gain a surplus of profit (Uematsu and Mishra, 2012). Therefore, production using few phytosanitary products is likely to encourage a certain continuity in the adoption of retail selling.
3. Empirical strategy
Studying the dynamics of short food supply chains requires to use data with enough temporal depth in order to observe the precise evolution of marketing strategies implemented by farmers.
3.1. Database and variables
The Farm Accountancy Data Network (FADN) is an annual survey conducted by the Department of Statistics and Prospective (SSP), which identifies the individual, structural and financial characteristics of a panel of farms representative of the whole population of French medium and large farms. Hence, we consider in this database farms whose Standard Output (SO) is greater that 25,000 euros. This panel is stratified on the basis of the Economic and Technical Orientation of farms (ETO), physical size of the farm and location. The FADN sampling method also consists in a renewal of farms at a rate of about 10% per year. Consequently, the number of farms it is possible to follow decreases as the period of the review increases.
The data allows to identify farms that sell, all or part of their production, at the retail scale over the period 2006-2012. This period provides sufficient temporal depth to analyze the dynamics of marketing channels of a relevant population sample followed "continuously". The dynamics of 1,770 (extrapolated) farms can therefore be studied.
It is important to notice that a bias may occur if the dynamics of farms, considered through their sustainability, is linked to their marketing strategy. A test of independence confirms there is no relationship between these two dimensions. Hence, results can be extrapolated to the whole population of French medium and large farms (Table 1).
3.2. Predominance of retail selling for some productions
Selling using short food supply chains represents an alternative that some specialized farms are more willing to adopt than others. Regardless of the period considered, an over-representation of farms specializing in "gardening", "fruit" and "quality wine" can be observed (Table 2). In addition, the relative share of farms that sell at the retail scale remains stable over time for the same specializations, with an average adoption standing respectively at 52.8%, 53.7% and 30.3%.
Table 2. Share of farms that sell at the retail scale by ETO
Focusing this analysis on these 3 specializations allows not only to determine to what extent the determinants of selling using short marketing channels are different among specializations, but also and above all to put in perspective productions with very specific intrinsic characteristics.
3.3. Measure of the stability of retail selling
Selling using short food supply chains appears as a stable marketing mode, for considered specializations, since its adoption remains substantially the same from one year to the next. However, this stability is to be put into perspective insofar as it is relevant only at the aggregate level and not at the individual level.
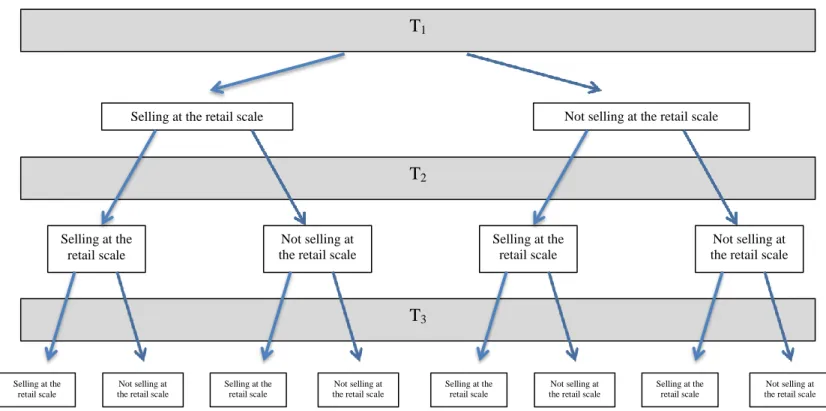
In order to consider to what extent the individual dynamics translate distinct behaviors from the overall trend, one should describe the set of possible states. To simplify the presentation, only 3 campaigns are included in Figure 1: they are rated T1, T2 and T3. Each year, a given
farmer may decide to sell, or not, all or part of his production through short food supply chains. In T1, there are 2 possible states. In T2, for each of 2 states observed in T1, 2 states are
also possible, which leads to 4 potential trajectories.
Thus, in our example with 3 campaigns, 8 States are possible (Figure 1). In our analysis that takes into account 7 campaigns, 128 possible states are thus counted. Among those 128 possible states, only 82 have been observed, which characterizes the complexity and diversity of paths observed in practice.
Figure 1. Description of the observed states over 3 years
Among farms observed continuously over the study period, we observe a stable behavior since nearly 34% of them have never sold at the retail scale and that, among those who adopted retail selling, 65% have done so over the 7 years (Table 3). In addition, there are clear sectorial differences.
Table 3. Stability of retail selling over the period 2006-2012
A more detailed study of the evolution of the marketing channels adopted by farmers therefore shows that 25% of the total population of farmers sell at the retail scale in an irregular manner. For instance, the cases mentioned in Table 4 were particularly observed.
The apparent stability of farms that sell using short food supply chains thus conceals a certain heterogeneity of behaviors that one cannot neglect.
3.4. Econometric modeling
In order to understand this dynamics, it appears essential to measure among the farmers who have sold at least once over the period at the retail scale, the duration of this marketing strategy. The analysis is implemented in two stages: the first one considers the adoption or not of retail selling and the second one considers, for farmers who have sold at least once using this marketing channel, the stability of its adoption. Since this stability does not necessarily correspond to a successive number of years during which farms sell through retail markets, the second step of the model implemented is a linear model and not a duration model.
Insofar as the considered modeling lead to understand the determinants of the duration of the adoption of retail selling, farms followed on the whole study period constitute the population of reference in order to not condition this duration to the number of years in which farms have been surveyed.
The modeling is based on a two-stage Heckman model (1976, 1979) which takes into account the fact that the duration of the adoption of retail selling is conditioned by the fact to have sold at least once through this distribution channel. The model incorporates a regression equation [2], conditioned by a selection equation [1]. Cumulative campaigns for which the farm sold at the retail scale have a meaning only for farms that have sold at least once using this marketing channel.
The regression equation can be formalized as follows:
y1j = xj β + ε1j [1]
Where:
- y1j is the cumulative duration of campaigns for which the farmer has sold at the retail scale.
- xj are explanatory factors.
- β are coefficients associated with each of these factors. - ε1j are error terms.
The selection equation is formalized in the following way:
y2i = wj γ + ε2i [2]
and if y2i* > 0, then y2i = 1, 0 otherwise
Where:
- y2i is the likelihood that the farmer sold at least once at the retail scale. This probability is
conditioned by an unobservable quantitative variable which is denoted y2i*.
- wj are the determinants of this unobserved variable.
- γ are coefficients associated with each of these factors. - ε2i are error terms.
Insofar as the implementation of the selection equation determines the regression equation, we have assumed that Corr (ε2i, ε2j) ≠ 0.
All these equations can be summarized by Figure 2.
Figure 2. Representation of the considered model
4. Results
Insofar as the analysis breaks down into two steps according to the adoption of retail selling and to the duration of this adoption, results will be presented depending on whether they refer to the first or the second step. Table 5 incorporates the definition of each of the variables included in our analysis.
Table 5. List of variables used in the analysis
4.1. Descriptive statistics
4.1.1. Characterization of farms that have sold at least once at the retail scale
Selling through short marketing channels leads to a different implementation according to the farm specialization. Thus, the analysis must subsequently take into account this difference and analyze the characteristics of farms that have already sold at the retail scale conditionally to their specialization (Tables 6a and 6b).
Tables 6a/6a. Characteristics of farms according to whether they sold at the retail scale at least once over the period 2006-2012
Individual and structural characteristics are highlighted by the literature as being determinant of retail selling. We confirm this point in finding similar results, regardless of the specialization. Farmers who sell at the retail scale have a high level of education, be it general or agricultural. It also appears that larger farms do not sell more at the retail than smaller ones.
If some factors seem to have the same impact on selling using short supply chains, some others exhibit distinct effects. This is particularly the case of workforce employed on the farm. While farms specializing in wine growing, which sell at the retail scale, use more labor in 2006, our reference year, than those that do not sell at the retail scale, we notice the opposite effect for farms specializing in market gardening. Farms specializing in wine-growing differ from those specializing in market gardening because while the first ones need to transform their production to sell it, while it is not the case for the second ones. This difference may be a key parameters for understanding the different relationships observed. Similarly, farms specializing in market gardening are more likely to sell at the retail scale if they have increased their workforce over the period 2006-2012, while the relationship is opposed for farms specializing in fruit production. The effect of the specialization is therefore emphasized, which stresses the need, in the general case, to employ more workforce when selling at the retail scale.
Descriptive analyses seem to point out that for farms specializing in high value-added productions, namely market gardening and wine growing, the more the level of the Standard Output (SO) is low and the more these farms are incited to adopt retail selling. In addition, we find that farms specializing in arboriculture who sell at the retail scale seem to correspond to those whose level of SO has increased the most over the period 2006-2012, regardless of the level observed in 2006. This result seems to reflect a favorable evolution of the productive potential of these farms.
At the financial level, descriptive analyses suggest that an important indebtment level in 2006 for farms specializing in permanent crops translates into a greater likelihood to sell at the retail scale, although this choice appears conditioned by the evolution of the debt-to-equity ratio. A large indebtment level may result from structural investments that give the farm the ability to sell at retail. It can also be a motivation to sell using short marketing channels in order to allow the payback of the debt. The two other financial indicators considered, the cash level and the net profit, seem little related to the continuity of retail selling.
Selling through short marketing channels is associated in the literature to a production of better quality. This relationship appears validated for farms specializing in viticulture insofar as these farms seem more incited to adopt this marketing channel using fewer pesticides. In summary, the fact that farmers have sold, or not, at least once at the retail scale seems to depend mainly on the individual characteristics of these producers, as well as on some structural and financial characteristics of their farm. These factors however have different implications depending on the considered productive orientation, which confirms the interest to differentiate our analysis according to the main productions implemented.
4.1.2 Characterization of farms regarding the stability of their adoption of retail selling Understanding the duration of the implementation of short food supply chains only makes sense for farmers who had sold at least once using this marketing channel. In fact, the descriptive analysis that follows focuses only on farms that have sold at least once all or part of their production to the detail on the period (Tables 7a and 7b).
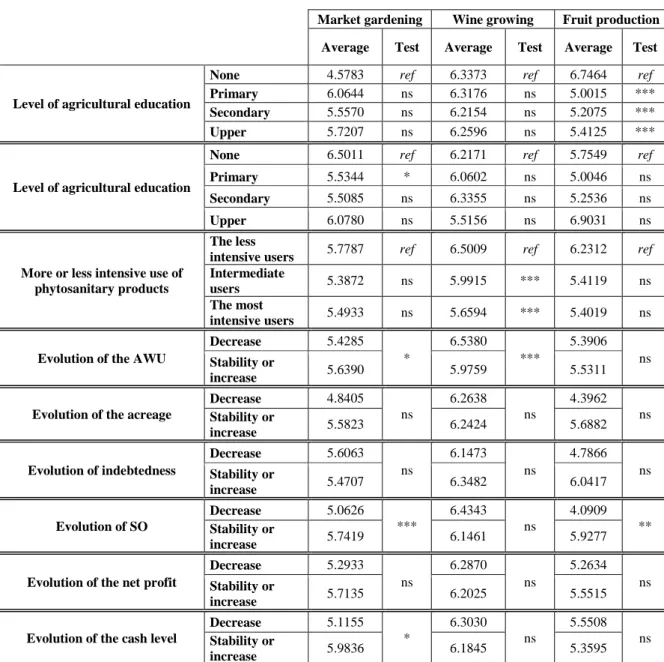
Table 7a. Number of years in which the farmer sold at the retail scale with regards to the farm characteristics
Table 7b. Correlation between the number of years of retail selling and the main farm characteristics
For farms that have sold at least once all or part of their production using short marketing channels, over the period 2006-2012, it seems that the level of education conditions this duration. The most educated farmers correspond to those who have implemented on the longer period retail selling. However, this relationship seems only validated for farms specializing in market gardening and fruit production. For farms specializing in wine growing, the relationship is not as significant.
The importance of workforce is contrasted. Farms specializing in arboriculture sell at the retail scale for a longer period when they employ little workforce at the beginning of our period of observation, in 2006, while the converse relationship is observed for farms
which have increased their workforce over the period 2006-2012 have more sold at the retail scale if they are specializing in market gardening, but less if they are specializing in wine growing. These results may reflect the existence of a target level of workforce ensuring a continuity of retail selling.
Statistical results seem to emphasize the independence of the continuity of retail selling with the physical size of farms (acreage) or even the indebtment level. However, the duration appears linked to the level of SO for farms specializing in fruits and market gardening. Within this framework, an initial level of low SO translates into greater involvement in this marketing channel, in the same way that it is also enhanced when these farms have experienced an increase in their level of SO over the period 2006-2012. Farms specializing in viticulture stand out insofar as the level of SO appears as independent of the duration of implementation of retail selling. The possibility to store wine production probably explains this low sensitivity.
Finally, the environmental quality of the production can be measured through the use of phytosanitary products. Even if the trend is significant only for wine growing, farmers whose productive practices are the most respectful of the environment correspond to those for which the duration of implementation of retail selling is the most important. Using fewer pesticides is a guarantee of sustainability of the adoption short marketing channels for farmers who get committed in this approach.
4.2. Econometric modeling
4.2.1 Characteristics of farms and farmers that have sold at least once at retail
Farmers who sold their production at the retail scale at least once over the period considered have characteristics that differ clearly from other farms (Table 8).
Table 8. Econometric modeling
The selection equation which highlights significant differences along farmers depending on the marketing channel confirms the results of descriptive statistics by showing that the level of education is a common determinant, regardless the productive orientation. Specifically, the more educated farmers are more inclined to adopt, at least once, retail selling.
This feature is especially important for farms specializing in market gardening because it is the only significant differentiation regarding retail selling. This uniqueness may reflect the fact that these farmers are those for which short food supply chains are the most common. Indeed, nearly 3 farmers on 4 committed in this productive orientation have sold at least once through retail selling over the period considered, whereas the ratio is 1 to 3 in wine-growing and 1 to 2 in fruit production (Table 3). Therefore, for these farms, it appears more difficult to discriminate practices of retail selling depending on the individual, structural and financial farm parameters.
Farms specializing in perennial crops, i.e. fruit and wine growing production, are selling using retail selling according to their level of Standard Output (SO). Specifically, while wine growing farms adopt retail selling if their SO is low, farms specializing in arboriculture do so when their SO increases over time. The cash and indebtment levels appear to have no influence on the choice of the marketing channel.
Farms specializing in wine growing are more incited to sell using short marketing channels when they use more employment on their farm. This corroborates the fact that selling through short food supply chain relies on a need for labor more important to deal with an increased commercial activity which is different from a pure productive activity. Furthermore, farms are more likely to sell using short food supply chains if they are among the less intensive users in phytosanitary products. Retail selling is therefore synonymous with selling of better quality products or at least with selling of more environmentally friendly products for the environment and customers.
4.2.2 The determinants of the duration of retail selling practices
For farmers who have sold at least once at the retail scale, the duration of the implementation of this marketing channel differs depending on the characteristics of these farmers and the structural and financial characteristics of their farm.
Regardless of the productive orientation, there are common factors to a repeated adoption of retail selling. The results indicate that the main determinants are defined in terms of dynamics and thus of path of farms. The characteristics of parameters observed in 2006 have very little effect on the durability of retail selling. Thus, farms that have decreased their workforce use are those whose duration in selling at the retail scale is longer, regardless of the initial importance of employment observed in 2006. This result can be interpreted from a dynamic perspective: retail selling requires initially the progressive acquisition of business skills by the staff in charge of production, or even by the recruitment of specialized staff. And then, gradually, the interaction between productive and commercial activities, in terms of organization and workforce, is optimized, which translates into a lesser need for labor.
Farms specializing in high value-added crops, market gardening and wine growing have in common to consider retail selling as a perennial marketing channel as soon as they are committed in a production less intensive in phytosanitary products. For these farms, retail selling is synonymous with selling more environmentally friendly products. The results confirm that these two long-term - productive and commercial - strategies are jointly defined by the producer. In the same way, for these farms, the longer they insure their crop yields and the longer they sell at the retail scale. Crop insurance provides a guarantee on yields that protects the farm against losses in the case of natural disasters, thus covering a significant proportion of its risk (Enjolras and Sentis, 2011). It can offset the effects of a reduction in the observed use of phytosanitary products.
For farms specializing in permanent crops, arboriculture and viticulture, the common point is the importance of cash. Farmers who have noticed a decrease in their cash level are those who have adopted more permanently retail selling. For farms specializing in arboriculture, the initial cash level also determines the duration of retail selling, insofar as it is more so high the duration of retail selling is conversely linked to the observed cash level in 2006. In the wine growing sector, the duration of retail selling is linked not only to a decrease in cash flows, but also to a decrease in the net profit. These results confirm the existence of a link between the adoption of retail selling and the presence of a precarious financial situation. This point is reinforced by the link between debt reduction and duration of retail selling. Farms whose indebtment level decreased over the period 2006-2012 are those whose commercial activity with retail selling is the longest, which proves that this form of marketing channel can lead
On a structural level, farms specializing in arboriculture adopt retail selling for a longer period when their cultivated area increased over the period 2006-2012. The development of useable acreage of these farms thus leads to prolong their marketing channels.
5. Conclusion
The objective of this article is to understand the stability of marketing strategies implemented by the farms adopting retail selling. This issue comes from two seemingly contradictory observations. On the one hand, retail selling requires a certain number of skills as well as technical and commercial capacities while requesting a change in practices. On the other hand, despite these necessary changes, a third of farmers having adopted retail selling in 2006 do not use it systematically as a marketing channel every year, but rather irregularly.
Starting from an analysis of the existing literature on the adoption of short marketing channels and retail selling, we have implemented an empirical strategy to study the duration in the implementation of retail selling. To do so, we relied on the FADN database and a sample of farms continuously surveyed from 2006 to 2012 in market gardening, fruit production and wine growing. The information gathered allow to determine the path of farms over several years, by considering the possible adoption of retail selling and the duration of this adoption. In addition to descriptive statistics, we have implemented a Heckman model which considers both: a selection model explaining the choice of retail selling and a model determining the factors that influence the farmer to perpetuate this marketing channel, conditioned by the selection model.
Results related to the determinants of retail selling confirm the trends observed in the literature. Firstly, the adoption of short food supply chains goes hand in hand with a higher level of education of the farmer, a more intensive use of workforce and a reduced use of phytosanitary products. Secondly, these determinant factors get refined when implementation of retail selling is lasting. If farmers involved over several years in these marketing channels reduce over time their use of phytosanitary products, they also decrease their use of workforce. In doing so, it seems they manage to improve their financial situation, which was not necessarily healthy initially.
These results thus reflect the emergence of a specific model of farms centered on the use of short marketing channels which manage to ensure sustainable management of their risk. The entrepreneurial posture of farmers is valued when it comes to develop new marketing channels (Langhade, 2012). This information could serve as a guideline for public policies aimed at encouraging the development of short marketing channels in France and Europe. Finally, extensions of this study could concern sectors for which retail selling is growing fast, such as meat or fish production.
Acknowledgments: This article has benefited from the financial support of the French National Research Agency, within the project ANR-11-ALID-0006ILLIAD.
References
Aubert, M. and Enjolras, G. (2013). Déterminants de la commercialisation en circuits courts : quels exploitants, sur quelles exploitations? Paper presented at the 7èmes Journées de Recherches en Sciences Sociales SFER-INRA, Angers, 12-13 December 2013.
Aubert, M. and Enjolras, G. (2015). Are short food supply chains a solution for farms facing financial difficulties? Paper presented at the 29th International Conference of Agricultural Economists, Milan, 8-14 August 2015.
Aubert, M. and Enjolras, G. (2015). Do short food supply chains go hand in hand with environment-friendly practices? Paper presented at the 29th International Conference of Agricultural Economists, Milan, 8-14 August 2015.
Aubert, M. and Perrier-Cornet, P. (2009). Is there a future for small farms in developed countries? Evidence from the French case. Agricultural Economics 40: 773-787.
Aubert, M. and Perrier-Cornet, P. (2012). La diversification des activités dans les exploitations viticoles françaises? Economies & Sociétés 10-11: 1969-1996.
Benezech, D. (2012). Des circuits courts pour un agriculteur entrepreneur ? In: Boutillier, S., Djellal, F., Gallouj, F., Laperche, B. and Uzinidis, D. (eds), Innovation verte. De la théorie aux bonnes pratiques. Brussels: P.I.E., 253-270.
Bowler, I., Clark, G., Corckett, A., Ilbery, B. and Shaw A. (1996). The development of alternative farm enterprises: a study of family labour farms in the northern Pennines of England. Journal of Rural Studies 12: 285-295.
Broderick, S., Wright, V. and Kristiansen, P. (2011). Cross-Case Analysis of Producer-Driven Marketing Channels in Australia. British Food Journal 113: 1217-1228.
Brown, C. and Miller, S. (2008). The impacts of local markets: A review of research on farmers’ markets and community supported agriculture (CSA). American Journal of Agricultural Economics 90: 1296-1302.
Capt, D. and Wavresky, P. (2014). Determinants of direct-to-consumer sales on French farms. Revue d'Etudes en Agriculture et Environnement 95: 351-377.
Chevallier, M., Dellier, J. and Richard, F. (2015). Les vertus discutables des circuits de proximité au regard de la précarité en milieu rural: Le cas du Limousin. Pour 225: 237-243.
Chiffoleau, Y. and Gauche, A. (2013). Diversité des stratégies et des performances dans les circuits courts alimentaires: une analyse croisée. Paper presented at the 5th Congress of the French Association of Sociology, Nantes, 2-5 September 2013.
Dufour, A. and Lanciano, É. (2012). Les circuits courts de commercialisation : un retour de l'acteur paysan ? Revue Française de Socio-Économie 1: 153-169.
Enjolras, G. and Sentis, P. (2011). Crop insurance policies and purchases in France. Agricultural Economics 42: 475-486.
Enjolras, G., Capitanio, F., Aubert, M. and Adinolfi, F. (2014). Direct payments, crop insurance and the volatility of farm income: some evidence in France and in Italy. New Medit 13: 31-40.
Evans, N.J. and Libery, B.W. (1993). The pluriactivity, part time farming and farm diversification debate. Environment and Planning A 25: 945-959.
Daskalopoulou, I. and Petrou, A. (2002). Utilizing a farm typology to identify potential adopters of alternative farming activities in Greek agriculture. Journal of rural studies 18: 95-103.
French Ministry of Agriculture (2012a). Un producteur sur cinq vend en circuit court. Agreste Primeur 275.
French Ministry of Agriculture (2012b). Les circuits courts surtout présents en viticulture. Agreste Franche Comté 171.
French Ministry of Agriculture (2012c). Légumes: la vente en circuit court peut encore se developer. Agreste Limousin 77.
French Ministry of Agriculture (2012d). Les démarches de valorisation des produits agricoles: Diversification, circuits courts et productions sous signe de qualité. Agreste Limousin 112.
Gale, F. (1997), Direct farm marketing as a rural development tool. Rural Development Perspectives 1.
Goodman, D.E., DuPuis, E.M. and Goodman, M.K. (2012). Alternative food networks: knowledge, practice and politics. Abington: Routledge.
Gasson, R., Crow, G., Errington, A., Hutson, J., Marsden, T. and Winter, D.M. (1988). The farm as a family business: A review. Journal of Agricultural Economics 39: 1-41.
Heckman, J. (1976). The common structure of statistical models of truncation, sample selection and limited dependent variables and a simple estimator for such models. Annals of Economic and Social Measurement 5: 475-492.
Heckman, J. (1979). Sample selection bias as a specification error. Econometrica 47: 153-161. Ilbery, B. and Maye, D. (2005). Alternative (shorter) food supply chains and specialist livestock products on the Scottish-English borders. Environment and Planning A 37: 823-844. Kneafsey, M., Venn, L., Schmutz, U., Balázs, B., Trenchard, L., Eyden-Wood, T., Bos, E., Sutton, G. and Blackett, M. (2013). Short Food Supply Chains and Local Food Systems in the EU. A State of Play of their Socio-Economic Characteristics. JRC Report 25911.
Lanciano, E. and Saleilles, S. (2010). Le développement des circuits courts alimentaires : un nouveau souffle entrepreneurial dans l’agriculture ? Paper presented at the Congrès international francophone sur l’entrepreneuriat et la PME, Bordeaux, 27 Septembre 2010. Langhade, E. (2010). Circuits courts: une relation de proximité. Dossier de la chambre d’agriculture 991.
Le Velly, R. and Dubuisson-Quellier S. (2008). Les circuits courts entre alternative et hybridation. In Maréchal, G. (ed.), Les circuits courts alimentaires. Bien manger dans les territoires, Paris: Educagri, 105-112.
McNally, S. (2001). Farm diversification in England and Wales: What can we learn from the farm business survey? Journal of Rural Studies 17: 247- 257.
Park, T., Mishra, A.K. and Wozniak, S.J. (2014). Do farm operators benefit from direct to consumer marketing strategies? Agricultural Economics 45: 213-224.
Praly, C., Chazoule, C., Delfosse, C., Bon, N. and Cornée, M. (2009). La notion de "proximité" pour analyser les circuits courts. Paper presented at the 46ème Colloque de l'ASRDLF, Clermont-Ferrand, 6-8 July 2009.
Timmons, D. and Wang Q. (2010). Direct Food Sales in the United States: Evidence from State and County-Level Data. Journal of Sustainable Agriculture 34: 229-240.
Uematsu, H. and Mishra, A.K. (2012). Organic farmers or conventional farmers: where's the money? Ecological Economics 78: 55–62.
Verhaegen, I. and Van Huylenbroek, G. (2001). Costs and Benefits for Farmers Participating in Innovative Marketing Channels for Quality Food Products. Journal of Rural Studies 17: 443-456.
Table 1. Relation between marketing channels and the considered population of farms
Farms followed continuously All medium and large farms
Test for equality of
means Share of farms that sell at
the retail scale 18.56% 18.99% ***
Key: *, ** and *** denote a significance of tests to the respective thresholds of 10%, 5% and 1%.
Table 2. Share of farms that sell at the retail scale by ETO
2006 2007 2008 2009 2010 2011 2012 2006-2012 Cereals 6.3% 7.0% 5.7% 5.4% 6.2% 6.2% 6.5% 6.1% Market gardening 52.4% 56.3% 52.0% 52.2% 53.9% 54.3% 55.1% 53.7% Quality wine-growing 52.5% 53.6% 54.1% 51.9% 52.4% 51.9% 53.9% 52.8% Other wine-growing 19.7% 21.1% 16.3% 13.8% 9.5% 12.9% 8.1% 16.4% Fruit production 26.7% 30.7% 29.8% 30.4% 31.3% 30.1% 33.8% 30.3% Cattle 10.3% 10.0% 8.7% 8.5% 9.2% 10.1% 10.3% 9.0% Other productions 14.9% 18.1% 15.4% 16.6% 15.1% 16.3% 18.4% 16.3%
Table 3. Stability of retail selling over the period 2006-2012
Market gardening Wine-growing Fruit production All farms
Nb Distribution for all farms
Distribution for retailing
farms
Nb Distribution for all farms
Distribution for retailing
farms
Nb Distribution for all farms
Distribution for retailing
farms
Nb Distribution for all farms
Distribution for retailing farms 0 1 850 27.43% / 5 698 32.46% / 1 857 54.05% / 9 405 33.91% / 1 233 3.46% 4.77% 468 2.66% 3.94% 124 3.60% 7.83% 824 2.97% 4.50% 2 256 3.79% 5.22% 110 0.62% 0.92% 51 1.50% 3.26% 417 1.50% 2.27% 3 583 8.64% 11.90% 380 2.16% 3.20% 114 3.31% 7.20% 1 076 3.88% 5.87% 4 207 3.07% 4.24% 456 2.60% 3.85% 128 3.71% 8.08% 791 2.85% 4.32% 5 402 5.97% 8.22% 876 4.99% 7.39% 211 6.14% 13.37% 1 490 5.37% 8.13% 6 690 10.23% 14.09% 942 5.37% 7.95% 175 5.09% 11.09% 1 807 6.52% 9.86% 7 2 523 37.41% 51.56% 8 626 49.13% 72.74% 777 22.60% 49.18% 11 925 43.00% 65.06% Total 6 743 100% 100% 17 556 100% 100% 3 437 100% 100% 27 736 100% 100%
Table 4. Selection of some of the 82 observed states Retail selling
2006 2007 2008 2009 2010 2011 2012
0 1 0 0 1 0 1 1 1 0 0 0 0 1 1 0 1 0 1 0 1
Table 5. List of variables used in the analysis
Variable Unit Definition
Variables of interest
Retail selling Yes/No Adoption of retail selling for at least one year over the period 2006-2012
Duration of retail selling Year Number of years during which the farmer sold all or part of his production at the retail scale
Variables considered in 2006
ETO Class Economic and Technical Orientation of farms Acreage Hectare Cultivated area of the farm (in classes) AWU - Annual Work Unit
General education
None Yes/No No general education Primary Yes/No Primary general education Secondary Yes/No Secondary general education Upper Yes/No Upper general education
Agricultural education
None Yes/No No agricultural education Primary Yes/No Primary agricultural education Secondary Yes/No Secondary agricultural education Upper Yes/No Upper agricultural education SO € Standard Output at year-end Indebtment level % Debt-to-equity ratio at year-end Net profit € Net profit (or loss) at year-end Cash level € Cash level at year-end
Variables considered in dynamic terms over the period 2006-2012
Crop insurance Year Number of years during which the farmer has subscribed to a crop insurance policy.
Phytosanitary products Class
Typology of farmers according to whether they have (or not) a stable behavior over the period 2006-2012. Farmers are differentiated by considering those for which the use of phytosanitary products is the most intensive (more than 10% of total sales) from those whose use is the least intensive (less than 5% of total sales).
Acreage Class Evolution of cultivated area (increase or stabilization vs decrease) AWU Class Evolution of AWU (increase or stabilization vs decrease) SO Class Evolution of the SO (increase or stabilization vs decrease)
Indebtedness Class Evolution of indebtedness (increase or stabilization vs decrease)
Net profit Class Evolution of the net profit (increase or stabilization vs decrease)
Table 6a. Characteristics of farms according to whether they sold at the retail scale at least once over the period 2006-2012
Key: *, ** and *** denote a relationship between the variables to the respective thresholds of 10%, 5% or 1% - ns indicates that there is no link.
Table 6b. Characteristics of farms according to whether they sold at the retail scale at least once over the period 2006-2012
Market gardening Viticulture Arboriculture
Average Test Average Average Test Test
AWU in 2006 Retail
selling
Never 6.1363
* 2.0307 *** 5.5398 ns
At least one year 4.015 3.8218 5.2896
Cash flow in 2006 selling Retail Never 26226.35 ns 6932.95 ns 32532.40 *
At least one year 15826.86 5447.14 19942.31
Indebtedness in 2006 selling Retail Never 64.8532 ns 30.5678 *** 36.6059 *
At least one year 56.3240 36.8479 50.5707
SO in 2006 selling Retail Never 346819.5 *** 182676.3 *** 180449.3 ns
At least one year 163364.8 250933.0 172732.5
Net profit in 2006 selling Retail Never 48563.57 ns 35650.18 *** 53812.20 *
At least one year 36795.60 71992.21 40768.09
Key: *, ** and *** denote a significance of tests for equality of means to the respective thresholds of 10%, 5% and 1% - ns indicates that there is no link.
Market gardening Wine growing Fruit production
Retail selling Retail selling Retail selling
Never
At least
one year Test Never
At least
one year Test Never
At least
one year Test
Level of agricultural education None 6.88% 12.87% ** 4.82% 6.43% *** 15.19% 15.71% ns Primary 2.02% 19.42% 29.29% 18.03% 22.06% 10.65% Secondary 44.53% 58.77% 63.71% 64.82% 57.79% 58.26% Superior 6.57% 8.94% 2.17% 10.72% 4.96% 15.38% Level of general education None 2.64% 0.64% ns 5.38% 3.43% ns 5.24% 4.29% ** Primary 17.14% 16.88% 17.79% 16.75% 28.25% 11.28% Secondary 78.96% 78.09% 74.04% 75.06% 65.07% 71.60% Superior 1.26% 4.39% 2.79% 4.76% 1.43% 12.84% Use of phytosanitary products The less intensive 38.03% 35.90% ns 16.08% 52.93% *** 3.48% 5.99% ns Intermediaries 46.64% 48.63% 55.07% 42.63% 61.89% 71.60% The most intensive 15.33% 15.47% 28.85% 4.45% 34.62% 22.41% Evolution of the acreage Decrease 11.65% 5.14% ns 18.86% 18.36% ns 32.06% 17.76% ns Stability or increase 88.35% 94.86% 81.14% 81.64% 67.94% 82.24% Evolution of the AWU Decrease 65.77% 45.26% ** 49.50% 48.11% ns 68.66% 51.49% * Stability or increase 34.23% 54.74% 50.50% 51.89% 31.34% 48.51% Evolution of the cash flow Decrease 61.33% 50.61% ns 50.29% 52.21% ns 59.83% 51.90% ns Stability or increase 38.67% 49.39% 49.71% 47.79% 40.17% 48.10% Evolution of indebtedness Decrease 48.28% 54.21% ns 57.35% 50.70% ns 62.40% 46.45% ns Stability or increase 51.72% 45.79% 42.65% 49.30% 37.60% 53.55% Evolution of SO Decrease 41.93% 9.11% ns 42.97% 34.79% ns 54.18% 25.53% *** Stability or increase 58.07% 70.89% 57.03% 65.21% 45.82% 74.47% Evolution of the net profit Decrease 49.12% 40.30% ns 45.84% 51.87% ns 45.51% 32.19% ns Stability or increase 50.88% 59.70% 54.16% 48.13% 54.49% 67.81% All farms 100% 100% 100% 100% 100%
Table 7a. Number of years in which the farmer sold at the retail scale with regards to the farm characteristics
Market gardening Wine growing Fruit production
Average Test Average Test Average Test
Level of agricultural education
None 4.5783 ref 6.3373 ref 6.7464 ref
Primary 6.0644 ns 6.3176 ns 5.0015 ***
Secondary 5.5570 ns 6.2154 ns 5.2075 ***
Upper 5.7207 ns 6.2596 ns 5.4125 ***
Level of agricultural education
None 6.5011 ref 6.2171 ref 5.7549 ref
Primary 5.5344 * 6.0602 ns 5.0046 ns
Secondary 5.5085 ns 6.3355 ns 5.2536 ns
Upper 6.0780 ns 5.5156 ns 6.9031 ns
More or less intensive use of phytosanitary products
The less
intensive users 5.7787 ref 6.5009 ref 6.2312 ref
Intermediate
users 5.3872 ns 5.9915 *** 5.4119 ns
The most
intensive users 5.4933 ns 5.6594 *** 5.4019 ns
Evolution of the AWU
Decrease 5.4285 * 6.5380 *** 5.3906 ns Stability or increase 5.6390 5.9759 5.5311
Evolution of the acreage
Decrease 4.8405 ns 6.2638 ns 4.3962 ns Stability or increase 5.5823 6.2424 5.6882 Evolution of indebtedness Decrease 5.6063 ns 6.1473 ns 4.7866 ns Stability or increase 5.4707 6.3482 6.0417 Evolution of SO Decrease 5.0626 *** 6.4343 ns 4.0909 ** Stability or increase 5.7419 6.1461 5.9277
Evolution of the net profit
Decrease 5.2933 ns 6.2870 ns 5.2634 ns Stability or increase 5.7135 6.2025 5.5515
Evolution of the cash level
Decrease 5.1155 * 6.3030 ns 5.5508 ns Stability or increase 5.9836 6.1845 5.3595
Key: *, ** and *** denote a significance of tests for equality of means to the respective thresholds of 10%, 5% and 1% - ns indicates that there is no significant difference in duration of short circuit between the populations considered sale.
Table 7b. Correlation between the number of years of retail selling and the main farms characteristics
Market
gardening Wine growing
Fruit production
AWU in 2006 -0.1130 0.1305* -0.2760*
Number of years during which the farm is insured -0.0966 0.0028 -0.1622
Indebtedness in 2006 -0.1081 0.0844 -0.0885
SO in 2006 -0.2024* -0.0424 -0.3379*
Table 8. Econometric modeling
Market
gardening Wine growing Fruit production
Determinants of the duration of retail selling
Level of agricultural education (ref: no)
Primary 1.1167 -0.7871 -1.0789
Secondary -0.1376 -0.7008* -0.9788
Upper -0.3533 -0.2308 -0.3286
Level of general education (ref: no)
Primary -0.1879 0.6002 -1.4269
Secondary 0.2146 0.7821 -0.9037
Upper 0.6714 0.9591 0.6930
More or less intensive use of phytosanitary products (ref: less intensive farms in 2006 and 2012)
Intermediate use -1.3470** -1.1676*** 0.0084
The most intensive in 2006 and 2012 -1.2111 -1.2158** -0.6099
AWU in 2006 0.0335 0.0020 -0.0400
Evolution of the AWU -1.0162* -0.9980*** -1.5407**
Acreage in 2006 -0.0864 0.0158 0.1029*
Evolution of the acreage -0.0006 -0.0710 -0.8487
Number of years during which the farm was insured 0.1919** 0.2327*** 0.0331
Indebtedness in 2006 -0.0050 -0.0017 -0.0041
Evolution of the indebtedness -1.0743 -0.4882* -0.4061
SO in 2006 0.0005 -0.0000 -0.0000
Evolution of the SO -0.1846 -0.2867 1.1622
Net profit in 2006 -0.0000 -0.0000 0.0000
Evolution of the net profit -0.6143 -0.9344*** -0.7829
Cash flow in 2006 0.0002 0.0000 -0.0001*
Evolution of the cash flow 0.2505 -0.6905** -1.2321*
Intercept 8.1066*** 7.5044*** 8.8652***
Selection equation: Determinants of retail selling
Level of agricultural education (ref: no)
Primary -0.8470* -0.3016 -0.4867
Secondary 0.0395 -0.0885 -0.1150
Upper 0.1283 0.7913* 0.6272
Level of general education (ref: no)
Primary 0.0185 0.5548 1.0546
Secondary -0.5019 0.4192 0.8953
Upper -0.1060 0.5063 1.6116*
More or less intensive use of phytosanitary products (ref: less intensive farms in 2006 and 2012)
Intermediate use -0.2060 -0.7256*** -0.4585
The most intensive in 2006 and 2012 -0.1302 -1.1874*** -0.6785
Acreage in 2006 -0.0182 -0.0167 -0.0000
Evolution of the acreage 0.2468 -0.3195 -0.0705
AWU in 2006 -0.0487 0.3844*** 0.0204
Evolution of the AWU -0.1731 0.2128 0.1166
Cash flow in 2006 -0.0000 -0.0000 0.0000
Evolution of the cash flow 0.0385 -0.2160 -0.2430
Indebtedness in 2006 -0.0021 0.0004 -0.0021
Evolution of the indebtedness -0.1900 -0.0187 -0.1517
SO in 2006 -0.0001 -0.0001** 0.0000
Evolution of the SO -0.1150 0.1620 0.5951*
Net profit in 2006 -0.0000 0.0000 -0.0000*
Evolution of the net profit -0.2690 -0.0721 -0.1270
Intercept 1.8906** 0.0743 -0.5896
Figure 1. Description of the observed states over 3 years
Figure 2. Representation of the considered model
Selling at the retail scale
No
Yes Number of campaigns during which the farm sold through retail selling T1
Selling at the retail scale Not selling at the retail scale
Selling at the retail scale
Not selling at the retail scale
Selling at the retail scale
Not selling at the retail scale
Selling at the retail scale
Not selling at the retail scale
Selling at the retail scale
Not selling at the retail scale
Selling at the retail scale
Not selling at the retail scale
Selling at the retail scale
Not selling at the retail scale T2