Publisher’s version / Version de l'éditeur:
Science of The Total Environment, 640-641, pp. 1635-1651, 2018-06-21
READ THESE TERMS AND CONDITIONS CAREFULLY BEFORE USING THIS WEBSITE. https://nrc-publications.canada.ca/eng/copyright
Vous avez des questions? Nous pouvons vous aider. Pour communiquer directement avec un auteur, consultez la
première page de la revue dans laquelle son article a été publié afin de trouver ses coordonnées. Si vous n’arrivez pas à les repérer, communiquez avec nous à [email protected].
Questions? Contact the NRC Publications Archive team at
[email protected]. If you wish to email the authors directly, please see the first page of the publication for their contact information.
NRC Publications Archive
Archives des publications du CNRC
This publication could be one of several versions: author’s original, accepted manuscript or the publisher’s version. / La version de cette publication peut être l’une des suivantes : la version prépublication de l’auteur, la version acceptée du manuscrit ou la version de l’éditeur.
For the publisher’s version, please access the DOI link below./ Pour consulter la version de l’éditeur, utilisez le lien DOI ci-dessous.
https://doi.org/10.1016/j.scitotenv.2018.05.394
Access and use of this website and the material on it are subject to the Terms and Conditions set forth at
Selenium analysis in waters. Part 2: Speciation methods
Leblanc, Kelly L.; Kumkrong, Paramee; Mercier, Patrick H. J.; Mester, Zoltán
https://publications-cnrc.canada.ca/fra/droits
L’accès à ce site Web et l’utilisation de son contenu sont assujettis aux conditions présentées dans le site LISEZ CES CONDITIONS ATTENTIVEMENT AVANT D’UTILISER CE SITE WEB.
NRC Publications Record / Notice d'Archives des publications de CNRC: https://nrc-publications.canada.ca/eng/view/object/?id=dcc043ce-238a-4f66-bbc1-415d17169ddb https://publications-cnrc.canada.ca/fra/voir/objet/?id=dcc043ce-238a-4f66-bbc1-415d17169ddb
Selenium Analysis in Waters
1
Part 2: Speciation Methods
2
Kelly L. LeBlanc*, Paramee Kumkrong, Patrick H.J. Mercier, Zoltán Mester 3
National Research Council Canada, 1200 Montreal Road, Ottawa, Ontario, Canada
4
*Corresponding Author Email: [email protected]
5
6
In aquatic ecosystems, there is often no correlation between the total concentration of selenium present 7
in the water column and the toxic effects observed in that environment. This is due, in part, to the 8
variation in the bioavailability of different selenium species to organisms at the base of the aquatic food 9
chain. The first part of this review (Kumkrong et al., 2018) discusses regulatory framework and standard 10
methodologies for selenium analysis in waters. In this second article, we are reviewing the state of 11
speciation analysis and importance of speciation data for decision makers in industry and regulators. We 12
look in detail at fractionation methods for speciation, including the popular selective sequential hydride 13
generation. We examine advantages and limitations of these methods, in terms of achievable detection 14
limits and interferences from other matrix species, as well as the potential to over- or under-estimate 15
operationally-defined fractions based on the various conversion steps involved in fractionation processes. 16
Additionally, we discuss methods of discrete speciation (through separation methods), their importance 17
in analyzing individual selenium species, difficulties associated with their implementation, as well as 18
ways to overcome these difficulties. We also provide a brief overview of biological treatment methods for 19
the remediation of selenium-contaminated waters. We discuss the importance of selenium speciation in 20
the application of these methods and their potential to actually increase the bioavailability of selenium 21
despite decreasing its total waterborne concentration. 22
Highlights - chemical speciation plays a vital role in selenium toxicity in aquatic systems 23
- biological treatment methods can alter selenium speciation in waters and effluents 24
- sub-ng/L detection limits can be obtained for selenium with several analysis methods 25
Keywords mass spectrometry, chromatography, solid phase extraction, selective sequential 26
hydride generation, bioremediation 27
Contents
28
1. Introduction 4
29
2. Selenium in Aquatic Ecosystems 4
30
3. Fractionation Methods for Selenium Speciation 10
31
3.1 Selective Sequential Hydride Generation 11
32
3.2 Photochemical Vapour Generation 15
33
3.3 Voltammetry 17
34
3.4 Liquid-Liquid (Micro)Extraction with Complexation 18
35
3.5 Solid Phase (Micro)Extraction 21
36
4. Separation Methods for Selenium Speciation 24
37
4.1 Gas Chromatography 25
38
4.2 Derivatization Approaches 27
39
4.3 High Performance Liquid Chromatography 28
40
4.4 Capillary Electrophoresis 34
41
4.5 Size-Based Speciation Methods 35
42
5. The Importance of Selenium Speciation in Biological Remediation Processes 36 43
6. Selenium Analysis in Environmental Samples – Future Outlook 42 44
References 44
List of Acronyms AEC Anion Exchange Chromatography, AAS Atomic Absorbance Spectrometry, AES
46
Atomic Emission Spectrometry, AFS Atomic Fluorescence Spectrometry, CC Collision Cell, CD 47
Conductivity Detection, CE Capillary Electrophoresis, CEC Cation Exchange Chromatography, CI Chemical 48
Ionization, CID Collision Induced Dissociation, CPE Cloud Point Extraction, CSV Cathodic Stripping 49
Voltammetry, CTAB Certyl Trimethylamminium Bromide, CVG Chemical Vapour Generation, DES Deep 50
Eutectic Solvent, DESe Diethyl Selenide, DLLME Dispersive Liquid-Liquid Microextraction, DMDSe 51
Dimethyl Diselenide, DMSe Dimethyl Selenide, DMSPE Dispersive Micro Solid Phase Extraction, DRC 52
Dynamic Reaction Cell, EDXRF Energy-Dispersive X-Ray Fluorescence Spectrometry, EI Electron 53
Ionization, ESI Electrospray Ionization, ETV Electrothermal Vapourization, FGD Flue Gas 54
Desulphurization, FID Flame Ionization Detection, GC Gas Chromatography, HFLPME Hollow Fibre Liquid 55
Phase Microextraction, HG Hydride Generation, HS Headspace, ICP Inductively-Coupled Plasma, IPRP 56
Ion-Pairing Reversed Phase, LLME Liquid-Liquid Microextraction, LOD Limit of Detection, MeSeCys 57
Methylselenocysteine, MS Mass Spectrometry, MS/MS Tandem Mass Spectrometry, OES Optical 58
Emission Spectrometry, org-Se Organoselenium, PVG Photochemical Vapour Generation, SEC Size-59
Exclusion Chromatogarphy, SeCys Selenocysteine, SeCys2 Selenocystine, SEM-EDXS Scanning Electron
60
Microscopy-Energy Disperse X-Ray Spectroscopy, SeMet Selenomethionine, SPE Solid Phase Extraction, 61
SPME Solid Phase Microextraction, SSHG Selective Sequential Hydride Generation, TBAH
62
Tetrabutylamminium hydroxide, TEM Transmission Electron Microscopy, TSe Total Selenium, UASB 63
Upflow Anaerobic Sludge Bed, USAEME Ultrasound-Assisted Emulsification Microextraction, U.S. EPA 64
United States Environmental Protection Agency, UV Ultra-Violet, VG Vapour Generation, XAS X-Ray 65
Absorption Spectrometry 66
67
1. Introduction
69
This article is the second in a two part series by these authors. The first part of this review (Kumkrong et 70
al., 2018) discusses regulatory framework and standard methodologies for selenium analysis in waters 71
used by government and non-governmental bodies in the monitoring of these concentrations. In this 72
second article we are reviewing the state of speciation analysis and importance of speciation data for 73
decision makers in industry and regulators. 74
Selenium (Se) is a naturally occurring element, distributed u e e l i the ea th s ust with a fairly low 75
overall abundance. In animals, Se acts as an antioxidant and is required for the regulation of glutathione 76
peroxidase as well as other biological functions. However, there is a very narrow threshold between 77
levels of essentiality and toxicity, and environmental Se contamination has led to negative effects on 78
aquatic ecosystems (Janz et al., 2010). For this reason, Se concentrations in waters are regulated 79
worldwide. Here, we take a closer look at the Se present in the environment, particularly in the context 80
of treated industrial wastewaters, and discuss the need for more robust analytical methods for the 81
analysis of Se in these waters. Specifically, we examine the role of speciation analysis as a more relevant 82
indicator of the potential for toxic effects of Se in the environment. 83
2. Selenium in Aquatic Ecosystems
84
Selenium is released naturally into the environment from the weathering of seleniferous soils, black 85
shales, and other sedimentary rocks of marine origin (Lussier et al., 2003; Tabelin et al., 2014a, b). 86
Agricultural irrigation of alkaline seleniferous soils significantly increases the mobilization of Se, as has 87
been seen in semi-arid regions of the southwestern United States (Ohlendorf, 2003). Se is also mobilized 88
by mining activities relating to copper, gold, silver, coal, uranium, and phosphate (Ballard and Mines; De 89
Gregori et al., 2002; Hu et al., 2009; Khamkhash et al., 2017; Martell et al., 2016). Additionally, Se is 90
combustion (Maher et al., 2010). Typically, high sulphur (S) areas also contain elevated levels of Se, 92
meaning fuels mined from these areas (such as the southeastern United States) are of particular 93
concern. Se is leached into waterways as the soluble oxyanions selenite (Se(IV) or HSeO3
-) and/or 94
selenate (Se(VI) or SeO4
2-) (Howard, 19772-). The form of Se present in the water is strongly dependent on 95
water chemistry, with Se(VI) present at oxidizing conditions. In more reducing environments Se(IV) 96
dominates, generally as HSeO3
for most natural waters, though some SeO3
is present at a out pH ≈ 97
and above. Elemental Se0 can be formed at more reducing conditions, and in extremely reducing 98
environments where pe < -1, HSe- may form (Khamkhash et al., 2017). Once they are dissolved in the 99
water, Se oxyanions can be adsorbed to iron and aluminium oxides, clay minerals, and carbonates 100
(Francisco et al., 2018; Hiemstra et al., 2007; Renard et al., 2013). Additionally, Se(IV) and/or Se(VI) can 101
be taken up by plants or invertebrates (Li et al., 2017; Malisa, 2001; Saha et al., 2017) which can cause 102
further transformations to elemental Se0 or Se2- (selenide), the latter of which is typically found as an 103
organic Se species such as selenomethionine (SeMet) or selenocysteine (SeCys) (Maher et al., 2010). The 104
uptake of different Se species into the aquatic food chain varies significantly depending on the species of 105
algae present at the base of this food chain (Baines and Fisher, 2011), though in freshwater systems it is 106
accepted that green algae take up SeMet at a significantly greater rate than the inorganic oxyanions 107
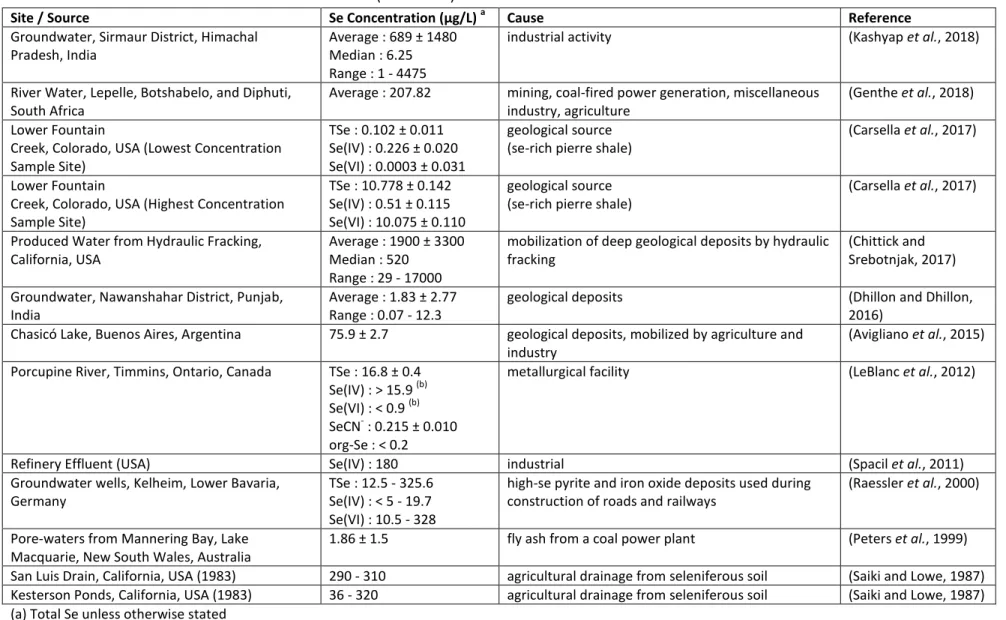
(Besser et al., 1989; Riedel et al., 1991; Sandholm et al., 1973). Figure 1 provides an overview of some of 108
Se species which could potentially be found in aquatic environments, and Table 1 shows concentrations 109
of Se in selected environments. 110
111
Figure 1: Selected inorganic and organic Se species. Arrows denote the metabolic pathway taken by
112
plants, based on data from Pilon-Smits and Quinn (2010); selenocyanate formation based on Simmons 113
and Wallschläger (2011). Double arrows indicate the condensation of several metabolic steps. Structures 114
drawn using the Ketcher Chemical Structure Editor (Life Sciences Open Source, 2014). 115
Table 1: A Non-Exhaustive List of Se Concentrations in (Untreated) Contaminated Waters
116
Site / Source Se Concentration (µg/L) a Cause Reference
Groundwater, Sirmaur District, Himachal Pradesh, India
Average : 689 ± 1480 Median : 6.25 Range : 1 - 4475
industrial activity (Kashyap et al., 2018)
River Water, Lepelle, Botshabelo, and Diphuti, South Africa
Average : 207.82 mining, coal-fired power generation, miscellaneous
industry, agriculture
(Genthe et al., 2018) Lower Fountain
Creek, Colorado, USA (Lowest Concentration Sample Site)
TSe : 0.102 ± 0.011 Se(IV) : 0.226 ± 0.020 Se(VI) : 0.0003 ± 0.031
geological source (se-rich pierre shale)
(Carsella et al., 2017)
Lower Fountain
Creek, Colorado, USA (Highest Concentration Sample Site)
TSe : 10.778 ± 0.142 Se(IV) : 0.51 ± 0.115 Se(VI) : 10.075 ± 0.110
geological source (se-rich pierre shale)
(Carsella et al., 2017)
Produced Water from Hydraulic Fracking, California, USA
Average : 1900 ± 3300 Median : 520
Range : 29 - 17000
mobilization of deep geological deposits by hydraulic fracking
(Chittick and Srebotnjak, 2017) Groundwater, Nawanshahar District, Punjab,
India
Average : 1.83 ± 2.77 Range : 0.07 - 12.3
geological deposits (Dhillon and Dhillon,
2016)
Chasicó Lake, Buenos Aires, Argentina 75.9 ± 2.7 geological deposits, mobilized by agriculture and
industry
(Avigliano et al., 2015)
Porcupine River, Timmins, Ontario, Canada TSe : 16.8 ± 0.4
Se(IV) : > 15.9 (b) Se(VI) : < 0.9 (b) SeCN- : 0.215 ± 0.010 org-Se : < 0.2
metallurgical facility (LeBlanc et al., 2012)
Refinery Effluent (USA) Se(IV) : 180 industrial (Spacil et al., 2011)
Groundwater wells, Kelheim, Lower Bavaria, Germany
TSe : 12.5 - 325.6 Se(IV) : < 5 - 19.7 Se(VI) : 10.5 - 328
high-se pyrite and iron oxide deposits used during construction of roads and railways
(Raessler et al., 2000)
Pore-waters from Mannering Bay, Lake Macquarie, New South Wales, Australia
1.86 ± 1.5 fly ash from a coal power plant (Peters et al., 1999)
San Luis Drain, California, USA (1983) 290 - 310 agricultural drainage from seleniferous soil (Saiki and Lowe, 1987)
Kesterson Ponds, California, USA (1983) 36 - 320 agricultural drainage from seleniferous soil (Saiki and Lowe, 1987)
(a) Total Se unless otherwise stated
117
Co e t atio s ithi the i e s algal loo ; upst ea of the loo “e as app o i atel % “e IV , % “e VI
118 119
Se is considered an essential micronutrient for animals, though in general cases of deficiency are quite 120
rare. This essentiality is related to the specific incorporation of Se, as SeCys, into selenoproteins, which is 121
genetically encoded by the UGA (stop) codon (Pilon-Smits and Quinn, 2010; Stadtman, 1996). These 122
proteins perform a variety of functions, including catalysis of oxidation-reduction reactions through the 123
action of glutathione peroxidases and thioredoxin reductases, the latter of which play a role in the 124
defense against oxidative stress, as well as in DNA synthesis and protein repair (Janz et al., 2010). 125
Research into the function of other selenoproteins is ongoing – while 25 selenoproteins have been 126
identified in the human selenoproteome (Kryukov et al., 2003), for example, some of their functions 127
remain undefined (Rayman, 2012). 128
There is a narrow range between Se essentiality and toxicity, making the latter the more common 129
environmental scenario (Young et al., 2010). While there is still some debate regarding the mechanisms 130
of Se toxicity, it does appear to occur through an oxidative stress mechanism. Through a reaction 131
catalyzed by glutathione peroxidase, Se has been shown to increase the ratio of oxidized to reduced 132
glutathione, increasing oxidative cell damage (Hoffman, 2002). Se speciation plays an important role 133
here because not all forms of Se are equal in their ability to induce oxidative stress. SeMet, for example, 134
does not react strongly with glutathione (Spallholz and Hoffman, 2002). However, in vivo metabolism of 135
SeMet to methylselenol has been observed, and since there latter is more reactive towards glutathione, 136
toxic effects have been noted following exposure to SeMet (Janz et al., 2010; Palace et al., 2004). 137
Conversely, some plant species have the ability to detoxify Se. Both Se0 (Van Hoewyk et al., 2005) and 138
Se-methylselenocysteine (MeSeCys) (Neuhierl et al., 1999) have been noted to be formed by plants 139
during the metabolism of Se, and these species can be accumulated without toxic effects. MeSeCys is 140
often formed as an intermediate during the production of the volatile species dimethyl diselenide 141
(DMDSe), which is excreted; another volatile species, dimethyl selenide (DMSe) is formed via the 142
metabolisms of SeMet (Pilon-Smits and Quinn, 2010). 143
Se toxicity is a concern in aquatic ecosystems due to its ability to bioaccumulate in the aquatic food 144
chain, with the greatest degree of bioconcentration occurring between the water and lowest tropic level 145
(Baines and Fisher, 2011). As it is a reproductive toxin, the teratogenic effects of Se are most commonly 146
observed in oviparous vertebrates such as predatory fish and waterfowl living in aquatic environments 147
(Hamilton and Buhl, 2003; Hamilton, 2004; Hume, 2014; Janz et al., 2010; May et al., 2008; Muscatello 148
et al., 2008). 149
With concerns about environmental Se toxicity increasing, particularly in North America, there has been 150
much focus on the remediation of contaminated waters through various approaches including physical, 151
chemical, and biological treatment methods. Over the past few decades, biological treatment methods 152
have been receiving much attention due to their relatively low cost and high efficiency (Dungan and 153
Frankenberger, 1999), but have the side-effect of altering Se speciation in their effluents in potentially 154
unpredictable manners. Specifically, the ability of algae and bacteria to produce and release organic Se 155
species (SeMet, particularly) LeBla a d Walls hl̈ge , , means that despite the overall efficiency 156
with which the Se is removed from waters by these biological treatment systems, the Se in the effluents 157
may actually be more bioavailable than what was present initially (Amweg et al., 2003). 158
It is apparent that an understanding of the Se speciation in an aquatic system could play an important 159
role in establishing the potential for Se-induced toxicity because aquatic Se speciation varies widely from 160
one ecosystem to another – inputs depend strongly on the type of source (U.S. EPA., 2016), but both 161
abiotic and biotic factors within an ecosystem have been shown to significantly alter Se speciation 162
(LeBlanc et al., ; LeBla a d Walls hl̈ge , ; Neu a et al., 2003). While monitoring fish 163
tissue concentrations will allow similar conclusions to be drawn, the observation of elevated 164
concentrations essentially means damage is already occurring in the ecosystem. Examining waterborne 165
species (especially in effluents) may allow for predictions of such damage, and potentially for mitigation. 166
Therefore, it is essential that analytical methods for the speciation analysis of Se are optimized to not 167
only distinguish between Se species, but to do so at environmentally-relevant concentrations and in the 168
presence of interfering constituents including anions and dissolved organic matter to arrive at accurate 169
and precise species abundance values. 170
Recent reviews by Tan et al. (2016) and Santos and coworkers (2015) provide thorough overviews of 171
recent advances in the treatment of Se-contaminated water, and also provide several examples of Se 172
concentrations in various types of contaminated waters. However, only Santos and coworkers (2015) 173
briefly touch on the analytical methods involved in the speciation analysis of the Se present in such 174
systems. Conversely, Pettine et al. (2015) review various analytical methods in great detail, but focus 175
mostly on total Se analysis, with some discussion of fractionation methods (those that are based on the 176
detection of a single species, often Se(IV)). P z ńska s (1996) review discusses the speciation analysis of 177
organic Se compounds in much more detail, but is now 22 years old and is therefore missing the most 178
recent advances in this field. In the present review, we critically examine various analytical methods 179
capable of evaluating Se speciation in natural waters and wastewaters, particularly focussing on 180
advances from the past two decades. We then discuss some bioremediation techniques and the 181
importance of Se speciation both before and after treatment. 182
3. Fractionation Methods for Selenium Speciation
183
Among the most basic speciation methods are those that take advantage of differences in the physical 184
and chemical behaviours of various Se species. Among these behaviours are the ability to form volatile 185
species for direct analysis through spectrophotometric methods, the potential for complexation of a 186
single species with another chemical agent (resin or dissolved chelator), and the formation of a solid 187
precipitate either through the application of an electric potential or the addition of another chemical 188
species to solution. The inherent difficulty with these types of method lies in the fact that they result in 189
ope atio all -defi ed f a tio s a d ofte o i e se e al disti t “e spe ies i to a si gle ategory – 190
most notably, this is the case for organic Se, which is distinguished from Se(IV) and Se(VI), but is not 191
defi ed i fu the detail ith a fe e eptio s i hi h a sele oa i o a id-like f a tio is 192
differentiated from the sum of organic Se, as explained in Section 3.5). Additionally, such types of 193
analyses are vulnerable to biases as they are often based on the assumption that only specific Se species 194
are reactive to the applied method, which can result in systematic over- or under-estimations of the 195
actual proportions of Se in particular fractions. Unlike separation methods for speciation analysis 196
dis ussed i “e tio , f a tio atio ethods t pi all easu e a total “e T“e amount, relying on 197
differences between this and other measured fractions to account for additional species rather than 198
analyzing them directly. 199
Below, several analysis methods using chemical fractionation for Se speciation are discussed in detail, 200
with particular emphasis on detection limits. The reader should keep in mind that these ethods usage 201
are operationally-defined fractions for the characterization of Se in environmental samples, especially 202
with regard to their potential advantages or limitations. 203
3.1 Selective Sequential Hydride Generation 204
Perhaps the most well-known and most widely-applied method of Se speciation through fractionation is 205
selective sequential hydride generation (SSHG), which takes advantage of the fact that Se(IV) forms 206
volatile SeH2 in the presence of borohydride (BH4
-). Various redox chemistries are then employed as 207
sample preparation methods prior to HG to differentiate between various Se species in solution. 208
The original Se speciation studies employing HG took advantage of the fact that only Se(IV) forms H2Se
209
under acidic conditions in the presence of BH4
as described by Cutter (1976) a d Meste , D Uli o, a d 210
coworkers D Uli o et al., 2005; Meija et al., 2006). At the optimal HCl concentration of 4 mol/L 211
determined by McDaniel et al. (1976), Cutter (1976) observed no detectable signal in a 0.2 µg/L Se(VI) 212
standard, though an equivalent concentration of Se(IV) was easily detected by atomic absorption 213
spectrometry (AAS) following HG. However, a prolonged heating of the acidified sample prior to mixing 214
with BH4
was shown to quantitatively (98%) reduce Se(VI) to Se(IV); the required heating time was 215
shown to vary by sample size, with freshwaters requiring slightly longer heating than seawaters, though 216
exceeding this optimal maximum caused further reduction of Se(IV) to Se0 (which is not detected by HG). 217
Furthermore, the addition of a UV irradiation step to decompose organic Se species (-II) in a photo-218
oxidation process to arrive at Se(VI) prior to heating the sample (Chen et al., 2005b), or the use of a 219
microwave digestion process for similar purposes (Velinsky and Cutter, 1990), was employed to produce 220
a total “e easu e e t. This se ue tial p o edu e allo ed esea he s to dete i e the th ee 221
operationally-defined fractions typically discussed: Se(IV) (direct HG analysis), Se(VI) ([“e IV + “e VI 222
fraction] – Se(IV)), and Se(-II total “e – [ “e IV + “e VI f a tio ]). 223
The SSHG method was further optimized by Chen, Belzile, and coworkers (2005a; 2005b) following a 224
thorough study of the photochemical behaviours of several inorganic and organic Se species in waters 225
containing various other ions. Based on the observed decomposition of several org-Se species (SeMet, 226
MeSeCys, SeCys2, and selenourea) following heating in 3.0 mol/L HCl, the method discussed above was
227
altered to account for the potential for overestimation of the Se(VI) content. Due to the fact that 228
oxidation of Se(IV) was blocked during UV irradiation in a 1 % HNO3 matrix in the presence of 2 % HCl,
229
this t eat e t as applied as a se o d step i the ““HG p o ess, a i i g at a “e IV + o g-“e f a tio . 230
In a final step to determine total Se, the irradiated sample was acidified and heated to reduce Se(VI) to 231
Se(IV) for HG analysis. 232
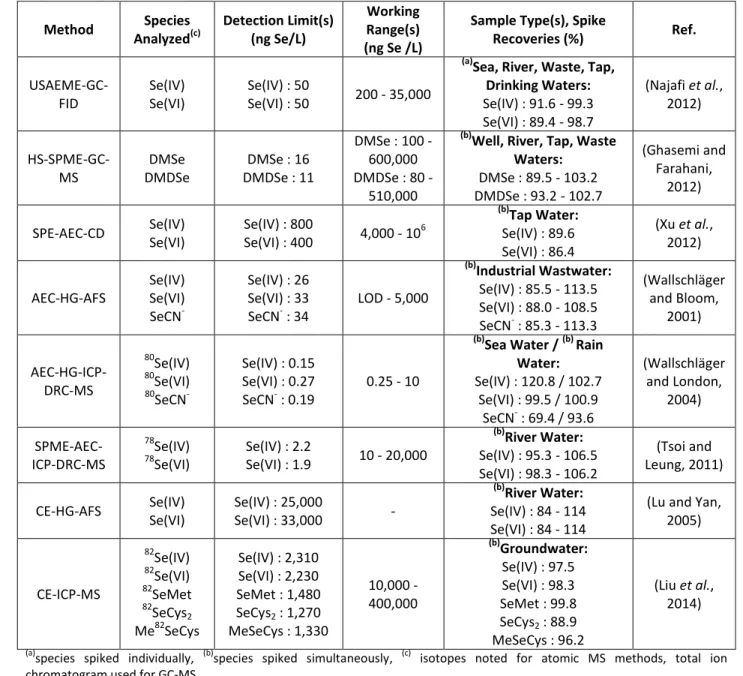
Table 2: Examples of Fractionation Methods for Se Speciation 233 Method Fractions Analyzed(c) Detection Limit(s)(d) (ng Se/L) Working Range(s)(f) (µg Se/L)
Sample Type(s), Spike
Recoveries (%) Ref. HG-AFS Se(IV) Se(IV) + Se(VI) Total Se Se(IV) : 50 Se(VI) : 60 Org-Se : 60 0.5 - 15.0 (b) Tap Water: Se(IV): 93.5 - 102.6, Se(VI) : 94.7 - 97.3 (a) FGD Water: Se(IV) : 95.5 - 101.5 Se(IV) + Se(VI) : 93.5 - 96 Total Se : 93.5 - 101.5 (Zhong et al., 2011) HG-AFS Se(IV) Se(IV) + org-Se Total Se 5 0.005 - 10,000 (a) Lake Water: Se(IV) : 80 - 110 Se(VI) : 80.4 - 107.1 (Chen et al., 2005a; Chen et al., 2005b) PVG-AFS Se(IV) Se(IV) + Se(VI) Se(IV) : 100 (e)
Se(VI) : 100 (e) 0.1 - 100 (b)Wastewater:
Se(IV) : 90 -110 Se(VI) : 80 - 115 (Zheng et al., 2008) PVG-ICP-MS 77,78,82 Se(IV) [ 77,78,82Se(IV) + 77,78,82 Se(VI) ] Se(IV) : 20 Se(VI) : 20 0.02 - 100 MSPE-ICP-MS 82 Se(IV)
82Se(IV) + 82Se(VI) 0.094 n/a
(a) Agricultural Water Se(IV) : 94.5 - 103.3 Se(VI) : 98.0 - 99.1 (Huang et al., 2012a) DMSPE-EDXRF Se(IV) Se(IV) + Se(VI) 32 0.032 - 500 (a,b) Mineral Water: Se(IV) : 98 Se(VI) : 99 Se(IV) + Se(VI) : 94 + 97 (Kocot et al., 2015) CP-FI-HG-ICP-OES Se(IV) Se(IV) + Se(VI) 30 0.03 - 200 (a) River Water: Se(IV) : 98.00 - 104.00 Se(VI) : 95.33 - 104.00 (Escudero et al., 2015) UALPME- DES-ETV-AAS Se(IV) Se(IV) + Se(VI) 4.61 0.2 - 8 (b)
Mineral Water / Tap Water:
Se(IV) : 97 - 99 Se(VI) : 96 - 99 (Panhwar et al., 2017) DLLME- ETV-ICP-MS 77 Se(IV) 77Se(IV) + 77Se(VI) 8.6 0.003 - 10 (a)
Lake, River Water:
Se(IV) : 86.3 - 96.7 Se(VI) : 86.7 - 94.1 (Liu et al., 2015) DLLME- SFOD-UV/Vis Se(IV) Se(IV) + Se(VI) 1600 5-600 (b)
River, Sea Water:
Se(IV): 96.0 - 101.0 Se(VI) : 95.0 - 97.8 (Dadfarnia et al., 2014) CPE-ETV-ICP-MS 82Se(IV) 82 Se(IV) + 82Se(VI) 50 0.25 - 50 (a)
Lake, River Water:
Se(IV) : 102 - 109 Se(VI) : 104 (Li et al., 2008) CPE-ETV-AAS Se(IV) Se(IV) + Se(VI) 2.5 - (b) Tap, Groundwater: Se(IV) : 98 - 110 Se(VI) : 92 - 108 (Sounderajan et al., 2010) HF- LPME-ETV-AAS Se(IV) Se(IV) + Se(VI) Se(IV) : 5 Se(VI) : 6 0.005 - 35 (b)
River, Sea Water / (b) Wastewater Se(IV) : 94 – 103 / 99 - 102 Se(VI) : 94 – 99 / 102 - 105 (Ghasemi et al., 2010) (a)
species spiked individually, (b)species spiked simultaneously, (c) isotopes noted for MS methods, (d) when only one value is
234
given, LOD is based on the species detected (i.e. H2Se from Se(IV) in HG-AAS), (e)
LOD using acetic acid (same PVG method as
235
ICP-MS detection), (f) the calibration range is listed where the authors did not state the upper end of the linear range
236 237
Generally, analysts use some variation of one of the methods described above – typically, a method 238
mo e losel ese li g Cutte s (1976), sometimes utilizing different methods for the reduction of 239
Se(VI) to Se(IV) or for the decomposition of organic Se species. Zhong et al. (2011), for example, 240
determined total Se following a 120°C digestion in 40% HCl, followed by reduction to Se(IV). This 241
method achieved detection limits of 50 to 60 ng/L and exhibited good spike recoveries in various water 242
samples (Table 2). Other methods include the use of potassium persulphate for oxidation of organic Se 243
to Se(IV), or for complete oxidation of organic Se and Se(IV) to Se(VI), which is then followed by a 244
reduction step (Zhang and Frankenberger, 2003). 245
Clearly, methods described above are quite labour-intensive, requiring significant sample preparation 246
prior to the analysis of each operationally-defined fraction. Therefore, the development of online 247
analysis methods was the ideal addition to this procedure. Through the use of flow injection, multiple 248
pumps and several mixing valves and loops, this online method involves the addition of BH4
-, sometimes 249
after the pre-reduction of Se(VI) to Se(IV), through the use of a heated and acidified mixing loop 250
(Wallschläger and Bloom, 2001) or online microwave digestion process (He et al., 1998; Moreno et al., 251
2000). Generally, this type of online method is used for the speciation analysis of inorganic Se only, but 252
the addition of a UV lamp could allow for the analysis of org-Se species as well, as is discussed below in 253
the context of chromatographic analysis (Darrouzès et al., 2008). 254
A significant potential for error during SSHG analysis is due to the possible presence of volatile selenides 255
such as DMSe and DMDSe in natural water samples (Moreno et al., 2003). SSHG analyses often do not 256
consider these species, leaving room for an overestimation of the Se(IV) fraction. To account for this, 257
Cutter (1976) modified his SSHG method by placing a gas chromatograph (GC) between the gas-liquid 258
separator and AAS, allowing for the separation of SeH2 from DMSe and DMDSe prior to detection. Such
259
a setup allowed these volatile selenides to be quantified simultaneously – an environmentally- and 260
analytically-relevant endeavour. It has been suggested that DMSe and DMDSe do not reach the detector 261
in their native form, but actually react with borohydride in the acidic medium to form more volatile 262
species such as methane selenol A ou ou a d Do a d, ; D Uli o et al., 1994). Moreno et al. 263
(2003) have confirmed this production of a more volatile compound (though not its identity) based on 264
the observation that with all else being equal, the absence of sodium borohydride caused the complete 265
disappearance of a Se signal for samples containing DMSe and DMDSe. 266
One fairly major complication associated with the analysis of waters (particularly contaminated 267
wastewaters, as are typically of interest in the discussion of environmental Se) is the interference 268
caused by the presence of transition metals, particularly Ni, Co, and Cu. These metals may interact with 269
BH4 causing reduced conversion to the detectable hydrides, and can act as a catalyst in the
270
decomposition of any hydrides that are formed (Dedina and Tsalev, 1995). There are a few methods by 271
which these issues can be resolved to allow for the analysis of Se in these types of waters. The 272
interferences can be removed using a sample pre-treatment step by precipitation or adsorption during a 273
column cleanup, or (more practically) the Se can be removed and concentrated by solid or liquid phase 274
extraction as is discussed in more detail in Sections 3.3 and 3.4. Conversely, Se vapour can be produced 275
via different approaches which do not involve borohydride (Guo et al., 2003b). 276
3.2 Photochemical Vapour Generation 277
Ultraviolet (chemical) vapour generation (UV-VG or UV-CVG), also referred to as photochemical vapour 278
generation (PVG), works on principles similar to the chemical hydride generation processes described 279
above, wherein a volatile Se species is produced from Se(IV) in solution, separated from the liquid, and 280
subsequently detected by some element-specific detector (such as AAS or atomic fluorescence 281
spectrometry (AFS)), or by gas chromatography coupled to mass spectrometry (GC-MS) in some 282
scenarios. Here, the combination of a UV lamp and the presence of certain organic species, particularly 283
(low molecular-weight) organic acids, causes photoreduction and formation of chemical vapour from 284
Se(IV) (Guo et al., 2003b; Zheng et al., 2008). The volatile products of PVG of inorganic Se were 285
identified when they were cryogenically trapped for subsequent analysis by GC-MS, and it was noted 286
that the species formed varied depending on the organic acid present. Using formic acid, the two 287
species observed were SeH2 (60 - 70 % yield) and SeCO (30 - 40 %), whereas DMSe was formed in the
288
presence of each of acetic and malonic acid, while diethyl selenide (DESe) was formed in solutions 289
containing propionic acid (Guo et al., 2003a). 290
Like with HG, the reactions described above are generally assumed only to occur for Se(IV); again, this 291
can be exploited for speciation analysis. Pre-reduction can be used to convert Se(VI) and/or organic Se 292
to Se(IV) prior to analysis, or this process can be conducted online. For example, Wang et al. (2004) 293
developed an online reduction where, under UV-irradiation and in the presence of nano-TiO2, Se(VI) was
294
reduced and formed H2Se. Further investigations by Zheng et al. (2008) demonstrated that this process
295
could be quenched by cooling the system, allowing for the detection of only Se(IV) in a mixed sample. As 296
seen in Table 2, the detection limit of this PVG-inductively-coupled plasma mass spectrometry (ICP-MS) 297
system was quite low (20 ng/L) for a fractionation method not involving any preconcentration, and spike 298
recoveries fell within a reasonable range. 299
When examining PVG methods for Se analysis, it is important to consider the potential interference 300
from organic Se species. Chen et al. (2005b) have demonstrated that four organic Se species – Se-urea, 301
SeMet, MeSeCys, and SeCys2– undergo photochemical oxidation to Se(IV) in the presence of UV light in
302
an ultrapure water matrix, a phenomenon that is significantly enhanced in the presence of low 303
concentrations (0.154 mol/L) of HNO3. Similarly, UV-assisted production of volatile organic Se species
304
has been observed upon the addition of selenoamino acids to synthetic seawater (Amouroux et al., 305
2000). Of course, the influence of the presence of organic acids needs to be further examined before 306
any finite conclusions can be drawn, but these findings suggest the potential for the overestimation of 307
inorganic Se species when organic Se is also present in a sample. Arguably, the more environmentally-308
relevant outcome of such an oversight would be that it would also result in an underestimation of 309
organic Se in analyses accounting for this operationally-defi ed f a tio as the diffe e e et ee total 310
“e a d “e IV + “e VI . Looking specifically to PVG, there is some evidence that these processes are 311
occurring: Guo and coworkers (2003a) observed some production of volatile Se from the UV-irradiation 312
of SeMet and SeCys2 under these conditions, but did not investigate the identity of these species
313
because the yield was quite low. 314
3.3 Voltammetry 315
While it is not among the most common analysis method for Se, voltammetry has been successfully 316
employed for the speciation of Se in water samples due to the fact that, much like HG and PVG, only 317
Se(IV) is detected with this method. Cathodic stripping voltammetry (CSV) is often employed using 318
either a thin mercury film electrode or a hanging mercury drop electrode, resulting in the collection of 319
Se as SeHg (Rubinskaya et al., 2003) or as a copper-Se or rhodium-Se complex if Cu or Rh is added to the 320
sample (Pettine et al., 2015). Using CSV with a mercury-film electrode, Rubinskaya et al. (2003) achieved 321
a detection limit of 0.1 µg/L for Se. Conversely, Bertolino and coworkers (Bertolino et al., 2006) were 322
able to detect Se at 0.004 µg/L based on a preconcentration on activated carbon, which followed the 323
reduction of Se(IV) to Se0 by L-ascorbic acid. Reduction of both Se(VI) and Se(VI) to Se0 by hydrazine 324
allowed for (inorganic) speciation analysis, where 99-104% recovery was obtained for each species in 325
river water. There, detection was based on Osteryoung square-wave voltammetry using a platinum 326
electrode. 327
328
3.4 Liquid-Liquid (Micro)Extraction with Complexation 330
Another method for the fractionation of Se species in a mixed solution involves the selective extraction 331
of one of those species into a second liquid phase, typically after the formation of a complex between an 332
added chemical agent and the Se species of interest, known as liquid-liquid microextraction (LLME). 333
A common process is the formation of piazselenols through the complexation of phenylenediamines 334
with Se(IV) under acidic conditions. While these yellow-coloured complexes can be examined by UV/Vis 335
spectrophotometry, detection limits are quite high when the aqueous samples are analyzed directly and 336
it is therefore beneficial to extract the piazselenols into an organic phase. Dadfarnia et al. (2014) employ 337
a a iatio of this ethod he e the fo a o ple et ee “e IV a d , -diaminobenzidine and 338
extract the resulting piazselenols into 1-undecanol prior to measuring the absorbance at 434 nm. While 339
detection limits achieved here were still relatively high (1.6 µg/L, see Table 2), this LLME method has the 340
significant advantage of being robust enough to tolerate high salinity samples – up to 1.0 mol/L were 341
examined here without issue (moving beyond this increases the solubility of 1-undecanol in the aqueous 342
phase). This is particularly advantageous for many of the highly-contaminated environmental samples 343
that are of interest for Se speciation, such as agricultural drainage waters and flue-gas desulphurization 344
(FGD) waters. 345
There are various other chelating agents that can be used in a similar manner, though many of these do 346
not formed a coloured complex and therefore require more sophisticated detection systems. For 347
example, Liu et al. (2015) used diethyldithiocarbamate to form a complex with Se(IV) which was then 348
extracted into a bromobenzene layer that was subsequently separated through centrifugation and 349
analyzed by electrothermal vaporization (ETV) ICP-MS. Following this method, the detection limit of 8.6 350
ng/L was significantly lower than that observed with the spectrophotometric method described above, 351
despite the slightly lower enrichment factor of 107 (Liu et al., 2015) (compared to 133 (Dadfarnia et al., 352
2014)). 353
There are other methods using liquid-liquid extraction principles that have been modified for various 354
applications or to improve extraction efficiency: for example, hollow fiber liquid phase microextraction 355
(HFLPME), which was first described by Pedersen-Bjergaard and Rasmussen (1999). Here, a porous 356
hollow fibre is coated with an organic solvent that is immiscible in the aqueous phases, filled with an 357
a epto solutio a d pla ed i to the sa ple, hi h is sti ed. The a al te o es th ough the o ga i 358
membrane into the acceptor solution in the hollow fibre, becoming more concentrated and leaving 359
other (non-miscible) contaminants behind in the starting sa ple do o solutio . 360
The use of HFLPME is particularly advantageous for samples with low Se concentrations as it has the 361
ability to achieve high enrichment factors due to the low volume of acceptor solution used in the hollow 362
fiber. The low detection limits achieved by Ghasemi and coworkers (2010) noted in Table 2 were 363
obtained due to the enrichment factor of 480 observed in their experiment, where they first chelated 364
Se(IV) with ammonium pyrrolidinecarbodithionate before extracting the complex into toluene contained 365
in a hollow fiber. Enrichment factors ranging from 49 (Moreno et al., 2013) to 410 (Xia et al., 2006) have 366
also been achieved following similar HFLPME protocols. 367
Another LLME process is cloud point extraction (CPE), which is based on the principle that a 368
homogeneous solution containing a non-ionic surfactant will separate into two phases when heated to a 369
specific temperature known as the cloud point temperature. If a chelating agent is also added to 370
solution prior to heating, metal (i.e. Se) complexes can be trapped in the micelles formed during this 371
process. The layers are then separated (usually by centrifugation) and the surfactant-rich layer is 372
subsequently analysed. Since the micellular phase is present in a small volume relative to the starting 373
sample, CPE is generally associated with a good degree of preconcentration for the analyte of interest 374
(Altunay and Gürkan, 2016; Samaddar and Sen, 2014). 375
Reactions forming piazselenols can be used with CPE procedures, as has been discussed by Sounderajan 376
et al. (2010) ho ea ted “e IV ith , -diaminobenzidine. Using the surfactant Triton X-114 (added in 377
an aqueous solution), they were able to obtain an enrichment factor of 100 following phase separation 378
and achieved detection limits of 2.5 ng/L with ETV-AAS. Similarly, the reaction of Se(IV) with 379
diethyldithiocarbamate has also been used with CPE, with the complex extracted into Triton X-114 at 380
the cloud point temperature. Here, researchers obtained a detection limit of 50 ng/L based on an 381
enrichment factor of 50 (Li et al., 2008); see Table 2. 382
An interesting recent development in the field of LLME is the use of environmentally friendly extraction 383
solvents, specifically deep eutectic solvents (DES). These solvents are formed through the combination 384
of quaternary ammonium salts with hydrogen bond donors (carboxylic acids, acid amides, polyhydric 385
alcohols) in a specific molar ratio and have significantly lower freezing points than either of their 386
components (Paiva et al., 2014; Panhwar et al., 2017). While these solvents are more commonly used 387
for the extraction of elements and organic compounds from food (Panhwar et al., 2017) or soil (Matong 388
et al., 2017) samples, they have also been successfully applied in the extraction of Se(IV) complexes 389
from water samples. For example, Panhwar et al. (2017) used diaminobenzidine to complex Se(IV) in 390
water sample, then added a DES, sonicated the solution in the presence of a small amount (~ 2 % v/v) of 391
tetrahydrofuran to disperse the DES as nano-sized droplets in solution (increasing extraction efficiency), 392
then centrifuged the sample to separate the solvent layer. This method achieved an enrichment factor 393
of 50, and relatively low detection limits (Table 2). 394
An important common component of all of these LLME protocols is the fact that they are all selective to 395
a single Se species – typically this is Se(IV). To determine the other Se species in solution, researchers 396
reduce Se(VI) to Se(IV) using one of a few different methods which usually involve heating the sample to 397
about 100°C in the presence of L-cysteine (0.5 to 1.5% w/v) (Altunay and Gürkan, 2016; Liu et al., 2015) 398
or a strong acid (HCl or HBr, usually at concentrations of 2 to 4 mol/L) (Dadfarnia et al., 2014; Ghasemi 399
et al., 2010), sometimes using a microwave (Panhwar et al., 2017; Sounderajan et al., 2010). Following 400
this reduction, this second sample aliquot is then subjected to the LLME procedure and the Se(VI) 401
concentration is calculated as the difference between the two measurements. This follows the same 402
p i iples dis ussed fo ““HG, though he e the sele ti e se ue tial steps so eti es i ol e slightl 403
different chemical reactions and an org-Se fraction is often not explicitly discussed for LLME methods. 404
3.5 Solid Phase (Micro)Extraction 405
Solid phase extraction (SPE) (sometimes referred to as solid phase microextraction (SPME)) is a common 406
preparatory step, often used to remove chemical interferences and/or preconcentrate an analyte prior 407
to analysis. Generally, SPE works due to interactions between the solid phase and analyte(s) (or 408
interferences) in solution. Assuming the goal is to retain the analyte on the solid phase (the other option 409
is to retain interfering components in the matrix solution, where the analyte is passed through the solid 410
phase e di g up i a lea e solutio , ph si al a d he i al i te a tio s ause the a al te to e ad- 411
or ab-sorbed onto the solid phase while non-interacting matrix components are removed. After a 412
sample is passed through the solid phase, the analyte is then eluted with a solution that causes the 413
environment to be altered such that the analyte is no longer retained (i.e. through a pH change, or the 414
eluent interacting more strongly with the resin a d pushi g the a al te off . P e o e t atio o u s 415
when the volume of sample loaded onto the resin is greater than the volume of eluent, if the recovery is 416
high. 417
Based on the wide variety of solid phases available for purchase or which can be prepared in-house, 418
speciation analysis can also be conducted using SPE to separate different chemical species. Most 419
commonly, a single species is selectively retained and concentrated, sometimes following the 420
production of a Se-complex with an added chelating agent. The species of interest is then retained 421
directly on the solid phase, examples of which include cetyl trimethylammonium bromide- (CTAB) 422
modified alkyl-silica (Xiong et al., 2008) and ZrO2-modified coal cinder (Wei et al., 2014). Typically,
423
analysist will optimize the sample matrix and eluent to ensure quantitative recovery of the species of 424
interest without interference from other Se species also present in the sample (i.e. to distinguish 425
between Se(IV) and Se(VI)). 426
Recently, there has been increased interest in the application of nanoparticles to SPE procedures since 427
their large surface area allows for significant preconcentration using only small amounts of the solid 428
phase. For example, Nyaba et al. (2016) obtained an enrichment factor of 850 and a detection limit of 429
1.4 ng/L by combining ICP-optical emission spectrometry (ICP-OES) with their suspended dispersive 430
SPME method using alumina nanoparticles functionalized with Aliquat-336 (which adsorbed Se(IV)). The 431
wide variety of nanoparticles readily available also increases their versatility. Magnetic nanoparticles 432
such as mercapto-silica-Fe3O4 (magnetite) can be quickly and easily separated from solution using a
433
magnet following the adsorption of Se(IV) (Huang et al., 2012a). 434
An interesting modification of an SPE protocol allows the retained Se to be quantified in-situ rather than 435
after elution. In one such experiment, a Se(IV)-chelating agent complex was formed and adsorbed onto 436
a gel-like resin, which was then mechanically separated from solution and the absorbance of the 437
complex in the gel was measured directly by UV/Vis spectrophotometry (Amin, 2014). Due to the limited 438
sensitivity of this type of instrumentation, detection limits for such methods can be relatively high, 439
particularly where sample size is limited. For example, using a 25 mL sample, Amin (2014) achieved a 440
detection limit of 2.80 µg/L following UV/Vis spectrophotometry, but using a 1000 mL sample decreased 441
this to 0.06 µg/L, which increases the applicability of this method to analysis of natural waters where Se 442
concentrations are relatively low, but larger volumes are readily available. Conversely, Kocot et al. 443
(2015) used energy-dispersive X-ray fluorescence spectrometry (EDXRF) as a direct solid phase detection 444
method following dispersive micro-SPE (DMSPE) and achieved a method detection limit of 0.032 µg/L 445
due to the obtained enrichment factor of 1013 (see Table 2). 446
The combination of more than one solid phase can result in a more thorough fractionation of the Se 447
within a water sample. For example, Besser and coworkers (1994) were able to determine four Se 448
fractions – Se(IV), Se(VI), free selenoamino acids, and non-amino acid organoselenium compounds – 449
through the use of two activated charcoal micro-columns, an anion exchange micro-column, and a 450
copper-form cation exchange resin-packed column. 451
Similar to the other fractionation methods discussed thus far, SPME usually operates based on the 452
selective retention of a single Se species on the chosen resin, with the others being calculated based on 453
the difference following a reduction (or oxidation) step. However, the nature of SPE allows for another 454
option: selective elution, rather than selective retention. Since the two major Se species in natural 455
waters are anions under ambient conditions, an anion exchange resin will retain both of these species. 456
Se(VI) is retained more strongly, and will remain on the resin while Se(IV) is eluted with a lower strength 457
eluent (i.e. 0.1 mol/L HCl or HNO3), and can be eluted in a second step with a stronger solution (Lin,
458
2007; Stripeikis et al., 2004). This procedure does not account for organic Se which may pass through 459
the resin upon loading the sample, or may be weakly retained and eluted with Se(IV) causing an 460
overestimation of that fraction. 461
This selective elution process is where the so e hat a iguous li e et ee f a tio atio a d 462
spe iatio ethods of ulti-species Se analysis can be drawn. The former often pools multiple species 463
together, whereas the goal of speciation methods is typically to examine discrete species individually. 464
4. Separation Methods for Selenium Speciation
466
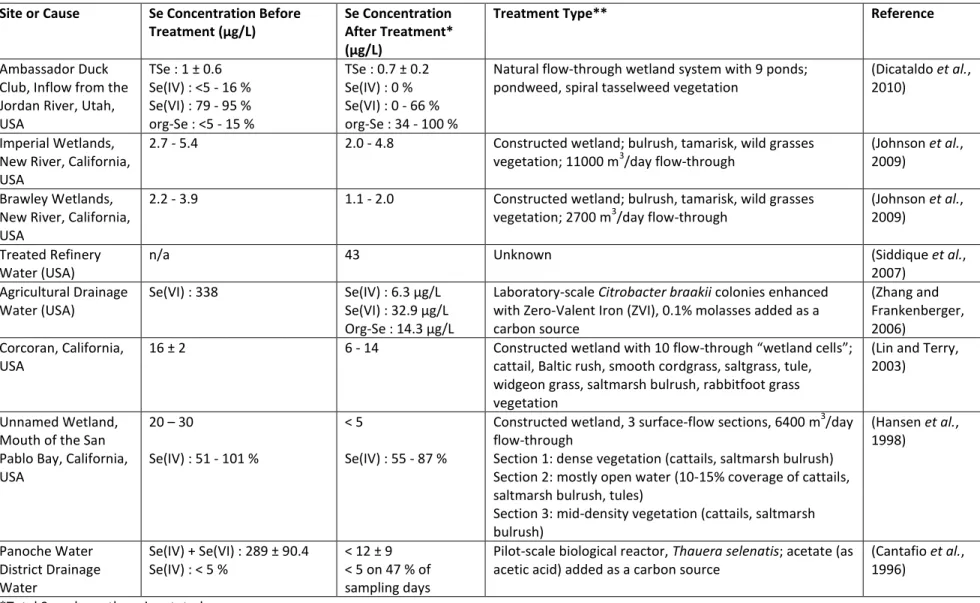
Table 3: Examples of Separation Methods for Se Speciation
467 Method Species Analyzed(c) Detection Limit(s) (ng Se/L) Working Range(s) (ng Se /L)
Sample Type(s), Spike
Recoveries (%) Ref. USAEME-GC-FID Se(IV) Se(VI) Se(IV) : 50 Se(VI) : 50 200 - 35,000 (a)
Sea, River, Waste, Tap, Drinking Waters: Se(IV) : 91.6 - 99.3 Se(VI) : 89.4 - 98.7 (Najafi et al., 2012) HS-SPME-GC-MS DMSe DMDSe DMSe : 16 DMDSe : 11 DMSe : 100 - 600,000 DMDSe : 80 - 510,000 (b)
Well, River, Tap, Waste Waters: DMSe : 89.5 - 103.2 DMDSe : 93.2 - 102.7 (Ghasemi and Farahani, 2012) SPE-AEC-CD Se(IV) Se(VI) Se(IV) : 800 Se(VI) : 400 4,000 - 10 6 (b) Tap Water: Se(IV) : 89.6 Se(VI) : 86.4 (Xu et al., 2012) AEC-HG-AFS Se(IV) Se(VI) SeCN- Se(IV) : 26 Se(VI) : 33 SeCN- : 34 LOD - 5,000 (b) Industrial Wastwater: Se(IV) : 85.5 - 113.5 Se(VI) : 88.0 - 108.5 SeCN- : 85.3 - 113.3 (Wallschläger and Bloom, 2001) AEC-HG-ICP-DRC-MS 80 Se(IV) 80 Se(VI) 80 SeCN- Se(IV) : 0.15 Se(VI) : 0.27 SeCN- : 0.19 0.25 - 10 (b)
Sea Water / (b) Rain Water: Se(IV) : 120.8 / 102.7 Se(VI) : 99.5 / 100.9 SeCN- : 69.4 / 93.6 (Wallschläger and London, 2004) SPME-AEC-ICP-DRC-MS 78 Se(IV) 78 Se(VI) Se(IV) : 2.2 Se(VI) : 1.9 10 - 20,000 (b) River Water: Se(IV) : 95.3 - 106.5 Se(VI) : 98.3 - 106.2 (Tsoi and Leung, 2011) CE-HG-AFS Se(IV) Se(VI) Se(IV) : 25,000 Se(VI) : 33,000 - (b) River Water: Se(IV) : 84 - 114 Se(VI) : 84 - 114
(Lu and Yan, 2005) CE-ICP-MS 82 Se(IV) 82Se(VI) 82 SeMet 82 SeCys2 Me82SeCys Se(IV) : 2,310 Se(VI) : 2,230 SeMet : 1,480 SeCys2 : 1,270 MeSeCys : 1,330 10,000 - 400,000 (b) Groundwater: Se(IV) : 97.5 Se(VI) : 98.3 SeMet : 99.8 SeCys2 : 88.9 MeSeCys : 96.2 (Liu et al., 2014) (a)
species spiked individually, (b)species spiked simultaneously, (c) isotopes noted for atomic MS methods, total ion
468
chromatogram used for GC-MS
469 470
U like the f a tio atio ethods dis ussed a o e, sepa atio ethods usuall do ot i lude a total 471
“e f a tio , a d the efo e ofte do ot e essa il account for all of the Se in a given sample. In some 472
cases, one or more species may not interact with the chromatographic column and therefore elute in 473
the void volume – this is frequently encountered in liquid chromatography and is discussed in more 474
detail, below. Conversely, certain Se species in a sample may simply never enter the column, as is the 475
case for GC methods examining volatile species or those relying on (typically species-specific) 476
derivatization protocols. For this reason, analysts often combine speciation methods with total Se 477
dete i atio s allo i g fo a o pa iso of the su of spe ies ith the total “e alue; the diffe e e 478
between these two measurements has varying analytical implication, depending on the speciation 479
method employed. 480
Prior to the speciation analysis of a water sample using a separation method, it is not uncommon for 481
one of the sample preparation methods discussed above (in the context of fractionation) to be 482
employed for preconcentration or sample cleanup. Water samples – particularly those collected from 483
contaminated industrial sources – often contain high concentrations of other chemical components, 484
which often interfere with the separation methods used for analysis of Se species. These pre-treatment 485
protocols, and their applicability to the various analytical procedures, are discussed in more detail 486
below. 487
4.1 Gas Chromatography 488
As noted above, some volatile Se species are formed through biological activity or photochemical 489
reactions in natural waters, making them ideal candidates for identification and/or quantification by GC. 490
When a gas or liquid sample is injected in a gas chromatograph it is heated and passed through a 491
chromatography column which is either hollow or packed with an inert material coated with a thin layer 492
of non-volatile liquid. The column is heated (sometimes following a gradient of increasing temperature) 493
and analytes are separated based on their volatility as a carrier gas (mobile phase) is passed through the 494
column. Due to the fact that the eluent is in the gas phase, a wide variety of detectors can be coupled 495
with GC instruments. Among the most popular is the flame ionization detector (FID) due to its nearly 496
universal nature: the sample is burned in a H2 flame generating a signal for most carbon-containing
497
species. Mass spectrometry (MS) is another popular detection method, with several options available. 498
Most widely applied to GC is an instrument employing electron ionization (EI), which is a high energy 499
ionization method that causes an analyte molecule to fragment in a characteristic pattern, often 500
allowing for its identification, particularly when compared to a library of mass spectra. Chemical 501
ionization (CI) is a softer ionization technique which keeps a larger proportion of the analyte molecules 502
intact for analysis. Both of these ion sources can be associated with either a single or triple quadrupole 503
mass analyzer – the former takes a single mass spectrum, while the latter allows for further selectivity 504
and targeted fragmentation of an analyte molecule or fragments thereof. The significant advantage of 505
using this type of MS system is the ability to identify analytes based on their mass spectra. ICP-MS 506
instruments can also be modified to analyze GC eluent for element-specific detection. 507
The incompatibility of water with GC means that direct injection of a natural water sample is to be 508
avoided, so the analysis of volatile species generally includes an extraction step, either directly from the 509
water (Lenz et al., 2008a; Lenz et al., 2011) o f o the sa ple s headspa e (Ghasemi et al., 2010; 510
Ghasemi and Farahani, 2012). For example, Lenz et al. (2008a; 2011) exposed their sample to a 511
carboxen/ polydimethylsiloxane SPME fiber to collect and concentrate DMSe and DMDSe from water 512
samples. The Se was then eluted and injected for GC-MS analysis. Limits of quantification for this 513
method were noted to be 1.5 µg/L and 2.5 µg/L (as Se) for DMSe and DMDSe, respectively. A similar 514
method used nano-structured lead dioxide (deposited on a platinum wire) as the solid phase in a 515
headspace-SPME protocol prior to thermal desorption and GC-MS, but achieved significantly lower 516
detection limits (16 ng/L and 11 ng/L for DMSe and DMDSe, respectively, see Table 3), potentially due to 517
the high efficiency of nanomaterials for analyte extraction. This method was used for the analysis of 518
several environmental water samples; there, the only sample shown to contain native concentrations of 519
DMSe and DMDse was the wastewater, which contained 4.3 and 1.9 µg/L, respectively (Ghasemi and 520
Farahani, 2012). The authors do not comment on the source of the wastewater, so it is unknown 521
4.2 Derivatization Approaches 523
Since the majority of Se species are not naturally volatile, their analysis by GC requires sample 524
preparation involving the derivatization of these non-volatile species into appropriate analytes. Probably 525
the most common derivatization procedure allowing for the analysis of inorganic Se by GC involves the 526
production of piazselenols. These volatile species form through the reaction of Se(IV) with 527
phenylenediamines under acidic conditions and are then extracted into an organic solvent for 528
subsequent analysis (Najafi et al., 2012). This liquid-liquid extraction step is particularly beneficial for the 529
analysis of Se in environmental samples due to its preconcentration capabilities. Enrichment factors 530
between 112 (dispersive liquid-liquid microextraction, DLLME (Bidari et al., 2008)) and 2491 (ultrasound-531
assisted emulsification microextraction, USAEME (Najafi et al., 2012)) have been achieved during the 532
analysis of inorganic Se in water samples. Similar to the fractionation methods discussed above, only 533
one species is sensitive to this derivatization, meaning that the others (in this example Se(VI) and/or 534
total Se) are calculated based on the difference between measurements after conversion to Se(IV). 535
Derivatization protocols have also been employed to analyze non-volatile organic Se species. These 536
methods have been used for the analysis of SeMet extracted from yeast and derivatized with an alkyl 537
chloroformate (Mester et al., 2006; Ouerdane and Mester, 2008; Yang et al., 2004a) or cyanogen 538
bromide (Yang et al., 2004b), as well as SeMet extracted from algae and derivatized by silylation (Fan et 539
al., 1997; Fan et al., 1998); this silylation-GC-MS procedure was also demonstrated to be effective for 540
MeSeCys and SeCys in a standard solution. With a thorough extraction and preconcentration protocol, 541
these methods could theoretically be applied to organic Se species in waters, though to the best of our 542
knowledge this has not yet been attempted. 543
An important benefit of the use of GC for separation of derivatized Se before detection (by FID, MS, etc.) 544
is the ability to account for any potentially volatilizing Se species that may be present in the native 545
sample, if they are also extracted into the organic phase. This will not necessarily be a quantitative 546
recovery – one of the GC methods discussed above should be used for such purposes – but ensures that 547
the target species are not overestimated due to the presence of volatile Se, as is a difficulty in methods 548
such as SSHG, as discussed above. 549
4.3 High Performance Liquid Chromatography 550
High performance liquid chromatography (HPLC) is easily the most widely used method for Se speciation 551
analysis, mainly due to the fact that it encompasses a broad range of analytical methods, all of which 552
operate following a similar set of principles. For the purposes of this review, any methods employing a 553
solid stationary phase and liquid mobile phase will be discussed under the HPLC heading, with different 554
stationary phase types being considered in more detail separately, with the exception of size exclusion 555
chromatography, which is discussed in Section 4.5 with the other size-based speciation methods. 556
As already discussed extensively, the major Se species in natural waters are present as oxyanions under 557
ambient conditions; therefore, it follows that the chromatographic method most popular for the 558
analysis of these waters is anion exchange chromatography (AEC). Here, the column (stationary phase) is 559
composed of cationic exchange sites – commonly quaternary ammonium groups on cross-linked 560
styrene-divinylbenzene copolymer – and the mobile phase (eluent) is a salt solution, sometimes of high 561
pH (Harris, 2007; Skoog et al., 2007). 562
It is common for commercially available ion chromatography systems to come equipped with a 563
conductivity detector (CD), allowing for the analysis of relatively high concentrations of the major anions 564
in water samples. Due to the high conductivity of the mobile phase used in these systems, they typically 565
employ an eluent suppressor which itself is a small-scale ion exchange membrane which uses an electric 566
potential and/or regeneration solution (H2SO4 is common in AEC) to convert the highly conductive ions
This allo s the a al tes o du ti it to e dete ted ithout i terference from the mobile phase (Small 569
et al., 1975). Conductivity detection combined with AEC has been applied to Se speciation analysis. For 570
example, Lenz et al. (2006) achieved detection limits of 25 µg/L for Se(IV) and 11 µg/L for Se(VI) using 571
suppressed AEC with a sodium hydroxide eluent for Se speciation in an aqueous extract of anaerobic 572
granular sludge. While detection limits in this range are quite high in comparison to others discussed 573
here and too high for the analysis of natural waters, they are applicable to some industrial samples. As 574
Lenz and coworkers (2006) highlighted, these values are well below the allowable total Se concentration 575
of 1 mg/L for liquid effluents in metal finishing industries in much of Europe at the time of their 576
publication. Based on this, the cost-effectiveness of an AEC-CD system, and the minimal sample 577
preparation required for typical industrial water samples, this is an ideal method to perform inorganic Se 578
speciation analysis in industrial settings. 579
Similar instrumental setups have been coupled to more sensitive detection methods – most commonly 580
ICP-MS. While the mobile phase is not as problematic here as it is with CD, the use of a membrane 581
suppressor is still beneficial for inorganic Se speciation analysis. The use of a sodium/potassium 582
hydroxide elution gradient (as is common with AEC) does cause signal suppression in ICP-MS. Through 583
the application of eluent suppression, Wallschläger and Roehl (2001) observed a 1.5-, 1.4-, and 1.3-fold 584
increase in the signal-to-noise ratio on 82Se for Se(IV), Se(VI), and SeCN-, respectively (note that those 585
species elute in that order using an increasing concentration sodium hydroxide elution gradient). In 586
addition to reducing analysis sensitivity, the introduction of large quantities of sodium hydroxide (or 587
similar salt solutions) into an ICP-MS decreases the lifetime of the instrument and its components – 588
particularly the cones and lens stack which require more frequent cleaning. 589
Whereas eluent suppression in AEC can be extremely useful, it cannot be universally applied to Se 590
speciation analysis. Samples containing, or potentially containing, organic Se cannot be analyzed 591