doi: 10.3389/fenvs.2018.00070
Edited by: Philippe C. Baveye, AgroParisTech Institut des Sciences et Industries du Vivant et de L’Environnement, France Reviewed by: Ingo Schöning, Max-Planck-Institut für Biogeochemie, Germany Jessica M. Furrer, Benedict College, United States *Correspondence: Marie-Liesse Vermeire [email protected]
Specialty section: This article was submitted to Soil Processes, a section of the journal Frontiers in Environmental Science Received: 27 February 2018 Accepted: 13 June 2018 Published: 13 July 2018 Citation: Vermeire M-L, Cornélis J-T, Van Ranst E, Bonneville S, Doetterl S and Delvaux B (2018) Soil Microbial Populations Shift as Processes Protecting Organic Matter Change During Podzolization. Front. Environ. Sci. 6:70. doi: 10.3389/fenvs.2018.00070
Soil Microbial Populations Shift as
Processes Protecting Organic Matter
Change During Podzolization
Marie-Liesse Vermeire1,2*, Jean-Thomas Cornélis3, Eric Van Ranst4, Steeve Bonneville5,
Sebastian Doetterl6,7and Bruno Delvaux1
1Soil Science, Earth and Life Institute, Université Catholique de Louvain, Louvain-La-Neuve, Belgium,2Department of
Biological Sciences, Faculty of Sciences, University of Cape Town, Cape Town, South Africa,3TERRA Teaching and
Research Centre, Gembloux Agro-Bio Tech, University of Liege, Gembloux, Belgium,4Department of Geology (WE13),
Faculty of Sciences, Ghent University, Ghent, Belgium,5Biogeochemistry and Earth System Modelling, Department of
Geosciences, Environment and Society, Université Libre de Bruxelles, Bruxelles, Belgium,6Soil and Water Resources
Research, Institute of Geography, Universität Augsburg, Augsburg, Germany,7Isotope Bioscience Laboratory ISOFYS,
Ghent University, Ghent, Belgium
In the upper part of the solum of mineral soils, soil organic and mineral constituents co-evolve through pedogenesis, that in turn impacts the transformation and stabilization of soil organic matter (SOM). Here, we assess the reciprocal interactions between soil minerals, SOM and the broad composition of microbial populations in a 530-year chronosequence of podzolic soils. Five pedons, derived from beach sand, are studied. From young to old soils, net acidification parallels mineral dissolution and the formation of eluvial and illuvial horizons. Organo-mineral associations (OMA) accumulate in the illuvial B horizon of the older soils (330–530 years). Apart from contributing to SOM stabilization and protection, organo-mineral compounds progressively fill up interparticle voids. The subsequent loss of porosity leads to horizon induration, decrease of hydraulic conductivity, which promote redoximorphic processes. While recalcitrant SOM is preserved in the topsoil of the old soils, the largest quantity of protected SOM occurs in the indurated, temporalily waterlogged B horizons, through both the OMA accumulation and inhibition of microbial decomposition. SOM protection is thus both time- and horizon-specific. The microbiota also evolve along the chronosequence. Fungi dominate in all horizons of the younger soils and in the topsoil of the older soils, while bacteria prevail in the cemented B horizons of older soils. This shift in microbial community composition is due to the interdependent co-evolution of SOM and minerals during pedogenesis. Our results call for considering the microenvironment and parameters inherent to decomposer microorganisms to understand SOM protection processes in soils.
Keywords: organic matter, microorganisms, amino sugars, carbon fractionation, micromorphology, SOM protection mechanisms, podzol, chronosequence
INTRODUCTION
The fate of SOM involves the decomposition of macromolecules into small oxidized and reactive molecules that can interact with the pedogenic products of mineral weathering, and influence their formation (Cotrufo et al., 2013; Basile-Doelsch et al., 2015; Lehmann and Kleber, 2015). Soil microorganisms accomplish 85–90% of SOM processing (Lavelle et al., 1993) and microbial biomass contributes to about 80% of SOM (Simpson et al., 2007; Grandy and Neff, 2008; Liang and Balser, 2011; Schmidt et al., 2011; Miltner et al., 2012). During the initial stages of SOM decomposition, some organic compounds are selectively preserved because of intrinsic molecular-level properties that limit their biodegradation (“recalcitrant” compounds). This represents a short-to-medium term C stabilization process— i.e., years or decades—(Kögel-Knabner et al., 2008a; Marschner et al., 2008; Schmidt et al., 2011). In later stages of SOM decomposition, the microbial biomass and byproducts bind to reactive, mineral clay-sized surfaces (Kögel-Knabner et al., 2008b; Kleber et al., 2015). The resulting OMA and soil micro-aggregates are responsible for the long-term persistence of SOM—i.e., decades to millennia—(Sollins et al., 1996; Baldock and Skjemstad, 2000; von Lützow et al., 2006; Kögel-Knabner et al., 2008b; Kleber et al., 2015).
In soils, microorganisms live in pore spaces. Therein, water content, pore-size distribution and pore inter-connectivity determine to a large extent the chemical conditions. They thus constrain the abundance and activity of microbial habitats (Tisdall and Oades, 1982; Hassink et al., 1993; Chenu and Stotzky, 2002; Six et al., 2004; Totsche et al., 2010; Kuzyakov and Blagodatskaya, 2015). SOM present in pore spaces that are either physically inaccessible or chemically not favorable for microorganisms is per se protected from microbial biodegradation (Hassink et al., 1993; Chenu and Stotzky, 2002; Totsche et al., 2010; Kuzyakov and Blagodatskaya, 2015). In addition, once accessible to microorganisms, SOM can be degraded only if (i) energy costs of enzyme production are paid back by the energy liberated by decomposition reactions, and (ii) microorganisms do not lack other essential nutrients (Neff et al., 2002; Ekschmitt et al., 2005, 2008; Manzoni and Porporato, 2009; Schmidt et al., 2011; Baldock and Broos, 2012).
Understanding complex interactions between OMA and microbial activity thus requires a process-based approach. This study is aimed at (i) assessing the mineralogical changes induced by pedogenesis and the resulting effects on SOM protection, and (ii) relating them with the evolution in microbial community structure.
Soil processes involved in podzolization generate soil horizons characterized by distinct properties in terms of SOM protection: (i) SOM degradation and intense weathering in the surface horizon; (ii) eluviation with percolating water of dissolved organic matter (DOM) complexed with Al and Fe, which will precipitate in soil horizons beneath; (iii) resulting in the formation of secondary mineral phases and OMA accumulation in illuvial horizons. We thus selected a Cambisol-Podzol chronosequence, as it provides an ideal framework to study the mineralogical, physico-chemical and microbial shifts during
soil formation. All horizons of this soil chronosequence were analyzed for their microstructure, pore space organization and their in situ organo-mineral associations (OMA). Using chemical extractions, we further characterized those soils for their content in secondary mineral phases and SOM fractions. With respect to SOM, we distinguished three operationally-defined fractions: (1) “oxidizable” C—C oxidized by NaOCl; (2) “mineral-protected” C—C released after dissolution of the minerals by hydrofluoric acid (HF); and (3) “recalcitrant” C—C resistant to both oxidation and HF treatment (Kleber et al., 2005; Mikutta et al., 2005b, 2006; Siregar et al., 2005; von Lützow et al., 2007; Zimmermann et al., 2007; Torn et al., 2009). The microbial populations were characterized by amino-sugar (AS) extractions. AS content provides an estimate of the amount of living and dead microorganisms in soil samples, and is thus a useful biomarker for investigating microbial contribution to SOM (Zhang and Amelung, 1996; Amelung et al., 2001; Glaser et al., 2004; Bodé et al., 2009, 2013). AS occur in living cells, but persist after cell lysis. About 90% of AS is present in microbial residues (Liang et al., 2008; Pronk et al., 2015). In soils, AS are mostly made of glucosamine (Glu), galactosamine (Gal) and muramic acid (Mur) (Bodé et al., 2013). Cell wall of bacteria is made of equal amounts of Mur and Glu while fungal cell walls contain only chitin, a polymer of Glu (Bodé et al., 2009, 2013). Consequently, the Glu:Mur ratio is used as an indicator of the relative contribution of fungi and bacteria to SOM in soil samples (Amelung et al., 2001; Liang et al., 2007). The Glu:Mur ratio of bacteria ranges between <2 and 8 (Amelung et al., 2001), and was estimated around 271 for fungi (Glaser et al., 2004). We complemented this characterization work by performing incubations to measure the potential of SOM to be degraded by microbial heterotrophic activity.
MATERIALS AND METHODS
Study Site
The podzolic chronosequence is located near Cox Bay on the west coast of Vancouver Island, British Columbia (latitude 49◦
6′
N, longitude 125◦ 52′
W). The sequence was developed under a temperate rain forest and previously described (Cornelis et al., 2014; Vermeire et al., 2016). Mean annual rainfall and temperature amount to 3,200 mm and 8.9◦C, respectively. The age of the deposits ranges from 0 to 530 years (Vermeire et al., 2016). The parent material is the Cox Bay beach sand, exhibiting a uniform sequence of deposits emerging at an annual rate of 0.26 m (Singleton and Lavkulich, 1987). The primary minerals are quartz, sodic plagioclase, amphibole (hornblende), pyroxene (augite), kaolinite, mica (illite) and chlorite (Cornelis et al., 2014). Quartz is by far the dominant mineral. A progressive deepening and differentiation of genetic horizons is observed along the chronosequence (Cornelis et al., 2014).
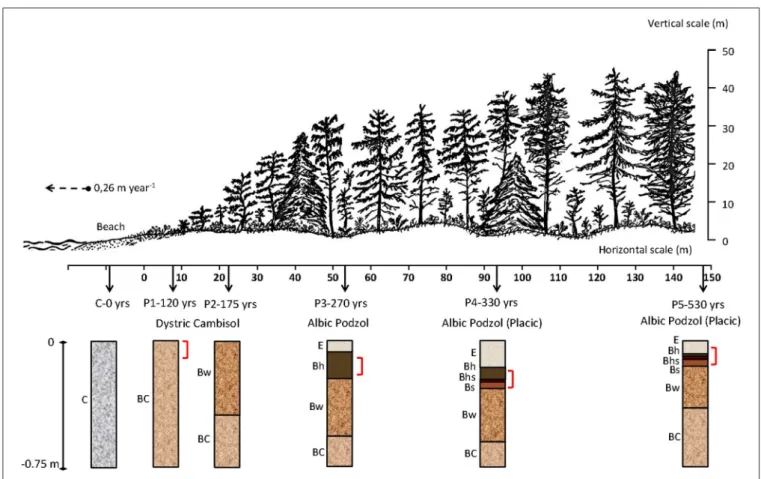
Vegetation progressively develops with increasing soil age along the sequence from shrubs and trees of Sitka spruce (the dominant tree species) to increasing presence of Douglas fir, Hemlock, Red cedar, Salal and Western sword fern. Five pedons (P1–120 years, P2–175 years, P3–270 years, P4–330 years, and P5–530 years) were selected along a transect (0-147 m length)
perpendicular to the present shoreline (Figure 1). The thickness of the Oh horizon increased with age, from 6 and 7 cm thick in P1–120 years and P2–170 years locations, to 12 cm in P3– 270 years, and 26 cm in P4–330 years. According to the WRB system (IUSS Working Group, 2015), the pedons key out as Dystric Cambisol at the youngest sites (P1–120 years and P2– 175 years), Albic Podzol at the intermediate site (P3–260 years) and Albic Podzols (Placic) at the oldest sites (P4–330 years and P5–530 years). The Albic Podzols (Placic) P4 and P5 are characterized by the following sequence of soil horizons from surface to depth (Cornelis et al., 2014): an eluvial albic E horizon, strongly weathered; an illuvial spodic Bh horizon (enriched in OM); a Bhs horizon, enriched in Fe oxides and OM; a Bs horizon, enriched in short-range-order (SRO) aluminosilicates and Fe oxyhydroxides; a weathered Bw horizon; and a poorly structured BC horizon (Figure 1).
Soil Sampling
Bulk samples were collected in each horizon of each pedon. In addition, selected undisturbed samples were collected using Kubiëna tins (i.e., square metal boxes, usually 8 × 6 × 4 cm in size with two loose covers), in order to conduct micromorphological analysis. In each soil pit, the Kubiëna boxes were inserted into the various horizons and the sample was cut out from
the soil profile. This procedure allowed to collect soils without disturbing the local 3D structure. Boxes were retrieved between (1) 0–10 cm depth in the P1 BC1 horizon, (2) 10–20 cm in the P3 Bh horizon, (3) 13–22 cm in the P4 Bh, Bhs and Bs horizons, (4) at 4–13 cm in the P5 E, Bh, Bhs, and Bs horizons. These undisturbed samples were oven-dried at 50–60◦
C, and subsequently impregnated under vacuum with a cold-setting polyester resin (Benyarku and Stoops, 2005). Covered small thin sections (2.4 × 4.8 cm) were prepared. The thin sections were studied with a polarizing microscope and described using the terminology ofStoops (2003).
Soil Physico-Chemical Characterization
Bulk samples were air-dried and passed through a 2 mm-sieve according to NF ISO 11464 (AFNOR, 2006) before analysis. Soil pH was measured in 5 g:25 ml soil:water suspension (Page et al., 1982). Cation exchange capacity (CEC) and the content of exchangeable cations were determined according toPage et al. (1982), in ammonium acetate 1 M at pH 7 and measured by inductively coupled plasma/atomic emission spectrometry (ICP-AES). Soil particle-size analysis was achieved by quantitative recovery of clay (<2 µm), silt (2–50 µm) and sand (>50 µm) fractions after sonication and dispersion with Na+
-saturated resins without any previous H2O2oxidation of OM, as described
FIGURE 1 | Cross section of the Cox Bay chronosequence, showing site locations, soil horizons, depending on their respective age of soil formation: C-0 years, P1–120 years, P2–175 years, P3–270 years, P4–330 years, and P5–530 years and Kubiëna boxes location (shown in brackets) (modified fromVermeire et al., 2016).
inHenriet et al. (2008). Total element contents (Si, Al, Fe, Ca, K, Mg, Na, Ba, Mn, P, Sr, Zr, Ti) were measured by ICP–AES after fusion in Li-metaborate + Li-tetraborate at 1,000◦C of crushed (< 250 µm) subsample (Chao and Sanzolone, 1992). Soil weathering stage was assessed by computing the Total Reserve in Bases (TRB) as the sum of the total contents of major alkaline (K, Na) and alkaline-earth (Ca, Mg) cations (Herbillon, 1986).
Secondary Si-, Fe-, and Al-bearing phases were studied using selective chemical extractions: sodium pyrophosphate (p) (Bascomb, 1968), dark oxalate (o) (Blakemore et al., 1987), and dithionite-citrate-bicarbonate (DCB, d) (Mehra and Jackson, 1960). Si, Fe, and Al concentrations were measured in “p,” “o,” and “d” extracts by ICP–AES. Alpand Fepare attributed to Al and Fe in organo-metallic complexes. However, this alkaline solution could also extract Al from SRO Al-hydroxide, and Al and Si from SRO aluminosilicates (Schuppli et al., 1983; Kaiser and Zech, 1996). Sio, Alo, and Feocan be attributed to Si, Al, and Fe SRO minerals such as allophanic substances, SRO Al and Fe oxides. Dark oxalate may, however, dissolve lepidocrocite (Poulton and Canfield, 2005) as well as organo-metallic compounds. DCB-extractable Fedis attributed to “free iron,” i.e., Fe occurring in (i) in organo-metallic complexes, (ii) SRO oxides, (iii) crystalline Fe oxides such as hematite and goethite. Thus, “crystalline” Fe is estimated by the difference Fed-Feo. The Fed/Fetratio (Fet= total iron content) evaluates the relative proportion of free iron in soil and thus reflects soil weathering stage and the evolution of the mineral phases during soil development. However, these assessments must be treated with caution due to partial dissolving side effects of soil minerals.
SOM Fractionation
Total organic carbon and nitrogen concentration (CT, NT) were determined on powdered air-dried soil subsamples by dry combustion with a FLASH 2000 Organic Elemental Analyzer (ThermoFisher Scientific). The distribution of C and N was estimated following the chemical separation procedure of
Mikutta et al. (2006). In brief, 3 g of air-dried sample were treated three times with 30 mL of 6 wt% NaOCl adjusted to pH 8.0 for a duration of 6 h at 25◦C. Samples were further washed twice with 30 mL 1 M NaCl and with deionized water until the solution was chloride free (AgNO3testing). The samples were then dried at 60◦
C and homogenized before C and N measurement on powdered soil subsamples by dry combustion with a FLASH 2000 Organic Elemental Analyzer (ThermoFisher Scientific). The amounts of C and N left after NaOCl treatment are quantified as stable C and N (CS and NS). The “oxidizable” C and N (CO and NO) contents were calculated by subtracting the CS and NScontents from the total C and N content (CTand NT), respectively.
CO=CT−CS (1)
Within the stable, NaOCl-treated fraction, we distinguished mineral-protected (CMPand NMP) from the recalcitrant (CRand NR) C and N. HF dissolves mineral moieties of OMA, leaving the NaOCl/HF-treated fraction defined as chemically resistant or recalcitrant (Eusterhues et al., 2003; Mikutta et al., 2006).
“Recalcitrant” organic substances are supposed to exhibit specific molecular properties that can diminish their degradation (e.g., black C and aliphatic compounds such as alkanes and n-fatty acids). Although the dominant controls of SOM stability are environmental and biological (von Lützow et al., 2006; Schmidt et al., 2011), molecular structure of SOM influences its decomposition rate by determining the complexity of the decomposition operation (Kleber, 2010; Barré et al., 2016). Briefly, 2.25 g of NaOCl-treated dry samples were transferred into pre-weighed centrifuge tubes, shaken four times with 15 ml 10% HF for a duration of 2 h and then washed five times with 15 ml deionized water. Between each shaking step, the samples were centrifuged and the supernatant discarded. The solid residues were dried at 60◦C, crushed and analyzed for C
R and NR on 10 mg subsamples by dry combustion with a FLASH 2000 Organic Elemental Analyzer (ThermoFisher Scientific). The CMP and NMPcontents were derived from the difference between CS and NSand CRand NRcontents, respectively.
CMP =CS−CR (2)
At each step of the sequential extraction, the initial and residual sample weights were recorded, but the respective C and N contents were expressed on a bulk soil basis (g kg−1soil). The C and N contents in the fractions were measured. The values of the SOM C/N ratio were calculated within each fraction (CO/NO, CR/NR, CMP/NMP).
Specific Analysis of Amino-Sugars
AS extraction and analysis were carried out according toBodé et al. (2009, 2013). Yet, the procedure was slightly adapted: instead of using the cation-exchange resin, we used KOH to precipitate Fe and Al impurities. In short, air-dried soil samples (quantity corresponding to 0.3 mg of N) were hydrolyzed and further dried under vacuum in a Rotavap device. The residues were then re-dissolved in MilliQ water and the pH adjusted to 6.6–6.8 with a KOH solution in order to precipitate impurities (mainly Fe and Al). The solutions were then centrifuged and the AS-containing supernatant was freeze dried. The samples were re-dissolved in methanol and centrifuged, and the supernatant (containing the AS fraction) was then transferred into a 10 ml glass tube. The sample was again dried by volatilizing methanol under a stream of nitrogen gas and then freeze dried. After that, the AS were transformed into aldononitrile derivatives and re-dissolved in ethylacetate/hexane. The concentration of basic AS (glucosamine, galactosamine and muramic acid) in the analytical aliquot was determined by liquid chromatography using the method described byBodé et al. (2009). The liquid chromatographic separation was performed using an LC pump (Surveyor MS-Pump Plus, Thermo Scientific, Bremen, Germany) mounted with a PA20 CarboPac analytical anion-exchange column (3–150 mm, 6.5 µm) and a PA20 guard column (Thermo Scientific, Bremen, Germany).
Soil Respiration Measurements
After being saturated with deionized water, bulk soil samples from each horizon were equilibrated for 15 days in a pressure
plate extractor, to reach a pF of 2.4 (0.25 bar). A quantity equivalent to 40 g of dry soil was transferred into hermetic incubation flasks, containing a 30-mL vial filled with 25 ml of 0.5 M NaOH solution. The CO2 trapped in NaOH was determined by measuring the changes in electrical conductivity of the solution (Rodella and Saboya, 1999). The incubations were conducted in triplicates per soil horizon and lasted 144 days in a temperature-controlled dark room at 20◦C. Incubation flasks without soil samples served as controls. The conductivity within the NaOH vials was determined every 3–7 days. Soil-derived CO2 was calculated by subtracting the measured values in the soil-containing flasks with values in the blanks measured at the same time (due to atmospheric CO2). Oxygen was regularly supplied to the incubation by opening the flasks at each measurement time step. The soil samples were kept moist at field capacity by controlling the weight of the incubation flasks and adding deionized water to compensate for the weight loss.
RESULTS
Soil Physico-Chemical Properties
The pHH2Ovalue of the freshly deposited Cox beach sand is 7.7. In P1–120 years and P2–175 years soil pedons, the pHH2Ovalue ranges from 5.8 to 5.9. In P3–270, P4–330, and P5–530 years, from the deepest BC to the surface E horizon, the pHH2Ovalue decreases from 5.4 to 4.6 in P3, from 5.3 to 4.9 in P4, and from 5.1 to 4.4. in P5 (Table 1).
The TRB value of the freshly deposited Cox beach sand is 534 cmolckg−1. Considering the five pedons (Table 1), the TRB of the deepest BC horizon amounts to (cmolckg−1) 490 (P1), 368 (P2), 361 (P3), 352 (P4), and 357 in P5. In the surface horizons (P1-BC1, P2-Bw and E in P3, P4, P5), TRB also decreases along the sequence from (cmolckg−1) 439 (P1) to 430 (P2), 311 (P3), 236 (P4), and 169 (P5).
In P1, P2, and P3, the oxalate extractable contents (in g kg−1) are low: Feo< 2.2, Alo< 1.4 and Sio< 0.17 (Table 1). In contrast, Feocontents are much larger in the Bhs horizon of P4, with 11.6 g kg−1, and P5, with 26.3 g kg−1. Al
ocontents are also higher in P4 and P5, compared to the three younger profiles, with a maximum of 9.2 g kg−1in P4-Bhs and 12.6 g kg−1in P5-Bs. Si
ois maximal in P4 and P5-Bs horizons, where it yields 3.5 g kg−1and 4.5 g kg−1 respectively. Fedcontents (g kg−1) are particularly high in P4-Bhs (21.6 g kg−1) and in P5-Bhs (26.1 g kg−1). Pyrophosphate extractable Al and Fe follow the same trends with the largest contents in the Bhs horizons of P4 and P5 (6.7 and 4.1 g kg−1 Alpin P4 and P5 Bhs respectively, and 10.0 and 12.4 g kg−1Fep in P4 and P5 Bhs respectively).
In P1 and P2, CT content does not vary significantly with depth and is ∼ 5.0 g kg−1(Table 2). In P3, Bh horizon exhibits a CT content reaching 17.8 g kg−1. In P4 and P5, CT further increases in Bh, Bhs and Bs, to reach 25.1 and 43.4 g kg−1 in P4- and P5-Bhs, respectively (Table 2). In P1 and P2, CTcontent is small and mainly consisting of oxidizable C (∼70% of CT, Figure 2). In P3, this oxidizable C fraction is also the largest in all horizons, for example 78% of CTin the Bh. In P4 and P5 horizons, the oxidizable C still represents an important proportion of CT, excepted in P4-Bh (5%) and P5-Bs (7%). CMPcontent amounts
to 11.3, 13.2, and 3.7 g kg−1soil in P4 Bh, Bhs and Bs respectively and thus accounts for 78, 53, and 28% of the CT. In P5, CMP is 4.3, 15.9 and 7.7 g kg−1 in Bh, Bhs and Bs respectively and thus accounts for 14, 37 and 74% of CT(Table 2 and Figure 2). Recalcitrant C compounds accumulate in the E horizons. CR represents 30 and 29% of CTin P3 and P4 E horizons (4.4 and 2.4 g CRkg−1soil, respectively) and accounts for 69% of CTin P5 E (10.2 g CRkg−1soil, Table 2, Figure 2). In the Bw and BC horizons of all soil profiles, recalcitrant C accounts for ∼1 g kg−1 soil; probably due to fire-induced pyrogenic organic matter and “black carbon” present in the sedimentary parent material, as observed in the P1 BC1 thin section.
Soil Respiration
The cumulative CO2 emission increased linearly over time during the whole experiment (Figure S1 in Supplementary Material). The respiration rates were thus computed from the slope of the linear regression between cumulated emitted CO2 and time (all R² values were above 0.95). We then normalized the respiration rates to the C content in order to derive the mg CO2-C emitted per g C per day, which indicates the susceptibility of SOM to be degraded (hereafter called “biodegradability,” Table 2). The lowest respiration rates were observed in Bw and BC horizons (∼0.13 mg CO2-C 100 gsoil−1day−1), in which C is below 10 g kg−1 soil, while the highest respiration rates were observed in E and B horizons (∼0.23 mg CO2-C 100 gsoil −1 day−1). The inverse trend was observed for the SOM biodegradability. The lowest biodegradability was measured in the Bh, Bhs and Bs horizons (∼0.11 mg CO2-C g C−1day−1), the highest in the Bw-BC horizons (∼0.30 mg CO2-C g C−1day−1) and intermediate biodegradability was measured in E horizons (∼0.21 mg CO2-C g C−1day−1).
Soil Micromorphological Properties
The P1–120 years BC1 horizon presents a coarse monic (only fabric units larger than a given size limit and associated interstitial pores are present) coarse/fine (c/f) -related distribution pattern (Figure 3). Root residues, excrements and charcoal fragments are also observed. The P3–270 years Bh horizon has a similar microstructure. The organic fine material in this horizon results mainly from in situ transformation of plant remains and corresponds to polymorphic material as described by
De Coninck et al. (1974). Polymorphic material consists of porous aggregates composed of fine organic material, mineral grains and coarse organic elements with a recognizable cell or tissue structure. Roots are mechanically and biochemically fragmented and transformed by soil mesofauna and microbial activity. These transformations result in multiple forms of degraded plant material, including excrements (De Coninck and Righi, 1969; De Coninck et al., 1974; Buurman and Jongmans, 2005). In the spodic horizons of P4–330 years and P5–530 years, the micromorphological features differ from those in the three younger profiles, mainly because of the accumulation of illuvial organic fine material resulting in a mixture of gefuric (bridges of finer material exist between coarser grains), chitonic (finer material coats the coarser grains) and enaulic (the finer material occurs as small aggregates in
TABLE 1 | Soil physico-chemical properties: pHwater, Total Reserve in Bases (TRB), pyrophosphate (p), oxalate (o), DCB (d)-extractable Al, Fe, and Si (values are given ± one standard deviation).
Profile Age Horizon Depth pHH2O TRB Alp Alo Fep Feo Fed Sio
cm cmolckg−1 g kg−1 P1 120 BC 0–35 5.9 439 0.50 ± 0.03 0.70 ± 0.04 0.54 ± 0.08 1.64 ± 0.15 1.82 ± 0.08 0.12 ± 0.01 P1 120 BC 35–60 5.9 490 0.53 ± 0.03 0.76 ± 0.05 0.49 ± 0.07 1.79 ± 0.16 1.9 ± 0.08 0.13 ± 0.01 P2 175 Bw 3–44 5.8 430 0.68 ± 0.04 0.90 ± 0.06 0.66 ± 0.09 1.73 ± 0.16 2.04 ± 0.09 0.09 ± 0.01 P2 175 BC 44–75 5.9 368 0.42 ± 0.02 0.65 ± 0.04 0.3 ± 0.04 1.04 ± 0.09 1.39 ± 0.06 0.13 ± 0.01 P3 270 E 0–7 4.6 311 0.43 ± 0.03 0.59 ± 0.04 0.87 ± 0.12 1.22 ± 0.11 2.54 ± 0.11 0.12 ± 0.01 P3 270 Bh 7–23 5.1 311 0.93 ± 0.05 1.25 ± 0.08 1.42 ± 0.20 2.17 ± 0.20 2.65 ± 0.11 0.16 ± 0.01 P3 270 Bw 23–57 5.3 299 0.81 ± 0.05 1.10 ± 0.07 1.17 ± 0.17 2.06 ± 0.19 2.38 ± 0.10 0.17 ± 0.01 P3 270 BC >57 5.4 361 1.05 ± 0.06 1.39 ± 0.09 0.85 ± 0.12 1.7 ± 0.15 2.19 ± 0.09 0.16 ± 0.01 P4 330 E 0–10 4.9 236 1.35 ± 0.08 1.43 ± 0.09 0.75 ± 0.10 1.12 ± 0.10 1.05 ± 0.04 0.22 ± 0.02 P4 330 Bh 10–17 5.5 322 6.02 ± 0.35 8.80 ± 0.55 1.33 ± 0.19 1.71 ± 0.16 3.27 ± 0.14 1.58 ± 0.11 P4 330 Bhs 17–17.5 5.4 329 6.70 ± 0.39 9.16 ± 0.57 9.96 ± 1.42 11.64 ± 1.06 21.63 ± 0.91 1.82 ± 0.13 P4 330 Bs 17.5–23 5.3 378 1.74 ± 0.11 9.11 ± 0.56 0.29 ± 0.04 3.5 ± 0.32 3.69 ± 0.15 3.48 ± 0.25 P4 330 Bw 23–63 5.4 349 1.11 ± 0.06 6.97 ± 0.43 0.09 ± 0.01 1.98 ± 0.18 2.41 ± 0.10 2.79 ± 0.20 P4 330 BC 63–113 5.3 352 0.79 ± 0.05 4.49 ± 0.28 0.05 ± 0.01 0.89 ± 0.08 1.28 ± 0.05 1.88 ± 0.14 P5 530 E 0–8 4.5 169 0.65 ± 0.04 0.68 ± 0.042 0.47 ± 0.07 0.64 ± 0.06 1.59 ± 0.07 0.06 ± 0.004 P5 530 Bh 8–9.5 4.5 241 2.98 ± 0.17 3.19 ± 0.20 3.29 ± 0.47 4.52 ± 0.41 6.74 ± 0.28 0.4 ± 0.03 P5 530 Bhs 9.5–10 4.5 264 4.11 ± 0.24 6.22 ± 0.39 12.44 ± 1.78 26.34 ± 2.40 26.11 ± 1.10 0.84 ± 0.06 P5 530 Bs 10–15 4.8 297 2.43 ± 0.14 12.62 ± 0.78 0.85 ± 0.12 6.93 ± 0.63 9.61 ± 0.40 4.56 ± 0.33 P5 530 Bw 15–40 5.0 352 0.91 ± 0.05 7.96 ± 0.49 0.03 ± 0.004 1.4 ± 0.13 1.77 ± 0.07 3.54 ± 0.25 P5 530 BC 40–60 5.1 357 0.54 ± 0.03 3.9 ± 0.24 0.02 ± 0.003 0.65 ± 0.06 1.18 ± 0.05 1.69 ± 0.12
the spaces between the coarser grains) c/f-related distribution patterns (Stoops, 2003). This homogeneous, colloidal-sized material with a typical cracking pattern and without coarse organic elements corresponds to monomorphic organic matter (De Coninck et al., 1974; De Coninck, 1980). The cracks were interpreted as desiccation features of strongly hydrated OM gels (Buurman and Jongmans, 2005). The cemented (in the field) spodic (Bhs) horizons show all pores filled with monomorphic material, resulting in a porphyric c/f related distribution pattern. This cementation or massive consistence lead to periodic water stagnation in the field, alternating phases of desiccation and waterlogging, and is common in poorly drained Podzols (Buurman and Jongmans, 2005; Legros, 2007).
Evolution of the Microbial Populations
Except in P4, AS content in all pedons is generally the largest in the surface horizon and decreases at depth (Table 3). The lowest AS concentrations were measured in P2–175 years and P4–330 years (maximum value of the pedon: 54.1 and 125.8 µg gsoil −1 in P2 and P4 respectively), the largest in P3–270 years and P5–530 years (maximum value: 332.4 and 490.6 µg gsoil −1 in P3 and P5, respectively), while values in P1–120 years were intermediate (maximum value of the pedon: 172.4 µg gsoil −1). In P1, P2, and P3, the Glu:Mur ratio is above 40 in the whole profile, and reaches 98 in P3 Bh, indicating a fungal-dominated microbiota (Table 3). A Glu:Mur ratio of 89.0 was measured in beech litter (Amelung et al., 2001) and ascribed to
fungal-derived Glu. In P4 and P5, the composition of microbiota differs between the topmost E and the underlying horizons. In E horizons the population is fungal-dominated (Glu:Mur = 54.9 in P4-E and 62.2 in P5-E) while deeper horizons have low Glu:Mur ratios (between 13.5 and 25.6 in P4; between 13.9 and 29.2 in P5) reflecting a bacteria-dominated microbiota. The Glu:Mur ratio in Bh, Bhs, Bs, Bw, and BC horizons of P4 and P5 is in the range of the values observed in mineral soils by
Amelung et al. (2002) (∼18–26) and by Glaser et al. (2004)
(∼15–24).
DISCUSSION
Acidification and Accumulation of
Secondary Mineral Phases
With increasing soil age, forest development along the chronosequence induces an increasing SOM input from the litter, favored by humid (excess of precipitation over evapotranspiration) climatic conditions, which promote leaching of solutes produced by mineral weathering. The concomitant decrease of pH and TRB values leads to a net acidification, i.e., a decrease of acid-neutralizing capacity (ANC) (van Breemen et al., 1983; Cornu et al., 2009). The litter of Sitka spruce, which is the dominant tree species, is known to produce strong organic acids promoting soil acidification (Lindeburg et al., 2013). The processes of mineral weathering, Al/Fe complexation and mobilization as well as leaching of alkaline and alkaline-earth cations rapidly
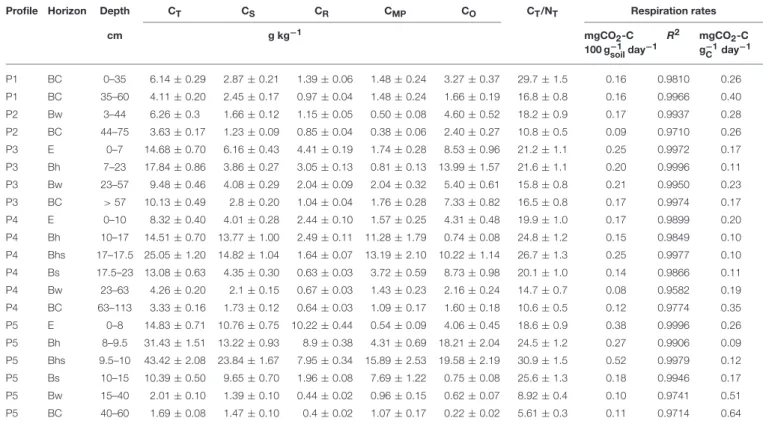
TABLE 2 | C fractions: total (CT), Stable (CS), recalcitrant (CR), mineral-protected (CMP), oxidizable (CO), bulk soil SOM CT/NTratio (values are given ± one standard deviation); soil respiration rates (slope of the cumulative CO2emission with time, calculated by linear regression, and associated R²-values), and soil respiration rates normalized by the total SOC content (=SOM biodegradability).
Profile Horizon Depth CT CS CR CMP CO CT/NT Respiration rates
cm g kg−1 mgCO2-C 100 g−1 soilday−1 R2 mgCO2-C g−1 C day−1 P1 BC 0–35 6.14 ± 0.29 2.87 ± 0.21 1.39 ± 0.06 1.48 ± 0.24 3.27 ± 0.37 29.7 ± 1.5 0.16 0.9810 0.26 P1 BC 35–60 4.11 ± 0.20 2.45 ± 0.17 0.97 ± 0.04 1.48 ± 0.24 1.66 ± 0.19 16.8 ± 0.8 0.16 0.9966 0.40 P2 Bw 3–44 6.26 ± 0.3 1.66 ± 0.12 1.15 ± 0.05 0.50 ± 0.08 4.60 ± 0.52 18.2 ± 0.9 0.17 0.9937 0.28 P2 BC 44–75 3.63 ± 0.17 1.23 ± 0.09 0.85 ± 0.04 0.38 ± 0.06 2.40 ± 0.27 10.8 ± 0.5 0.09 0.9710 0.26 P3 E 0–7 14.68 ± 0.70 6.16 ± 0.43 4.41 ± 0.19 1.74 ± 0.28 8.53 ± 0.96 21.2 ± 1.1 0.25 0.9972 0.17 P3 Bh 7–23 17.84 ± 0.86 3.86 ± 0.27 3.05 ± 0.13 0.81 ± 0.13 13.99 ± 1.57 21.6 ± 1.1 0.20 0.9996 0.11 P3 Bw 23–57 9.48 ± 0.46 4.08 ± 0.29 2.04 ± 0.09 2.04 ± 0.32 5.40 ± 0.61 15.8 ± 0.8 0.21 0.9950 0.23 P3 BC > 57 10.13 ± 0.49 2.8 ± 0.20 1.04 ± 0.04 1.76 ± 0.28 7.33 ± 0.82 16.5 ± 0.8 0.17 0.9974 0.17 P4 E 0–10 8.32 ± 0.40 4.01 ± 0.28 2.44 ± 0.10 1.57 ± 0.25 4.31 ± 0.48 19.9 ± 1.0 0.17 0.9899 0.20 P4 Bh 10–17 14.51 ± 0.70 13.77 ± 1.00 2.49 ± 0.11 11.28 ± 1.79 0.74 ± 0.08 24.8 ± 1.2 0.15 0.9849 0.10 P4 Bhs 17–17.5 25.05 ± 1.20 14.82 ± 1.04 1.64 ± 0.07 13.19 ± 2.10 10.22 ± 1.14 26.7 ± 1.3 0.25 0.9977 0.10 P4 Bs 17.5–23 13.08 ± 0.63 4.35 ± 0.30 0.63 ± 0.03 3.72 ± 0.59 8.73 ± 0.98 20.1 ± 1.0 0.14 0.9866 0.11 P4 Bw 23–63 4.26 ± 0.20 2.1 ± 0.15 0.67 ± 0.03 1.43 ± 0.23 2.16 ± 0.24 14.7 ± 0.7 0.08 0.9582 0.19 P4 BC 63–113 3.33 ± 0.16 1.73 ± 0.12 0.64 ± 0.03 1.09 ± 0.17 1.60 ± 0.18 10.6 ± 0.5 0.12 0.9774 0.35 P5 E 0–8 14.83 ± 0.71 10.76 ± 0.75 10.22 ± 0.44 0.54 ± 0.09 4.06 ± 0.45 18.6 ± 0.9 0.38 0.9996 0.26 P5 Bh 8–9.5 31.43 ± 1.51 13.22 ± 0.93 8.9 ± 0.38 4.31 ± 0.69 18.21 ± 2.04 24.5 ± 1.2 0.27 0.9906 0.09 P5 Bhs 9.5–10 43.42 ± 2.08 23.84 ± 1.67 7.95 ± 0.34 15.89 ± 2.53 19.58 ± 2.19 30.9 ± 1.5 0.52 0.9979 0.12 P5 Bs 10–15 10.39 ± 0.50 9.65 ± 0.70 1.96 ± 0.08 7.69 ± 1.22 0.75 ± 0.08 25.6 ± 1.3 0.18 0.9946 0.17 P5 Bw 15–40 2.01 ± 0.10 1.39 ± 0.10 0.44 ± 0.02 0.96 ± 0.15 0.62 ± 0.07 8.92 ± 0.4 0.10 0.9741 0.51 P5 BC 40–60 1.69 ± 0.08 1.47 ± 0.10 0.4 ± 0.02 1.07 ± 0.17 0.22 ± 0.02 5.61 ± 0.3 0.11 0.9714 0.64
occur, in less than 60 years, i.e., between P3–270 years and P4–330 years (Vermeire et al., 2016; Fekiacova et al., 2017). Such a timing for incipient podzolization is in agreement with several studies reviewed in Sauer et al. (2008), revealing the formation of a bleached E horizon after about 200–500 years.
The formation and transport of aqueous Al/Fe-OM complexes (i.e., “fulvate theory” from McKeague et al., 1978) has been generally accepted as the dominant process of Al/Fe-OM eluviation (Lundström et al., 2000) that initiate podzolization. Due to their large affinity for Fe and Al, the Fe/Al-OM complexes not only enhance mineral weathering (by decreasing the free Fe3+and Al3+, hence, favoring dissolution reactions), but also transport Al and Fe at depth (Lundström et al., 2000; van Hees et al., 2000; Kaiser and Kalbitz, 2012; Gangloff et al., 2014). In the chronosequence, the evidence for podzolization is clear: SOM accumulation is relatively large in the illuvial Bh of P3 and keeps increasing in P4 and P5 while Al- and Fe-rich phases occur in P4 and P5 (Tables 1, 2, Figure 2). The main Fe secondary phases in P4 and P5 illuvial horizons are linked to (i) Fep(presumably the Fe-SOM complexes), which is largest in P4-Bhs and P5-Bhs (10.0 and 12.4 g kg−1, 46 and 48% of Fe
d, respectively); (ii) SRO Fe oxide (i.e., Feo-Fep), which is the dominant Fe phase in P4-Bs (3.2 g kg−1, 87% of Fe
d) and P5 Bhs and Bs (13.9 and 6.1 g kg−1, 53 and 63% of Fe
d, respectively) and (iii) crystalline Fe oxide (Fed-Feo), which is largest in P4-Bhs (10.0 g kg−1, 47% of
Fed). The SRO Fe-rich secondary phase is probably ferrihydrite (Fe hydroxides) while crystalline Fe minerals are likely to be goethite. Both are known to be the most abundant Fe mineral phases in Podzols (Cornell and Schwertmann, 2003; Eusterhues et al., 2003, 2005). In parallel, the main Al secondary phase in P4 and P5 Bh and Bhs is bound to SOM (i.e., extracted in Alp), which represents 68, 73, 93, and 68% of Alo, in P4-Bh, -Bhs and P5-Bh, -Bhs respectively (6.0, 6.7, 3.0, and 4.1 g kg−1, respectively). In Bs horizons, the main Al secondary phase is a SRO aluminosilicate, likely an “imogolite type material” (ITM) (Farmer et al., 1980). The presence of ITM in P4 and P5 is supported by the several observations: (i) the ratio (Alo-Alp)/Sio is ∼ 2 (2.1 in P4 Bs and 2.2 in P5 Bs); (ii) the moderately acidic pH in P4 and P5 (pH > 4.5—Table 1) as ITM would readily dissolved for pH<4 (Gustafsson et al., 1995; Lundström et al., 1995; Mossin et al., 2002); (iii) the paucity of Al-SOM (Alp represents 19% of Alo, in P4 and P5 Bs) as high levels of those complexes would have hindered the formation of imogolite and proto-imogolite.
Changes in OM Distribution During Soil
Development
With increasing soil age, an illuvial Bh-accumulating SOM develops along the chronosequence (Table 2, Figure 2). As pedogenesis proceeds, the SOM composition also changes, as suggested by the evolution of the CT:NTratio (Table 2, Figure 4)
0 20 40 BC BC Cr Cmp CO 0 20 40 BW BC 0 20 40 E Bh BW BC 0 20 40 E Bh Bhs Bs Bw BC 0 20 40 E Bh Bhs Bs Bw BC 0 5 10 15 BC BC Al-SOM SRO-Al 0 5 10 15 BW BC 0 5 10 15 E Bh BW BC 0 5 10 15 E Bh Bhs Bs Bw BC 0 5 10 15 E Bh Bhs Bs Bw BC 0 10 20 30 BC BC Fe-SOM SRO-Fe Cr-Fe 0 10 20 30 BW BC 0 10 20 30 E Bh BW BC 0 10 20 30 E Bh Bhs Bs Bw BC 0 10 20 30 E Bh Bhs Bs Bw BC Fractions (g kg-1)
P1-120 yrs P2-175 yrs P3-270 yrs P4-330 yrs P5-530 yrs
A B C C fracons Al fracons Fe fracons
FIGURE 2 | (A) C fractions: recalcitrant C (CR, the non-extractable organic carbon after NaOCl and HF treatment), mineral-protected C [CMP, calculated by subtracting the CRfraction from the stable C fraction (CS, carbon left after NaOCl treatment)], oxidizable C [CO, calculated by subtracting Cs from the total C (CT)]. CR+CMP+CO=CT. (B) Al fractions: pyrophosphate-extractable Al (Al-SOM) and Al in short range ordered Al phases (SRO-Al = Alo-Alp). (C) Fe fractions: pyrophosphate-extractable Fe (Fe-SOM), Fe in short range ordered Fe phases (SRO-Fe = Feo-Fep), Fe in crystalline Fe phases (Cr-Fe = Fed-Feo).
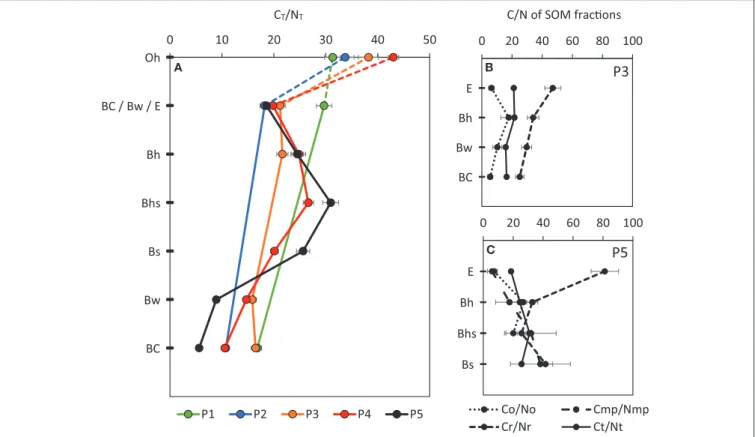
from P1 to P5. In P1, values of CT:NTratio for both the mineral BC surface and Oh horizons are roughly similar at 30 and 31, respectively. However, in older pedons, the value of the CT:NT ratio in the surface-mineral horizons (Bw in P2 and E in P3, P4 and P5) is lower (∼20) than in the Oh horizons (34, 38, 43, respectively in P2-, P3-, and P4-Oh). This decrease of CT:NTratio might be attributed to an increase of microbially-derived compounds (Schmidt et al., 2000; Kögel-Knabner et al., 2008b; Sollins et al., 2009; Rumpel and Kögel-Knabner, 2011; Miltner et al., 2012). Indeed, the CT:NT ratio of bacteria is around 5–8 and that of fungi around 5–30 (Wallander et al., 2003; Kleber et al., 2007). In the deeper illuvial horizons of P3–P5, a progressive increase of the CT:NT ratio is observed, from 22 in P3-Bh, to 27 in P4-Bhs and 31 in P5-Bhs. In Podzols, an increase of the C:N ratio in the Bh, Bhs and Bs horizons is frequently observed, and a C:N value > 25 in illuvial horizon is considered as a criterion for podzolization (Baize, 1993).
The composition of SOM fractions evolves along our chronosequence. Recalcitrant C compounds tend to build up in the E horizons from P3 to P5. CR (i.e., the recalcitrant C
fraction) represents 30, 29, and 69% of the total C in the E horizon of P3, P4 and P5 respectively (Figure 2) while in parallel, the other main contributing pool of C (i.e., oxidizable C) declines from 58% in P3 to 52% in P4, before reaching 27% of the total C in P5. In P3 and P5 (no data for P4), the low value of the CO:NO ratio (i.e., of the oxidizable C fraction) which is ∼6-7, suggests a large microbial contribution (Figure 4). In contrast, the high CR:NR ratio which reaches 47 in P3 and 81 in P5 (Figure 4) suggests an input of organic matter derived from vegetation, possibly from Sitka spruce roots which have a very high C:N, from 50 to 420 (Olajuyigbe et al., 2012). The larger fraction of amino-sugars-derived C (AS in mg.g−1 C— Table 3) in the E horizons compared to the illuvial B horizons also supports an important contribution of microbially-derived compounds to SOM. Buurman et al. (2005)observed similar patterns in a Podzol hydrosequence. In the E horizons of their Podzol, these authors observed that SOM was systematically dominated by (i) recalcitrant plant-derived aliphatic compounds (reflecting residual accumulation) and (ii) easily degradable bacterial products (in particular polysaccharide). In P4 and P5 illuvial Bh, Bhs and Bs horizons, the CMP fraction becomes
FIGURE 3 | Micromorphological observations from thin sections of kubiëna boxes taken in the P1–120 years BC1 horizon, P3–270 years Bh horizon, and P4–330 and P5–530 years Bh, Bhs and Bs horizons.
important (14–78% of CT – Figure 2). The values of the C:N ratio of the different fractions in those horizons are similar to each other and to the one of the bulk C:N (∼20–30, Figure 4).
In contrast to the E horizons in P4 and P5 which are very sandy and exhibit high porosity, the deeper B horizons appear to accumulate large amounts of SOM and secondary Fe/Al phases that induce a clogging of pore space, as revealed by micromorphological features, i.e., the porphyric c/f-related distribution pattern (Figure 3). The monomorphic fine organic material filling all pores in the cemented spodic horizons provides evidence of periodic water saturation, and thus anoxic periods. As such, P4 and P5 can be qualified as “hydromorphic” Podzols, in which drainage properties impact OM dynamics and further degradation. According toBuurman and Jongmans (2005), water saturation in hydromorphic Podzols leads to (i) the inaccessibility of the cemented illuvial B horizons for fungi and plant roots, making illuvial DOM the major contributor to SOM accumulation, (ii) the inhibition or slowing of microbial degradation reactions, leading to
a low contribution of microbially derived-compounds to SOM.
Microbial Community Shifts With SOM
Protection Processes
Early Stage of Soil Development: Limited SOM Stabilization—Fungi-Dominated Population
In P1–120 years and P2–175 years, primary minerals were not weathered extensively, as is evident from the relatively high TRB values (Table 1). Therefore, the content of secondary SRO minerals is low, the potential to form OMA limited and the amount of CMP minimal (Figure 2). The main C fraction in these profiles is oxidizable C (between 40 and 73% of CT), and the degradability of C compounds is relatively large (0.26–0.4 mg CO2-C g−C1 day−1, Table 2). The micromorphological fabric of quartz grains with root residues and excrements in the associated interstitial pores (coarse monic c/f-related distribution pattern in the P1 and P2; Figure 3) indicates a microenvironment that does not constrain biological activity; so SOM can continue to decompose.
TABLE 3 | Amino-sugars: Glucosamine (Glu), Galactosamine (Gal), Muramic acids (Mur) content, in µgAS g−1soil, total Amino-sugar content (µg AS g−1soiland mg AS g−1C ) and Glu:Mur ratio (values are given ± one standard deviation).
Profile Horizon Depth Glu Gal Mur AS tot AS tot Glu:Mur
cm µg gsoil−1 mg gC−1 P1 BC 0–35 142.4 ± 18.4 28.4 ± 4.3 1.6 ± 0.3 172.4 ± 22.4 18.9 ± 5.0 89.8 ± 31.0 P1 BC 35–60 36.3 ± 4.7 5.7 ± 0.9 0.6 ± 0.1 42.6 ± 5.5 5.5 ± 1.8 63.1 ± 21.7 P2 Bw 3–44 45.9 ± 5.9 7.7 ± 1.2 0.7 ± 0.1 54.3 ± 7.1 16.3 ± 1.5 69.4 ± 24.1 P2 BC 44–75 29.6 ± 3.8 10.8 ± 1.6 0.8 ± 0.2 41.1 ± 5.3 16.2 ± 2.0 36.5 ± 12.6 P3 E 0–7 255.7 ± 33.0 73.2 ± 11.1 3.5 ± 0.8 332.4 ± 43.2 26.3 ± 4.0 73.8 ± 25.5 P3 Bh 7–23 251.1 ± 32.4 68.4 ± 10.3 2.5 ± 0.6 322.0 ± 41.9 19.9 ± 3.2 98.8 ± 34.2 P3 Bw 23–57 134.1 ± 17.3 53.0 ± 8.0 3.1 ± 0.7 190.3 ± 24.7 23.3 ± 3.6 42.7 ± 14.8 P3 BC >57 23.2 ± 3.0 5.3 ± 0.8 0.5 ± 0.1 29.0 ± 3.8 4.2 ± 0.5 42.9 ± 14.9 P4 E 0–10 69.2 ± 8.9 17.9 ± 2.7 1.3 ± 0.3 88.3 ± 11.5 10.4 ± 1.9 54.9 ± 19.0 P4 Bh 10–17 68.5 ± 8.8 19.8 ± 3.0 3.2 ± 0.7 91.5 ± 11.9 5.7 ± 1.1 21.6 ± 7.5 P4 Bhs 17–17.5 91.8 ± 11.8 28.9 ± 4.4 5.0 ± 1.1 125.8 ± 16.3 5.5 ± 0.9 18.3 ± 6.3 P4 Bs 17.5–23 17.5 ± 2.3 6.2 ± 0.9 1.0 ± 0.2 24.8 ± 3.2 5.5 ± 0.3 17 ± 5.9 P4 Bw 23–63 16.2 ± 2.1 6.0 ± 0.9 1.2 ± 0.3 23.5 ± 3.0 8.8 ± 1.0 13.5 ± 4.7 P4 BC 63–113 9.4 ± 1.2 4.6 ± 0.7 0.4 ± 0.1 14.3 ± 1.9 11.4 ± 0.8 25.6 ± 8.8 P5 E 0–8 369.0 ± 47.6 60.3 ± 9.1 5.9 ± 1.3 435.1 ± 56.6 29.4 ± 5.2 62.2 ± 21.5 P5 Bh 8–9.5 363.5 ± 46.9 103.2 ± 15.6 24.0 ± 5.2 490.6 ± 63.8 15.7 ± 2.8 15.2 ± 5.3 P5 Bhs 9.5–10 206.7 ± 26.7 55.3 ± 8.3 14.9 ± 3.2 276.8 ± 36.0 6.8 ± 1.1 13.9 ± 4.8 P5 Bs 10–15 60.8 ± 7.8 7.6 ± 1.1 2.7 ± 0.6 71.1 ± 9.2 6.1 ± 1.2 22.7 ± 7.9 P5 Bw 15–40 9.5 ± 1.2 2.0 ± 0.3 0.6 ± 0.1 12.0 ± 1.6 10.3 ± 1.1 16.9 ± 5.8 P5 BC 40–60 4.5 ± 0.6 0.9 ± 0.1 0.2 ± 0.03 5.5 ± 0.7 8.7 ± 0.6 29.2 ± 10.3
The microbial biomass is lower in these young pedons in comparison with the older profiles, as shown by AS-derived C contents (Table 3). In those poorly differentiated profiles, the Glu:Mur ratio is high (>37) and no significant difference was observed at depth, which indicates that the microbiota is dominated by fungi in the whole profile (Table 3, Figure 5).
Highly Weathered and Leached Soil Horizons: Selective Preservation of Recalcitrant
Compounds—Fungi-Dominated Population
In the E horizons of P3–270, P4–330, and P5–530 years, the effect of mineral weathering is evident, as TRB values steeply decline in comparison with P1–120 and P2–175 years values. Selective extractions reveal a low content of secondary Al-, Fe-bearing phases (Alo < 1.4 g kg−1 and Fed < 2.5 g kg−1, Table 1, Figure 2). Thus, C
MP concentration in E horizons is low (< 1.7 g kg−1) and the main mechanism of SOM preservation is probably the intrinsic recalcitrance of organic compounds, which accumulate in those horizons (Figure 2).
As in younger pedons, the microbial biomass is mainly fungi-dominated, i.e., a Glu:Mur ratio of 55–74 (Table 3, Figure 5). Fungi are obligatory aerobes and heterotrophs, more tolerant to acidic conditions and dry events than bacteria (Ekschmitt et al., 2008). Fungi are more abundant in coarse fractions ( Kögel-Knabner et al., 2008b) and are generally specialized toward an
assimilation of C directly from the litter (for example lignin) (Poll et al., 2006; Ekschmitt et al., 2008). Furthermore, they are the primary agents of litter and SOM decomposition (Beare et al., 1995; Bardgett and van der Putten, 2014; Keiluweit et al., 2015). It is therefore not surprising to observe fungi prevailing in highly weathered and leached E horizons of Podzols (van Breemen et al., 2000a; Nikonov et al., 2001; Gadd, 2007), which are typically aerated and receive large C input from litter decomposition. Under coniferous forests, mineral weathering has been attributed to acidic excreta from saprotrophic and mycorrhizal fungi (Gadd, 2007). In laboratory studies, ectomycorrhizal fungi were shown to accelerate chemical weathering (Bonneville et al., 2011) (i) by an acidification of their near-environment, (ii) oxidization of redox-sensitive elements such as Fe (Bonneville et al., 2016) which induces exfoliation of biotite and (iii) by combining those chemical weathering strategies with mechanical constraints on their mineral substrates (Bonneville et al., 2009). Ectomycorrhizal fungi have also been shown to “drill” innumerable narrow cylindrical micropores (3–10 µm) in minerals and to excrete micro- to milli-molar concentrations of organic acids in fungal tips (Jongmans et al., 1997; van Breemen et al., 2000a; Hoffland et al., 2002; van Hees et al., 2003; Smits et al., 2005; Bonneville et al., 2011, 2016). Tunnel formation in mineral grains was more intense in nutrient-poor sites, indicating a larger contribution of fungi to plant P, Ca, K supply (van Breemen et al., 2000b; Gadd, 2007). Plant-ectomycorrhizal symbiosis has been proposed as a major driving force in the formation of Podzol E
E Bh Bw BC 0 20 40 60 80 100 P3 Oh BC / Bw / E Bh Bhs Bs Bw BC 0 10 20 30 40 50 P1 P2 P3 P4 P5 E Bh Bhs Bs 0 20 40 60 80 100 P5 Co/No Cmp/Nmp Cr/Nr Ct/Nt CT/NT C/N of SOM frac!ons A B C
FIGURE 4 | (A) Evolution of the CT/NTratio of the 5 profiles of increasing age: P1–120 years, P2–175 years, P3–270 years, P4–330 years, and P5–530 years. Evolution of the C/N ratio of the SOM fractions [total (CT/NT), recalcitrant (CR/NR), oxidizable (CO/NO) and mineral-protected (CMP/NMP) carbon fraction], in the four first horizons of P3 (B) and P5 (C) profiles (error bars represent ± one standard deviation).
0 50 100 150
Glu:Mur
P1-120yrs P2-175yrs P3-270yrs P4-330yrs P5-530yrs BC/Bw/E Bh Bhs Bs Bw BCFIGURE 5 | Evolution of the ratio between glucosamine and muramic acid content (two amino-sugars) in the horizons of the 5 profiles of increasing age (error bars represent ± one standard deviation).
horizons (van Breemen et al., 2000a,b). As such, the E horizon has been considered as the “fungal-eaten” part of the soil (Baldock and Broos, 2012).
Subsoil Horizons Accumulating Mineral and Organic Phases: Large Physico-Chemical Ability to Stabilize SOM—Bacteria-Dominated Population
In P4 and P5 illuvial horizons, CMP content is strongly and positively correlated with Fep (r = 0.85), Alp (r = 0.91) and Fed-Fep (r = 0.88) contents, which are proxies for organo-Fe and organo-Al complexes, as well as Fe oxides respectively. Interestingly, the degradability of SOM, measured from respiration rates (Table 2), was the lowest in Bh, Bhs and Bs horizons. Those results support the notion that SOM interactions with Fe and Al phases (which accumulate in these horizons) stabilize SOM and protect it from microbial degradation. This observation is in line with a number of studies on Podzols (Eusterhues et al., 2003; Kalbitz et al., 2005; Mikutta et al., 2005a; von Lützow et al., 2006, 2008; Jones et al., 2015), as well as on other soil types (Kleber et al., 2005; Mikutta et al., 2006; Kaiser and Guggenberger, 2007). Fe oxides have a high specific-surface area, usually positively charged (Eusterhues et al., 2005), which readily adsorb negatively-charged OM. Formation of Fe-C coprecipitates can also occur (Kögel-Knabner et al., 2008b; Mikutta et al., 2008). An inhibition of biological activity due to Fe and Al, bound to the organic matter, was reported in several studies (Boudot et al., 1989; Boudot, 1992; Sollins et al., 1996; Jones and Edwards, 1998; Baldock and Skjemstad, 2000).
oxides decreased the synthesis of bacterial AS by a factor 2. In addition to the physical protection of SOM, P4–330, and P5–530 years illuvial horizons of the chronosequence present a clogged porosity, which—considering the heavy rainfall—favors water saturation and disoxic/anoxic episodes. The resulting decrease in O2availability would then drastically inhibit the SOM mineralization process. Overall, our results suggest that lower SOM degradation rates in the Bh, Bhs and Bs of P4 and P5 are explained by the mechanisms of adsorption and co-precipitation of SOM with pedogenic secondary minerals. However, we cannot omit the key role of specific soil physico-chemical properties in the environment of the indurated Bhs horizon. Illuvial horizons
can be considered as “non-preferred soil spaces” (sensuEkschmitt et al., 2008), where microbial activity is limited by suboptimal environmental conditions and low nutrient bioavailability caused by SOM association with reactive surfaces of secondary minerals (Schmidt et al., 2011).
Consistent with this idea, a distinct microbial population was identified in the B horizons of P4 and P5. The Glu:Mur ratio of the latter horizons is significantly lower than in the overlaying E horizons, indicating a bacteria-dominated microbiota (Table 3, Figure 5). In the chronosequence, there is no correlation between pH and the Glu:Mur ratio (r2 =0.041), indicating that other factors drive microbial populations composition. It appears
FIGURE 6 | Evolutions in the organic, physico-chemical and mineral compartments, resulting main SOM protection mechanisms and microorganism population, for the five Vancouver profiles of increasing age (P1-120 years, P2-170 years, P3-270 years, P4-330 years, and P5-530 years).
that soil oxygenation status impacts the composition of the microbiota. B horizons which are prone to water saturation are thus less attractive to fungi which are usually highly hydrophobic and water-intolerant due to their aerobic respiration (Slankis, 1974). For instance, mycorrhizal association between fungi and plant roots do not form in waterlogged soils (Theodorou, 1978). This is in line with van Breemen et al. (2000a) who reported a steep decrease of fungal biomass at the transition between E and the B horizons in Podzol. Bacteria require a certain degree of water-saturation and have the capability to quickly adapt to changing chemical conditions by switching electron acceptors [for example from O2to Fe(III)] when anoxia sets in (Baldock and Skjemstad, 2000; Chenu and Stotzky, 2002; von Lützow et al., 2006; Kögel-Knabner et al., 2008b). In addition, bacteria generally specialize in utilizing labile C compounds for assimilation reactions in deeper horizons (Poll et al., 2006; Ekschmitt et al., 2008). It is thus coherent that bacteria prevail in the cemented spodic horizons of hydromorphic Podzols, receiving DOC illuviated from the topsoil, and in which roots and/or fungi develop poorly. Bacteria are the main drivers of SOM degradation, but they might also have an important impact on the stability of secondary minerals. Among the bacteria that are able to switch to other electron acceptors in anoxic conditions, iron-reducing bacteria can dissolve secondary Fe(III) phases, producing dissolved Fe(II) which can potentially re-precipitate as new secondary phases. This process might have an important impact on illuvial B horizon evolution in Podzols.
CONCLUSION
Our study objective was to evaluate the co-evolution of SOM protection processes and microbial populations at different stages of soil genesis, in different horizons from five pedons of a podzolic chronosequence.
In the Cox Bay chronosequence, SOM protection processes are constrained in the two younger pedons (P1–120 years and P2–175 years). A weathered eluvial E horizon develops, first observed in P3–270 years, accumulating recalcitrant organic C. In the two well-developed Podzols (P4–330 years and P5–530 years), the accumulation of secondary minerals and associated SOM induces the development of an illuvial B or spodic horizon, cemented and probably undergoing episodic waterlogging. SOM mineralization is hindered in these horizons, due to the formation of OMA and to clogging of soil porosity, leading to a specific low O2 microenvironment. Our study illustrates that SOM stabilization in soils is time- and horizon-specific and, more specifically, pedogenetically dependent (Figure 6).
Soil development and evolution of SOM protection processes along our soil chronosequence induce modifications of the composition of soil microbiota. In the initial stage of pedogenesis (120, 175, and 270 years), fungi are the prevalent group both in
topsoil and subsoil. In the older pedons (330 and 530 years), while the topsoil horizons remain fungi-dominated, bacteria dominate in the cemented B horizons where large quantities of SOM are stabilized (Figure 6). We assume that this change in microbial community composition potentially has a feedback effect on SOM dynamics. Below-ground community development and functions are poorly known. The important role played by fungi in the E horizon during podzolization is increasingly recognized. However, the bacterial community and function in the B horizon of hydromorphic Podzols still need to be investigated. Given their potential impact on all aspects of soil development (mineral and SOM evolutions), our understanding of the illuvial horizon dynamics would be enhanced by a characterization of its microbial population and their functions.
AUTHOR CONTRIBUTIONS
This research is part of the PhD thesis of M-LV, supervised by J-TC and BD. EVR carried out the micromorphological analysis and was involved in the data interpretation. SD supervised the laboratory work for microbial characterization and was involved in the data interpretation. SB helped with data interpretation. All authors participated to the manuscript revision and discussion. All authors agree to be accountable for the content of the work.
FUNDING
Financial support was provided by the Belgian Fond de la Recherche Scientifique (F.R.S.-FNRS, FRFC project 2.4590.12).
ACKNOWLEDGMENTS
We thank A. Iserentant and C. Givron [Université Catholique de Louvain (UCL), Belgium] for the analysis with the ICP-AES and help with laboratory work. Les Lavkulich is acknowledged for his help during the fieldwork. We thank the Laboratory of Mineralogy and Petrology (Ghent University) for the thin sections preparation; the Isotope Bioscience Laboratory - ISOFYS (Ghent University) for hosting the amino sugar analysis and S. Bodé for his help with laboratory work and amino sugar measurements.
SUPPLEMENTARY MATERIAL
The Supplementary Material for this article can be found online at: https://www.frontiersin.org/articles/10.3389/fenvs. 2018.00070/full#supplementary-material
Figure S1 | Cumulative soil respiration (in mg CO2100 g−1) over the 144 day incubation from soils for the five Vancouver profiles of increasing age (P1–120 years, P2–170 years, P3–270 years, P4–330 years, and P5–530 years). Values are means of triplicate measurements ± standard error.
REFERENCES
AFNOR (2006). Qualité du sol - Prétraitement des Echantillons pour Analyses Physico-Chimiques. La Plaine Saint-Denis. NF ISO 11464, December 2006. Amelung, W., Lobe, I., and Du Preez, C. C. (2002). Fate of microbial residues in
sandy soils of the South African Highveld as influenced by prolonged arable cropping. Eur. J. Soil Sci. 53, 29–35. doi: 10.1046/j.1365-2389.2002.00428.x Amelung, W., Miltner, A., Zhang, X., and Zech, W. (2001). Fate of microbial
residues during litter decomposition as affected by minerals. Soil Sci. 166, 598–606. doi: 10.1097/00010694-200109000-00003
Baize, D. (1993). Soil Science Analyses. A Guide to Current Use. Chichester: John Wiley & Sons Ltd.
Baldock, J. A., and Broos, K. (2012). “Soil organic matter,” in Handbook of Soil Sciences, 2nd, Edn., Vol. 1: Properties and Processes, eds P. M. Huang, Y. Li, and M. E. Sumner (Boca Raton, FL: CRC Press; Taylor & Francis Group), 11.11–11.52.
Baldock, J. A., and Skjemstad, J. (2000). Role of the soil matrix and minerals in protecting natural organic materials against biological attack. Org. Geochem. 31, 697–710. doi: 10.1016/S0146-6380(00)00049-8
Bardgett, R. D., and van der Putten, W. H. (2014). Belowground biodiversity and ecosystem functioning. Nature 515, 505–511. doi: 10.1038/nature13855 Barré, P., Plante, A. F., Cécillon, L., Lutfalla, S., Baudin, F., Bernard, S., et al.
(2016). The energetic and chemical signatures of persistent soil organic matter. Biogeochemistry 130, 1–12. doi: 10.1007/s10533-016-0246-0
Bascomb, C. L. (1968). Distribution of pyrophosphate-extractable iron and organic carbon in soils of various groups. J. Soil Sci. 19, 251–268. doi: 10.1111/j.1365-2389.1968.tb01538.x
Basile-Doelsch, I., Balesdent, J., and Rose, J. (2015). Are interactions between organic compounds and nanoscale weathering minerals the key drivers of carbon storage in soils? Environ. Sci. Technol. 49, 3997–3998. doi: 10.1021/acs.est.5b00650
Beare, M., Coleman, D., Crossley, D. Jr., Hendrix, P., and Odum, E. (1995). “A hierarchical approach to evaluating the significance of soil biodiversity to biogeochemical cycling” in The Significance and Regulation of Soil Biodiversity, eds H. P. Collins, G. P. Robertson, and M. J. Klug (Dordrecht: Springer), 5–22. Benyarku, C. A., and Stoops, G. (2005). Guidelines for Preparation of Rock And Soil Thin Sections and Polished Sections. Departament de Medi Ambient i Ciències del Sòl, Lleida: Universitat de Lleida.
Blakemore, L. C., Searle, P. L., and Daly, B. K. (1987). Methods for Chemical Analysis of Soils. New Zealand Soil Bureau Scientific Report No. 80, Lower Hutt. Bodé, S., Denef, K., and Boeckx, P. (2009). Development and evaluation of a high-performance liquid chromatography/isotope ratio mass spectrometry methodology for delta13C analyses of amino sugars in soil. Rapid Commun. Mass Spectr. 23, 2519–2526. doi: 10.1002/rcm.4093
Bodé, S., Fancy, R., and Boeckx, P. (2013). Stable isotope probing of amino sugars– a promising tool to assess microbial interactions in soils. Rapid Commun. Mass Spectr. 27, 1367–1379. doi: 10.1002/rcm.6586
Bonneville, S., Bray, A. W., and Benning, L. G. (2016). Structural Fe(ii) oxidation in biotite by an ectomycorrhizal fungi drives mechanical forcing. Environ. Sci. Technol. 50, 5589–5596. doi: 10.1021/acs.est.5b06178
Bonneville, S., Morgan, D. J., Schmalenberger, A., Bray, A., Brown, A., Banwart, S. A., et al. (2011). Tree-mycorrhiza symbiosis accelerate mineral weathering: evidences from nanometer-scale elemental fluxes at the hypha–mineral interface. Geochim. Cosmochim. Acta 75, 6988–7005. doi: 10.1016/j.gca.2011.08.041
Bonneville, S., Smits, M. M., Brown, A., Harrington, J., Leake, J. R., Brydson, R., et al. (2009). Plant-driven fungal weathering: early stages of mineral alteration at the nanometer scale. Geology 37, 615–618. doi: 10.1130/G25699A.1 Boudot, J., Bel Hadj Brahim, A., Steiman, R., and Seigle-Murandi, F. (1989).
Biodegradation of synthetic organo-metallic complexes of iron and aluminium with selected metal to carbon ratios. Soil Biol. Biochem. 21, 961–966. doi: 10.1016/0038-0717(89)90088-6
Boudot, J.-P. (1992). Relative efficiency of complexed aluminum noncrystalline Al hydroxide, allophane and imogolite in retarding the biodegradation
of citric acid. Geoderma 52, 29–39. doi: 10.1016/0016-7061(92)
90073-G
Buurman, P., and Jongmans, A. G. (2005). Podzolisation and soil organic matter dynamics. Geoderma 125, 71–83. doi: 10.1016/j.geoderma.2004.07.006
Buurman, P., van Bergen, P., Jongmans, A., Meijer, E., Duran, B., and van Lagen, B. (2005). Spatial and temporal variation in podzol organic matter studied by pyrolysis-gas chromatography/mass spectrometry and micromorphology. Eur. J. Soil Sci. 56, 253–270. doi: 10.1111/j.1365-2389.2004.00662.x
Chao, T. T., and Sanzolone, R. F. (1992). Decomposition techniques. J. Geochem. Explor. 44, 65–106. doi: 10.1016/0375-6742(92)90048-D
Chenu, C., and Stotzky, G. (2002). “Interactions between microorganisms and soil particles: an overview,” in Interactions Between Soil Particles and Microorganisms, eds P. Huang, J. Bollag, and N. Senesi (Manchester: John Wiley & Sons, Ltd.), 1–40.
Cornelis, J.-T., Weis, D., Lavkulich, L., Vermeire, M.-L., Delvaux, B., and Barling, J. (2014). Silicon isotopes record dissolution and re-precipitation of pedogenic clay minerals in a podzolic soil chronosequence. Geoderma 235–236, 19–29. doi: 10.1016/j.geoderma.2014.06.023
Cornell, R. M., and Schwertmann, U. (2003). The Iron Oxides: Structure, Properties, Reactions, Occurrences and Uses. Weinheim: John Wiley & Sons.
Cornu, S., Montagne, D., and Vasconcelos, P. M. (2009). Dating constituent formation in soils to determine rates of soil processes: a review. Geoderma 153, 293–303. doi: 10.1016/j.geoderma.2009.08.006
Cotrufo, M. F., Wallenstein, M. D., Boot, C. M., Denef, K., and Paul, E. (2013). The Microbial Efficiency-Matrix Stabilization (MEMS) framework integrates plant litter decomposition with soil organic matter stabilization: do labile plant inputs form stable soil organic matter? Glob. Chang. Biol. 19, 988–995. doi: 10.1111/gcb.12113
De Coninck, F. (1980). Major mechanisms in formation of spodic horizons. Geoderma 24, 101–128. doi: 10.1016/0016-7061(80)90038-5
De Coninck, F., and Righi, D. (1969). Aspects micromorphologiques de la podzolisation en Forêt de Rambouillet. Sci. Sol. 2, 57–77.
De Coninck, F., Righi, D., Maucorps, J., and Robin, A. (1974). “Origin and micromorphological nomenclature of organic matter in sandy spodosols,” in Soil Microscopy, ed G. K. Rutherford (Kingston, ON: The Limestone Press), 263–280.
Ekschmitt, K., Kandeler, E., Poll, C., Brune, A., Buscot, F., Friedrich, M., et al. (2008). Soil-carbon preservation through habitat constraints and biological limitations on decomposer activity. J. Plant Nutr. Soil Sci. 171, 27–35. doi: 10.1002/jpln.200700051
Ekschmitt, K., Liu, M., Vetter, S., Fox, O., and Wolters, V. (2005). Strategies used by soil biota to overcome soil organic matter stability—why is dead organic matter left over in the soil? Geoderma 128, 167–176. doi: 10.1016/j.geoderma.2004.12.024
Eusterhues, K., Rumpel, C., Kleber, M., and Kögel-Knabner, I. (2003). Stabilisation of soil organic matter by interactions with minerals as revealed by mineral dissolution and oxidative degradation. Org. Geochem. 34, 1591–1600. doi: 10.1016/j.orggeochem.2003.08.007
Eusterhues, K., Rumpel, C., and Kogel-Knabner, I. (2005). Organo-mineral associations in sandy acid forest soils: importance of specific surface area, iron oxides and micropores. Eur. J. Soil Sci. 56, 753–763 doi: 10.1111/j.1365-2389.2005.00710.x
Farmer, V., Russell, J., and Berrow, M. (1980). Imogolite and
proto-imogolite allophane in spodic horizons: evidence for a mobile
aluminium silicate complex in podzol formation. J. Soil Sci. 31, 673–684. doi: 10.1111/j.1365-2389.1980.tb02113.x
Fekiacova, Z., Vermeire, M., Bechon, L., Cornelis, J., and Cornu, S. (2017). Can Fe isotope fractionations trace the pedogenetic mechanisms involved in podzolization? Geoderma 296, 38–46. doi: 10.1016/j.geoderma.2017.02.020 Gadd, G. M. (2007). Geomycology: biogeochemical transformations of
rocks, minerals, metals and radionuclides by fungi, bioweathering and bioremediation. Mycol. Res. 111, 3–49. doi: 10.1016/j.mycres.2006.12.001 Gangloff, S., Stille, P., Pierret, M.-C., Weber, T., and Chabaux, F. (2014).
Characterization and evolution of dissolved organic matter in acidic forest soil and its impact on the mobility of major and trace elements (case of the Strengbach watershed). Geochim. Cosmochim. Acta 130, 21–41. doi: 10.1016/j.gca.2013.12.033
Glaser, B., Turrión, M. B., and Alef, K. (2004). Amino sugars and muramic acid— biomarkers for soil microbial community structure analysis. Soil Biol. Biochem. 36, 399–407. doi: 10.1016/j.soilbio.2003.10.013
Grandy, A., and Neff, J. (2008). Molecular C dynamics downstream: the biochemical decomposition sequence and its impact on soil organic