HAL Id: hal-00111082
https://hal.archives-ouvertes.fr/hal-00111082
Submitted on 20 Nov 2006HAL is a multi-disciplinary open access archive for the deposit and dissemination of sci-entific research documents, whether they are pub-lished or not. The documents may come from teaching and research institutions in France or abroad, or from public or private research centers.
L’archive ouverte pluridisciplinaire HAL, est destinée au dépôt et à la diffusion de documents scientifiques de niveau recherche, publiés ou non, émanant des établissements d’enseignement et de recherche français ou étrangers, des laboratoires publics ou privés.
Temporal dynamics of auditory and visual bistability
reveal common principles of perceptual organization.
Daniel Pressnitzer, Jean-Michel Hupé
To cite this version:
Daniel Pressnitzer, Jean-Michel Hupé. Temporal dynamics of auditory and visual bistability reveal common principles of perceptual organization.. Current Biology - CB, Elsevier, 2006, 16 (13), pp.1351-7. �10.1016/j.cub.2006.05.054�. �hal-00111082�
Temporal dynamics of auditory and visual bistability
reveal common principles of perceptual organization
D. Pressnitzer (1), J.M. Hupé (2)
(1) Laboratoire Psychologie de la Perception (FRE 2929) CNRS - Université René Descartes Paris 5
Ecole Normale Supérieure, Département d’Etudes Cognitives 29 rue d’Ulm
75005 Paris, France Daniel.Pressnitzer@ens.fr
(2) Centre de Recherche Cerveau Cognition (UMR 5549) CNRS – Université Paul Sabatier Toulouse 3
Faculté de Médecine de Rangueil 31062 Toulouse Cedex 9, France Jean-Michel.Hupe@cerco.ups-tlse.fr Corresponding author: Daniel Pressnitzer
Manuscript information: 2916 words in main text, 3 figures, 48 references Running head: Auditory and visual bistability
Summary
When dealing with natural scenes, sensory systems have to process an often messy and ambiguous flow of information. A stable perceptual organization has nevertheless to be achieved in order to guide behavior. The neural mechanisms involved can be highlighted by intrinsically ambiguous situations. In such cases, bistable perception occurs: distinct interpretations of the unchanging stimulus alternate spontaneously in the mind of the observer [1]. Bistable stimuli have been used extensively for more than two centuries to study visual perception [2]. Here we demonstrate that bistable perception also occurs in the auditory modality. We compared the temporal dynamics of percept alternations observed during auditory streaming [3, 4] with those observed for visual plaids [5, 6], and the susceptibilities of both modalities to volitional control. Strong similarities indicate that auditory and visual alternations share common principles of perceptual bistability. The absence of correlation across modalities for subject-specific biases, however, suggests that these common principles are implemented at least partly independently across sensory modalities. We propose that visual and auditory perceptual organization could rely on distributed but functionally similar neural competition mechanisms aimed at resolving sensory ambiguities.
Results and Discussion
The study of bistable perception has generated a sustained interest in visual neuroscience, as it decouples the conscious perception of the observer from the characteristics of the physical stimulation: the same stimulus evokes different percepts. This provides a powerful method to probe the neural bases of perception. Changes in neural responses that correlate with subjective percepts cannot be traced to changes in the stimulation [7]. Bistability has been described with a wide range of stimuli: ambiguous figures [8], binocular rivalry [2, 9], moving plaids [5] to cite a few. Some theoretical accounts of bistability are based on sensory fatigue, adaptation or inhibition of peripheral neural channels, and are thus specific to the type of bistability studied [10-12]. Others posit a central switching mechanism [1, 13]. Neural correlates have been exhibited for both types of models [1, 8, 9, 14].
In spite of the value that bistable perception presents for the study of perceptual organization, it has only been described systematically in the visual modality. There are reports of alternating perceptual interpretations of an unchanging auditory stimulation, such as in the verbal transformation effect where the repetition of a same word can produce different meanings [15], or for auditory grouping [4]. It is unclear, however, what similarities or differences exist between such phenomena and visual bistability. The present study of bistable perception in two sensory modalities aims to investigate whether the rules governing the alternation of perceptual states are general principles of brain function, or specific to the visual system.
We chose a simple auditory scene to study “auditory bistability”. We used a stimulus where a high-frequency tone A alternates with a low-frequency tone B, in repeated ABA- patterns. Listeners report either hearing the sequence as one stream ABA-ABA or as two streams A-A-A-A and -B---B-. This streaming stimulus has become a canonic paradigm to study auditory scene analysis behaviorally [3, 4], or, recently, to address the neural basis of auditory scene analysis [16-20]. Three of these studies took advantage of spontaneous percept alternations to look for corresponding changes in neural activity [17-19]. It seems timely to assess the commonalities of this phenomenon with visual bistability, which has been the subject of intense investigation.
Moving plaids were chosen as visual stimuli. When a network of crossing lines is seen moving through a circular aperture, it can be perceived either as a single plaid moving in a given direction or as two gratings sliding in opposite directions on top of each other [5, 6]. Plaids are typical illustrations of visual bistability, with similar characteristics to binocular rivalry [5, 21, 22] but displaying less indeterminate percepts (blending or piecemeal rivalry). Moreover, there is a formal correspondence between the visual and auditory stimuli chosen in terms of organization of the sensory scene: a decision has to be made whether to group the scene into one stream/one plaid, or to split the scene between two streams/two gratings. We will refer to these situations as Grouped or Split percepts. Examples of auditory and visual stimuli are provided as Supplemental Data.
Leopold and Logothetis [1] established three characteristics of perceptual alternations observed in all instances of visual bistability: exclusivity, randomness, and inevitability. Exclusivity means that perceptual interpretations are mutually exclusive. Randomness characterizes the statistical distribution of the time spent in each percept. Inevitability indicates that observers have only limited volitional control on perceptual alternations. We now show that these criteria are met for both auditory and visual ambiguous stimuli, with similar characteristics in their temporal dynamics.
Exclusivity
Twenty-three participants listened to ABA- sequences or observed moving plaids for 4-minute intervals. They were instructed to report continuously their conscious perception (Grouped, Split, or Indeterminate). All participants reported spontaneous alternations during prolonged exposure to either type of stimuli. In the auditory case, the time spent in the Grouped or Split percepts was equally divided on average across the population of participants. This proportion is expected to depend on the parameters chosen for the ABA- stimulus [3]. Importantly, very little time was spent in an “indeterminate” perceptual state: less than 3 % of total presentation time, even though this was the default response when stimulus presentation began. Mean and standard deviation for the percentage of time spent were: Grouped 51.4 (21.2); Split 45.8 (20.4); Indeterminate 2.8 (3.5). Results were similar in the visual modality: Grouped 50.1 (14.6); Split 48.5 (15.1); Indeterminate 1.3 (2.0). Both modalities thus display the basic feature of bistability, the spontaneous alternation between mutually exclusive percepts.
Randomness
A hallmark of visual bistability is that the durations of alternating percepts, or phases, follow a random law that can be fitted with a gamma or lognormal distribution [5, 23, 24]. A lognormal distribution suggests the multiplication of a large number of independent random processes [24] whereas a gamma distribution results from the combination of a small number of consecutive Poisson processes [25]. Although observed for a variety of phenomena, lognormal or gamma distributions are not observed when subjects are asked to press buttons randomly [26].
Figure 1 Temporal dynamics for auditory and visual bistability. (A, B) The durations of the first
seven successive phases are presented for both the auditory modality (A, dark grey) and the visual modality (B, light grey). Durations were first transformed to a log scale, then averaged across all participants that experienced 7 or more successive phases (Audition N=20, Vision N=23). The error bars represent 95% confidence intervals around the mean estimated by 1.96 standard error. The log-scale is converted back to seconds for display purposes. The first percept is significantly longer that subsequent ones. There is no long-term trend in the duration of phases after the first one. (C, D) The histograms of durations of Grouped and Split phases are presented, compiled for all participants (N=23) and percept types (Grouped and Split). All durations were normalized by the average phase duration in each given run. The first phase was excluded from the analysis as it lasted longer than subsequent ones. There is no significant difference between the distributions for the two modalities (Kolmogorov-Smirnov test, p=0.1). (E, F) The duration of a percept is shown as a function of the duration of the previous percept, for all participants (N=23). These are the same data that constitute the histograms of panels C, D, but in raw format without any normalization. The duration of a phase does not influence the duration of the next phase, for both modalities. All data in this figure from the Neutral task.
The average durations for successive phases are shown in Figure 1A, B. For both the auditory and visual modalities, the first phase had a longer duration than subsequent phases. This is consistent with previous results obtained in the visual modality [5]. With the first phase excluded, the switching rate was constant over
observation time with no long-term trends (see also Supplemental Data). There is a tendency for auditory phases to last longer than visual ones, which might be due to the specific stimulus parameters used here.
The distribution of phase durations for the auditory and visual modality are illustrated in Figure 1C, D. Analyses of phase distribution require that switching rate be stable over time so the first percept was excluded. Phases were normalized by the average phase duration over a given trial to limit the influence of inter-individual differences, as proposed for visual bistability [21, 27]. The normalized phase distributions are skewed toward longer durations, a characteristic of gamma or lognormal distributions. Distinguishing between the two is beyond the scope of the present paper where only potential similarities between auditory and visual distributions are of interest. An analysis of variance (Experimental Procedures) showed that both distributions were not statistically different from lognormal. A Kolmogorov-Smirnov test further indicated that the auditory distribution was not significantly different from the visual distribution. The temporal dynamics of both phenomena thus display a strong similarity.
Scatterplots of the duration of a given phase as a function of the duration of the previous phase are shown in Figure 1E, F. These panels displays all available data points and illustrate the large variability observed among phase durations when no normalization is applied. No correlation exists between successive durations, consistent with what is observed for binocular rivalry [23] (statistical analyses as Supplemental Data).
Inevitability
Volitional control can bias the perception of some visual bistable stimuli [28-31]. The amount of volitional control that can be exerted has been proposed as an indication of the neural level where competition between percepts occurs, with large control reflecting higher-level processes [8]. We investigated the effect of observer intention on the reported percepts for auditory streaming and visual plaids. On successive runs, participants were instructed to try to maintain a given perceptual interpretation throughout stimulus presentation. For both modalities, volitional control had a significant effect (Figure 2A). When subjects tried to group, the proportion of Grouped percepts increased as compared to the neutral task. The opposite was true when they tried to split. The effect of volitional control was stronger for the auditory
modality than for the visual modality. Bistable perception is however inevitable in the two modalities, as alternations persist even in the presence of intention.
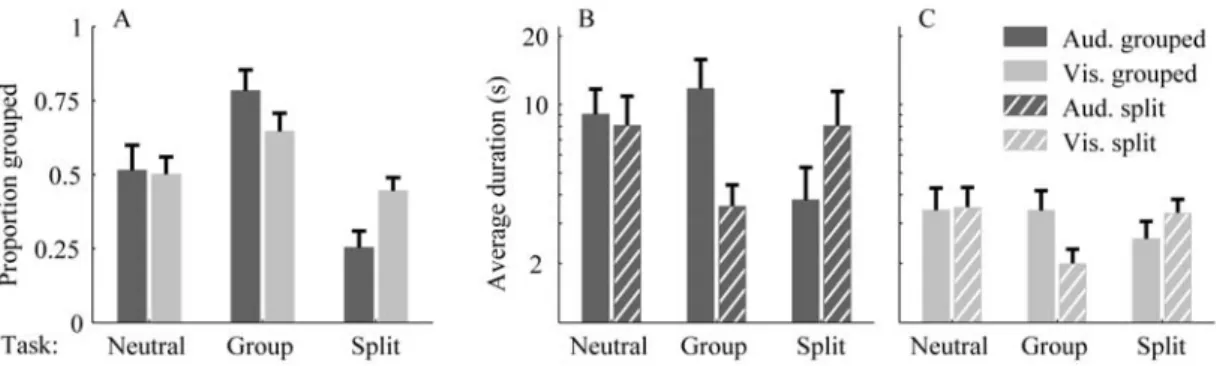
Figure 2 Effect of volitional control on auditory and visual bistability. (A) The proportion of time
spent in the Grouped percept is shown as a function of the task (Neutral, Group, Split) and modality of presentation (Auditory in dark grey, Visual in light grey). Mean and 95% confidence intervals across participants. Data for all participants (N=23). Each participant performed each task once. In the Neutral task, the Grouped percept was experienced for about 50% of the time on average, for both modalities. Participants could influence the amount of time spent in a given perceptual state according to their intention. The effect is observed in both modalities with a stronger magnitude in the auditory modality (Group minus Split difference 53% vs 20%). (B, C) The time spent in Grouped (solid lines) and Split (dashed lines) percept is shown as a function of the task, for each modality. Durations were converted to a log-scale, with the corresponding values shown in seconds for display purposes. Mean and 95 % confidence intervals across participants. In both modalities and for both volitional tasks, intention translated into a shortening of the duration of the unwanted percept but caused no increase in the duration of the target percept
Volitional control had a specific effect on the duration of each percept type (Figure 2B, C). In the neutral task, no difference was found between the Grouped and Split durations. When subjects tried to group, the mean duration of the Grouped phases did not actually increase – rather, the mean duration of the Split phases was reduced. This pattern of result is identical for the two intentions and the two modalities: volitional control shortens the unwanted phases but does not increase the duration of the target phases. This systematic and somewhat counter-intuitive effect argues against unspecific demand characteristic biases, where observers would simply adjust their reports to what the experimenter is asking for. It is rather consistent with Levelt’s second proposition [32]. This proposition states that, for binocular rivalry, strengthening the stimulus to one eye does not affect the dominance duration of that eye but rather decreases the dominance duration of the other eye. If it is assumed that intention increases the perceptual strength of the target percept, then the current data conform to Levelt’s second proposition. A similar effect of intention, although smaller, can be observed for binocular rivalry as selective attention only decreases the unattended eye dominance duration [30].
Absence of correlation across modalities
An important debate about visual bistability concerns the possibility of a common, top-down neural mechanism as the cause of alternations for all ambiguous stimuli [1, 8, 9, 28]. A common mechanism should introduce subject-specific biases irrespective of the stimulus [13, 22]. The number of switches [13], proportion of Grouped percept, and effect of volitional control [30] were compared for each subject across the two modalities in the present data. Inter-subject variations were large on all of these measures (Figure 3) so they can potentially reveal subject-specific biases. There was a weak, non-significant correlation for the number of switches (Figure 3A) indicating no bias to switch quickly or slowly irrespective of sensory modality– unlike the strong correlation observed between different visual bistable stimuli [13, 22]. The proportion of Grouped percept was also uncorrelated across modalities (Figure 3B). Finally, the amount of effective volitional control was estimated by subtracting the proportion of Grouped percepts between the “group” and “split” intentions, for each observer (Figure 3C). This measure was unrelated across modalities. Observers who were better at controlling their auditory percepts were not necessarily better at controlling their visual percepts (bottom-right part of Figure 3C). For all three measures investigated, idiosyncratic biases did not carry over between visual and auditory bistability.
Figure 3 Absence of correlation between subject-specific measures across modalities. (A) The
number of perceptual switches in the visual modality is plotted as a function of the number of switches in the auditory modality, for the Neutral task. Each point represents an individual observer (N=23). The number of switches is not correlated across modalities. (B) The relative amount of time where the stimuli are perceived as Grouped is compared for both modalities, for each individual observer, in the Neutral task. There is no idiosyncratic tendency to favor a Grouped or Split interpretation across modalities. (C) The magnitude of the effect of volitional control is compared across modalities. The effect was quantified by subtracting the proportion of Grouped percepts between the Group and Split intentions, for each observer. The magnitude of the effect of volitional control is uncorrelated across modalities.
Auditory streaming as a bistable percept
Auditory streaming determines whether we assign a sequence of sounds to one or more sources. Whereas streaming usually reflects physical reality, such as when more than one person talk at the same time, it can also be fooled, for instance when two interleaved musical melodies are produced by a monophonic instrument. With the ABA- stimulus that we used, there is an irresolvable ambiguity as to how many streams should be perceived. This leads to spontaneous alternations between percepts of one or two streams when the stimulus is heard for a prolonged period of time [4]. In addition, we have shown that these alternations share many features with visual bistability [1]: percepts of one-stream vs two-streams are mutually exclusive, their duration follows a lognormal distribution with short-term independence and no long-term trend, and volitional control has an influence on but does not abolish alternations. Based on these strong similarities, we propose that auditory streaming can be considered as an instance of perceptual bistability.
The bistable nature of auditory streaming has not been recognized before. Anstis and Saida [33] reported a “marked long-term trend over time toward auditory segregation”, and concluded that streaming was not comparable to visual bistability for which no such trend is observed. They used 30-sec long stimuli, however, and most experimenters used even shorter presentation times. The longer observation periods chosen here (240 sec), together with the analysis methods normally applied to visual bistability, lead on the contrary to the conclusion that after the first percept, the steady-state of the temporal dynamics of auditory streaming is purely stochastic with no long-term trend (Figure 1A).
This provides an alternative framework to interpret the long-term build-up of streaming documented by numerous studies [34]. A bias for an initial Grouped percept that lasts longer than subsequent ones was observed here (in the two modalities, possibly due to the asymmetry between Grouped and Split percepts). When such an initial Grouped bias is combined with random phase duration, averages across listeners and/or repeats will exhibit a gradual increase in the proportion of Split reports. The subsequent purely bistable nature of phase alternations then produces a plateau corresponding to the steady-state probabilities of the percepts. These two features are fully consistent with characteristics of the build-up of streaming, when considering average measures [3, 34]. Our results suggest that, additionally, measures
of temporal dynamics [5] could provide valuable new tools in the investigation of auditory streaming.
Models of perceptual bistability
Current accounts of visual bistability emphasize low-level competition of features [10, 12], high-level competition of representations [27], or top-down attentional selection mechanisms [1, 28]. The question arises as to which of those theoretical frameworks is able to account for both visual and auditory bistability.
We observed strong similarities between bistability in the two sensory modalities. A first possibility is that both phenomena are controlled by a common, high-level switching mechanism, as has been hypothesized for various kinds of visual bistability [13]. Using fMRI with auditory streaming stimuli, Cusack [19] registered activation in the intraparietal sulcus correlated with the subjective experience of Split percepts. As the intraparietal sulcus is likely involved in cross-modal integration [35], it could contribute to bistability in both modalities.
We failed to observe, however, consistent observer-specific biases across modalities. Strong biases would be expected if a single top-down selection mechanism were the sole determinant of the auditory and visual bistability. Another possibility is that some mechanisms of competition between percepts are distributed across modalities, but share common functional principles. In the visual domain, a canonic brain architecture of mutual inhibition between populations of neurons coding for various attributes could explain the similarities between different types of bistability [21]. Inhibition has also been proposed as a functional building block for auditory scene analysis [36]. Distributed competition, as a general computational process, would be useful to resolve perceptual ambiguities irrespective of sensory modality.
Neurophysiological evidence for distributed competition
The hypothesis of distributed competition is consistent with findings of neural correlates of the perception of ambiguous visual stimuli at different levels of neural processing. Using fMRI, correlates of competition have been observed in V1 for binocular rivalry [37-39] as well as other types of visual bistability [40, 41]. Competition between interpretations is also reflected, however, in neuronal populations that code for the specific attributes that are competing: the human
fusiform face area and the parahippocampal place area for binocular rivalry between faces and houses [42], or areas involved in motion processing for rivalry between motion stimuli [43]. Single units recordings in awake macaques also demonstrated correlations with perceptual alternations at different level of the visual cortex [44], specifically in area MT for moving stimuli [45] or in the temporal cortex for more complex objects [46].
Similarly, neural correlates of auditory streaming have been observed at different processing stages. Recordings in primary auditory areas with the ABA- stimulus showed that units with receptive fields centered on the A-tones displayed a reduced response to the B-tones when Split percepts were more likely. This was observed in the primary auditory cortex of awake macaque monkeys [16, 17] and its equivalent in the starlings’ forebrain [20]. A qualitatively different correlate was found using magnetoencephalography [18]. The Split percepts were associated with larger long-latency potentials (P1m and N1m) for the B-tones. These potentials are thought to originate from non-primary auditory areas, the lateral Heschl’s gyrus, the planum temporale, and the superior temporal gyrus. The current data on the neurophysiological bases of bistability in the visual and auditory modalities are thus consistent with a distributed competition hypothesis, although the respective contributions of the various stages remain to be elucidated.
Implications for models of auditory scene analysis
Most models of streaming are based on adaptation, starting from the auditory nerve and brainstem [47] up to auditory cortex [17]. Micheyl et al. [17] found that neural responses to ABA- sequences decrease with presentation time, but with different time constants for A and B tones. The time when responses to B-tones fell below a fixed spike-count threshold predicted accurately the average build-up of streaming observed for human subjects. Within the framework of bistability, such a multisecond-habituation mechanism could account for the specific characteristics of the first perceptual switch (Figure 1A). It would be of interest to extend the adaptation model to account for the dynamics of spontaneous alternations in the stochastic steady-state of streaming. Temporary reversals of the habituation process should then be observed. When the neural data become available, models of visual bistability that include mutual inhibition can provide inspirations to explain these dynamic effects [2].
Distributed or “integrated” competition at different levels of the central nervous system has recently been proposed by Cusack as a model of auditory scene analysis [48]. This approach can accommodate a range of behavioral and neural data, in addition to having desirable computational properties (Cusack 2005, Cognitive Neuroscience Society meeting). Here we have shown that auditory and visual bistability share many features, and that a distributed competition hypothesis is consistent with this finding. Bistability is a means to highlight mechanisms normally used to achieve stable perceptual organization. A potentially useful principle to resolve perceptual ambiguities could be the existence of competition mechanisms, based on adaptation and mutual inhibition, at multiple neural processing stages.
Acknowledgments
The authors would like to thank Christophe Micheyl, Rhodri Cusack, Jan Schnupp, and Alain de Cheveigné for useful comments on previous versions of this manuscript.
Experimental procedures
Auditory stimuli
The auditory stimuli consisted of 4-minute long sequences presented over headphones. A high-frequency pure tone A alternated with a low-frequency pure tone B, in an ABA- pattern. The frequency of A was 587 Hz and that of B was 440 Hz (5 semitones difference). The duration of each tone was 120 ms. The silence ‘-’ that completed the ABA- pattern was also 120 ms long, so making the A tones isosynchronous. Listeners initially adjusted the loudness of the tones to a comfortable level which was maintained constant during the experiment.
Visual stimuli
The visual stimuli consisted of two rectangular-wave gratings presented through a 4-degree radius circular aperture. The gratings comprised thin dark stripes (duty cycle = 0.3, spatial frequency = 0.5 cycle/deg) on a lighter background, and appeared as figures moving over the background. The intersections regions were darker than the gratings (multiplicative transparency). The gratings were moving at 1.2 deg / sec in directions 120 degrees apart. A red fixation point over a 1 degree circular gray mask was added in the middle of the circular aperture and subjects were instructed to fixate this point throughout stimulus presentation.
Procedure
Observers were instructed to report their conscious perception of each stimulus continuously during stimulus presentation. They started with auditory presentation and were asked to decide whether they heard one or two streams. A third, “indeterminate” response type was available if they heard something else or were not sure about their perception at a given instant. Responses were collected via 3 buttons on a computer keyboard. A response indicated by a button press was held until a subsequent button press. In the first run, subjects were simply instructed to pay attention to the stimulus (Neutral task). In the subsequent two presentations, they were instructed to either try to hear a one-stream percept (Group task), or to try to hear a two-streams percept (Split task) in random order of presentation. Judgments with visual presentation of plaids were then performed, with an identical procedure and the
three different tasks (Neutral, Group, Split). Judgments were collected continuously at a sampling rate of 20 Hz. The default response when each run started was “indeterminate”.
Twenty-three observers participated in the experiment (average age: 23) with no self-reported hearing problem and normal or corrected-to-normal eyesight. They gave informed consent to participate to the experiments.
Statistical analyses
A detailed description of all statistical analyses is provided as Supplemental Data. To check whether the switching rate between percepts was stable over time, the first 7 perceptual phases were extracted from each trial of the Neutral task. A planned comparison showed that for both the auditory and visual modalities, the first phase had a longer duration than subsequent ones. With the first phase excluded, best fitting linear trends indicated no significant drift up or down. In order to test whether the distribution of phases followed a lognormal distribution, we transformed the data from all three tasks onto a log scale and performed an analysis of variance. The distribution of residuals of the ANOVA was not statistically different from a normal distribution (Kolmogorov-Smirnov test). Distribution of normalized phases for auditory and visual stimuli in the neutral task were compared with a Kolmogorov-Smirnov test, which exhibited no significant difference. The independence of successive phase durations was assessed on the distribution of correlations between normalized log-phases, for each subject. The effects of intention were estimated on the proportion of the total time spent reporting the Grouped percept and on the average phase duration of the Split and Grouped percept after transforming phase durations to their natural logarithm and excluding the first and last percepts. Repeated measures ANOVAs were performed on theses values with the variable “task” and “modality” (Figure 2A) or “task” and “percept type” (Figure 2B, C) as independent factors. Effects of intention on the duration of percepts were estimated by post-hoc analyses.
References
1. Leopold, D.A., and Logothetis, N.K. (1999). Multistable phenomena: changing views in perception. Trends in Cognitive Sciences 3, 254-264.
2. Alais, D., and Blake, R. (2005). Binocular Rivalry (Cambridge, MA: MIT Press).
3. Bregman, A.S. (1990). Auditory Scene Analysis: The Perceptual Organization of sound (Cambridge, MA: MIT Press).
4. van Noorden, L.P.A.S. (1975). Temporal Coherence in the Perception of Tone Sequences (Eindhoven University of Technology: doctoral dissertation).
5. Hupé, J.M., and Rubin, N. (2003). The dynamics of bi-stable alternation in ambiguous motion displays: a fresh look at plaids. Vision Research 43, 531 - 548.
6. Wallach, H. (1935). Uber visuelle wahrgenommene Bewegungsrichtung. Psychologische Forschung 20, 325-380, trans. Wuerger, S., Shapley, R., and Rubin, N. (1996) Perception 1925, 1317-1318.
7. Parker, A.J., and Newsome, W.T. (1998). Sense and the single neuron: probing the physiology of perception. Annu Rev Neurosci 21, 227-277.
8. Long, G.M., and Toppino, T.C. (2004). Enduring interest in perceptual ambiguity: alternating views of reversible figures. Psychol Bull 130, 748-768. 9. Blake, R., and Logothetis, N.K. (2002). Visual competition. Nature Reviews
Neuroscience 3, 13-21.
10. Blake, R. (1989). A neural theory of binocular rivalry. Psychological Review
96, 145-167.
11. Blake, R., Sobel, K.V., and Gilroy, L.A. (2003). Visual motion retards alternations between conflicting perceptual interpretations. Neuron 39, 869-878.
12. Lehky, S.R. (1988). An astable multivibrator model of binocular rivalry. Perception 17, 215-228.
13. Carter, O.L., and Pettigrew, J.D. (2003). A common oscillator for perceptual rivalries? Perception 32, 295-305.
14. Tong, F. (2001). Competing theories of binocular rivalry: A possible resolution. Brain and Mind 2, 55-83.
15. Warren, R.M., and Gregory, R.L. (1958). An auditory analogue of the visual reversible figure. Am J Psychol 71, 612-613.
16. Fishman, Y.I., Reser, D.H., Arezzo, J.C., and Steinschneider, M. (2001). Neural correlates of auditory stream segregation in primary auditory cortex of the awake monkey. Hear Res 151, 167-187.
17. Micheyl, C., Tian, B., Carlyon, R.P., and Rauschecker, J.P. (2005). Perceptual organization of tone sequences in the auditory cortex of awake macaques. Neuron 48, 139-148.
18. Gutschalk, A., Micheyl, C., Melcher, J.R., Rupp, A., Scherg, M., and Oxenham, A.J. (2005). Neuromagnetic correlates of streaming in human auditory cortex. The Journal of Neuroscience 25, 5382-5388.
19. Cusack, R. (2005). The intraparietal sulcus and perceptual organization. J Cogn Neurosci 17, 641-651.
20. Bee, M.A., and Klump, G.M. (2004). Primitive auditory stream segregation: a neurophysiological study in the songbird forebrain. J Neurophysiol 92, 1088-1104.
21. Rubin, N., and Hupé, J.-M. (2005). Dynamics of perceptual bi-stability: plaids and binocular rivalry compared. In Binocular Rivalry, A. Alais and R. Blake, eds. (Cambridge: MIT Press), pp. 137-154.
22. Sheppard, B.M., and Pettigrew, J.D. (2005). Plaid Motion Rivalry: correlates with binocular rivalry and positive mood state. Perception 35, 157-169.
23. Lehky, S.R. (1995). Binocular rivalry is not chaotic. Proceedings of the Royal Society of London. Series B, Biological Sciences 259, 71-76.
24. Zhou, Y.H., Gao, J.B., White, K.D., Merk, I., and Yao, K. (2004). Perceptual dominance time distributions in multistable visual perception. Biol Cybern 90, 256-263.
25. Murata, T., Matsui, N., Miyauchi, S., Kakita, Y., and Yanagida, T. (2003). Discrete stochastic process underlying perceptual rivalry. Neuroreport 14, 1347-1352.
26. Leopold, D.A. (1997). Brain mechanisms of visual awareness, PhD thesis, Baylor College of Medicine.
27. Logothetis, N.K., Leopold, D.A., and Sheinberg, D.L. (1996). What is rivalling during binocular rivalry? Nature 380, 621-624.
28. von Helmholtz, H. (1866/1925). Treatise on Physiological Optics (Dover, New York: Southall, J.P.).
29. Lack, L. (1978). Selective Attention and the Control of Binocular Rivalry (The Hague: Mouton).
30. Meng, M., and Tong, F. (2004). Can attention selectively bias bistable perception? Differences between binocular rivalry and ambiguous figures. Journal of Vision 4, 539-551.
31. van Ee, R., van Dam, L.C., and Brouwer, G.J. (2005). Voluntary control and the dynamics of perceptual bi-stability. Vision Research 45, 41-55.
32. Levelt, W.J.M. (1968). On Binocular Rivalry (The Hague - Paris: Mouton). 33. Anstis, S., and Saida, S. (1985). Adaptation to Auditory Streaming of
Frequency-Modulated Tones. Journal of Experimental Psychology: Human Perception and Performance 11, 257-271.
34. Cusack, R., Deeks, J., Aikman, G., and Carlyon, R.P. (2004). Effects of location, frequency region, and time course of selective attention on auditory scene analysis. J Exp Psychol Hum Percept Perform 30, 643-656.
35. Calvert, G.A. (2001). Crossmodal processing in the human brain: insights from functional neuroimaging studies. Cereb Cortex 11, 1110-1123.
36. Pressnitzer, D., Meddis, R., Delahaye, R., and Winter, I.M. (2001). Physiological correlates of comodulation masking release in the mammalian ventral cochlear nucleus. J Neurosci 21, 6377-6386.
37. Tong, F., and Engel, S.A. (2001). Interocular rivalry revealed in the human cortical blind-spot representation. Nature 411, 195-199.
38. Polonsky, A., Blake, R., Braun, J., and Heeger, D.J. (2000). Neuronal activity in human primary visual cortex correlates with perception during binocular rivalry. Nature Neuroscience 3, 1153-1159.
39. Lee, S.H., Blake, R., and Heeger, D.J. (2005). Traveling waves of activity in primary visual cortex during binocular rivalry. Nature Neuroscience 8, 22-23. 40. Muckli, L., Kohler, A., Kriegeskorte, N., and Singer, W. (2005). Primary
visual cortex activity along the apparent-motion trace reflects illusory perception. PLoS Biol 3, e265.
41. Murray, S.O., Kersten, D., Olshausen, B.A., Schrater, P., and Woods, D.L. (2002). Shape perception reduces activity in human primary visual cortex. Proceedings of the National Academy of Sciences of USA 99, 15164-15169. 42. Tong, F., Nakayama, K., Vaughan, J.T., and Kanwisher, N. (1998). Binocular
rivalry and visual awareness in human extrastriate cortex. Neuron 21, 753-759. 43. Moutoussis, K., Keliris, G., Kourtzi, Z., and Logothetis, N. (2005). A
binocular rivalry study of motion perception in the human brain. Vision Research 45, 2231-2243.
44. Leopold, D.A., and Logothetis, N.K. (1996). Activity changes in early visual cortex reflect monkeys' percepts during binocular rivalry. Nature 379, 549-553.
45. Logothetis, N.K., and Schall, J.D. (1989). Neuronal correlates of subjective visual perception. Science 245, 761-763.
46. Sheinberg, D.L., and Logothetis, N.K. (1997). The role of temporal cortical areas in perceptual organization. Proceedings of the National Academy of Sciences of USA 94, 3408-3413.
47. Beauvois, M.W., and Meddis, R. (1996). Computer simulation of auditory stream segregation in alternating-tone sequences. J Acoust Soc Am 99, 2270-2280.
48. Cusack, R., and Carlyon, R.P. (2004). Auditory perceptual organization inside and outside the laboratory. In Ecological psychoacoustics, J. Neuhoff, ed. (San Diego: Elsevier Academic Press).
Supplemental data
Stimuli
Illustrations of the stimuli used in the auditory and visual experiments are available at: http://cognition.ens.fr/Audition/sup/
Additional subjects with repeated measurements A 0 0.5 1 B Participant 1 2 3 4 5 6 7 0 0.5 1 Proportion Grouped
Figure S1: Within- and across-subject variability for the proportion of Grouped percepts. Data obtained with a new group of 7 participants who performed 6 repetitions
of the auditory streaming task and plaid task. Experimental procedure and stimuli parameters as in the main experiment, neutral intention. The proportion of time spent in the Grouped percept is shown for each participant, for the auditory (A, dark grey) and visual (B, light grey) modalities. Each dot represents the proportion of Grouped percept in a given run for each participant.
1 3 5 7 9 11 13 15 17 19 21 1 10 100 Phase # Duration (s) A 2 4 6 8 10 12 14 16 18 20 22 1 10 100 Phase # Duration (s) B
Figure S2. The duration of successive percepts in auditory streaming is stable over time. The duration of successive (A) Grouped phases and (B) Split phases is shown for
the new group of 7 participants and 6 repeats. Individual points are the raw values for all experimental runs. Horizontal bars represent the mean of log-durations. Regression lines fitted to the successive phases, except for the first Grouped phase, show no long-term trend in the duration of percepts.
Statistical analyses
Duration of percepts. We first checked whether the switching rate between percepts was stable over time. The first 7 percept durations were extracted from each trial of the Neutral task. This first analysis was restricted to the first 7 switches to be able to include the data from most subjects – 20 subjects for streaming and 23 subjects for plaids. For both the auditory and visual modalities, the first percept had a longer duration than subsequent phases (planned comparison Aud. F(1,133)=14.8, p<10-3, Vis. F(1,154)=40.4, p<10-8). With the first phase excluded, best fitting linear trends indicated no significant drift up or down. Correlation coefficients were calculated on log durations (see [5] for details). Aud. percepts: r = 0.02 p = .84; Vis. percepts: r = 0.13, p = .12. Similar results can be obtained when including more percepts, see Figure S2, Additional subjects with repeated measures.
Test of lognormal distribution. In order to characterize the distribution of percept durations, a large number of observations is needed. These observations are obtained with different observers in different runs. This brings variability into the data which is not related to the nature of the distribution of percept durations per se. For instance, if the data of a fast switcher are aggregated with those of a slow switcher, a bimodal distribution is obtained. Most investigators of bistability use “normalized” distributions to correct for this variability, that is they divide all phase durations by the average duration for each experimental run. This is how we obtained the data presented in Figure 1C, D. While this method is useful to illustrate the shape of the distribution, it is statistically questionable when dealing with strongly asymmetrical distributions like the gamma or lognormal distribution. The “mean” is very different from the mode and the median of the distribution and its exact value strongly depends on the presence of extreme values. A more rigorous way of testing the shapes of distributions is the indirect method proposed by Hupé and Rubin [5]. In order to test whether the distribution of phases followed a lognormal distribution, we transformed the data onto a log scale (natural log of durations) and performed an analysis of variance. For this analysis, we pooled together the results for the three different tasks on a given modality in order to increase the power of the statistical test. The analysis was performed with subjects as a random factor, task and
percept as fixed factors, and interactions were taken into account. The distributions of residuals of the ANOVAs were not statistically different from a normal distribution, validating the log transformation and showing that the original distributions were indeed lognormal (Tables S1, S2, Figure S3).
Independence between successive durations. Figure 1 E, F indicates that, overall, there is no strong correlation between successive phase durations. The data points, however, pools together observers with different switching rates (Fig. 3A) and proportion of time spent in the Grouped percept that were not always 50% (Fig. 3B). In order to handle inter-individual differences, correlation coefficients between successive durations were computed for each subject. t. Phase durations were transformed to their natural logarithm. The first and last percepts were excluded, as the first one is longer that the others (Figure 1A, B) and the last one was interrupted by the end of the stimulus presentation. Phase durations were then normalized: each log duration was divided by the mean of the log durations for each run and each percept type. Mean r values (and standard deviations) across the population were: r=0.13 (0.20) for auditory bistability and r=0.08 (0.16) for visual bistability. These values were not significantly different from zero (Aud.: p = 0.12, Vis.: p = 0.10, Non-Parametric Sign test). We also found no significant correlation when testing independently each transition type (from Split to Group and from Group to Split), nor when testing possible correlations between a given Group (or Split) epoch and the next Group (or Split) epoch [21].
Effects of intention. Different measures were computed for each 4-minute run: the proportion of the total time spent reporting the Grouped percept, and the average phase duration of the Split and Grouped percepts. The first and last percepts were discarded, which led to exclude from these group analyses 3 subjects who had experienced less than three percepts in one of the conditions. Phase durations were transformed to their natural logarithm. Repeated measures ANOVAs were performed on theses values, with the variable “task” and “modality” (Figure 2A) or “task” and “percept type” (Figure 2B, C) as independent factors. The ANOVA tables are presented in Tables S3, S4 and S5.
The effects of intention on the duration of percepts were estimated by post-hoc analyses. Intention shortened the unwanted percept mean duration: Aud. Group task vs. Neutral, p = 0.002 for the Split percept; Aud. Split task vs. Neutral, p = 0.001 for the
Grouped percept; Vis. Group task vs. Neutral, p = 0.0001 for the Split percept; Vis. Split task vs. Neutral: p = 0.03 for the Grouped percept. Intention did not, however, lengthen the target percept: Aud. Group task vs. Neutral, p = 0.77 for the Grouped percept; Aud. Split task vs. Neutral, p = 1.0 for the Split percept; Vis. Group task vs. Neutral, p = 1.0 for the Grouped percept; Vis. Split task vs. Neutral, p = 0.99 for the Split percept. All post-hoc Tukey tests, df = 38.
Table S1: ANOVA table for the Auditory experiment. Each percept duration is
considered as an independent measure. Missing values are due to the fact that 3 subjects experienced less than 3 percepts in one of the conditions.
Effect Degr. Of Freedom
F p
Intercept Fixed 1 11511 < 10-6
Subject Random 22 2.1 0.04
Intention task Fixed 2 42 < 10-6
Percept Fixed 1 0.26 0.61
Subject * Intention Random 0
Subject * Percept Random 22 9.5 < 10-6
Intention * Percept Fixed 2 286 < 10-6
Subject * Intention * Percept
Random 0
Error 1543
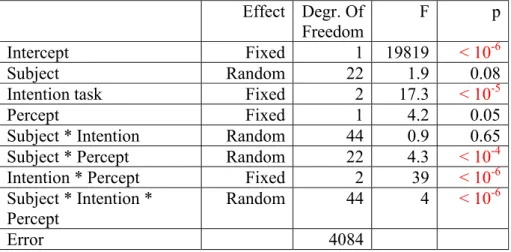
Table S2: ANOVA table for the Visual experiment. Same format as Table S1.
Effect Degr. Of Freedom
F p
Intercept Fixed 1 19819 < 10-6
Subject Random 22 1.9 0.08
Intention task Fixed 2 17.3 < 10-5
Percept Fixed 1 4.2 0.05
Subject * Intention Random 44 0.9 0.65 Subject * Percept Random 22 4.3 < 10-4
Intention * Percept Fixed 2 39 < 10-6
Subject * Intention * Percept
Random 44 4 < 10-6
Figure S3: Residuals for the ANOVA for the Auditory (left) and Visual (right)
experiments, after log-transformation of the durations. The residuals are not different from a normal distribution
Table S3: Statistics on the proportion of grouped percept (Fig 2A, all 23 subjects). One
proportion was computed for each 4-minute run. Degr. Of
Freedom
F P
Modality (audio or visual) 1 0.3 0.57 Error 22
Task (“intention”) 2 103 < 10-6
Error 44
Modality * Task 2 22 < 10-6
Error 44
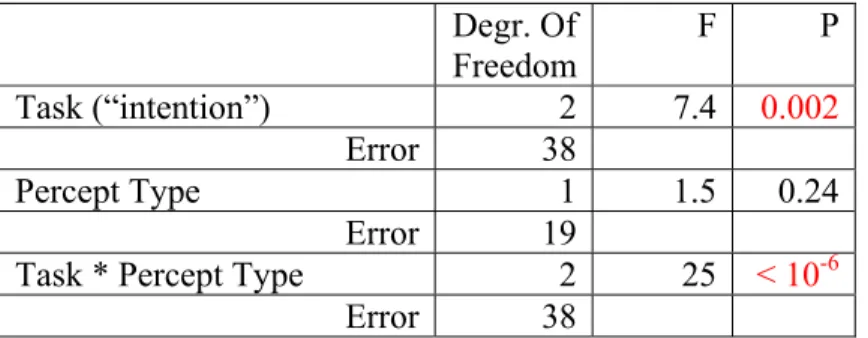
Table S4: Statistics on the average log percept durations in the auditory modality (Fig
2B, 20 subjects). Two durations (Gouped and Split percept type) were computed for each 4-minute run. Degr. Of Freedom F P Task (“intention”) 2 7.4 0.002 Error 38 Percept Type 1 1.5 0.24 Error 19
Task * Percept Type 2 25 < 10-6
Error 38
Table S5: Statistics on the average log percept durations in the visual modality (Fig 2C,
20 subjects). Same format as table S4. Degr. Of Freedom F P Task (“intention”) 2 5.7 0.007 Error 38 Percept Type 1 0.88 0.36 Error 19
Task * Percept Type 2 21 10-6