Publisher’s version / Version de l'éditeur:
Vous avez des questions? Nous pouvons vous aider. Pour communiquer directement avec un auteur, consultez la première page de la revue dans laquelle son article a été publié afin de trouver ses coordonnées. Si vous n’arrivez pas à les repérer, communiquez avec nous à [email protected].
Questions? Contact the NRC Publications Archive team at
[email protected]. If you wish to email the authors directly, please see the first page of the publication for their contact information.
https://publications-cnrc.canada.ca/fra/droits
L’accès à ce site Web et l’utilisation de son contenu sont assujettis aux conditions présentées dans le site LISEZ CES CONDITIONS ATTENTIVEMENT AVANT D’UTILISER CE SITE WEB.
Handbook on Urban Sustainability, pp. 283-314, 2006-12-01
READ THESE TERMS AND CONDITIONS CAREFULLY BEFORE USING THIS WEBSITE.
https://nrc-publications.canada.ca/eng/copyright
NRC Publications Archive Record / Notice des Archives des publications du CNRC : https://nrc-publications.canada.ca/eng/view/object/?id=caebf15e-b049-4188-ad0f-ac425476e2bf https://publications-cnrc.canada.ca/fra/voir/objet/?id=caebf15e-b049-4188-ad0f-ac425476e2bf
Archives des publications du CNRC
Access and use of this website and the material on it are subject to the Terms and Conditions set forth at
Towards sustainable municipal infrastructure asset management
Cha pt e r 7 : Tow a rds Sust a ina ble
M unic ipa l I nfra st ruc t ure Asse t
M a na ge m e nt
N R C C - 4 8 1 9 4
V a n i e r , D . J .
A v e r s i o n o f t h i s d o c u m e n t i s p u b l i s h e d i n
/ U n e v e r s i o n d e c e d o c u m e n t s e t r o u v e
d a n s : H a n d b o o k o n U r b a n S u s t a i n a b i l i t y ,
C h a p t e r 7 , 2 0 0 6 , p p . 2 8 3 - 3 1 4
MANAGEMENT -
Dana J. VanierBy :
Dana J. Vanier
7.1 Sustainable municipal structure
This chapter describes methods and techniques required to support the general concept of sustainable municipal infrastructure. The author’s hypothesis is that implementing proper asset management techniques can lead to sustainable municipal infrastructure. A municipal infrastructure asset management methodology is presented in this chapter.
It must be made clear at this time that the author does not examine ‘green infrastructure’ or ‘environmentally-friendly’, innovative technologies in this chapter. This chapter focuses on one cold, hard question: is it possible for the city’s tax revenues to maintain and renew its extensive, growing and diverse selection of infrastructure, two or three generations into the future? This task is difficult enough to accomplish, as many cities are finding, without having to address the other complexities discussed in this book. This is not to say that these other agendas are of lesser importance, but rather that the municipal infrastructure must first be economically sustainable, and many municipalities are still far from being able to achieve this goal.
Fortunately in most municipalities, the forebears have paid off the existing municipal infrastructure assets (they did produce sustainable infrastructure);
the
current city caretakers are only responsible for the maintenance and the renewal expenditures for this existing infrastructure. Typically, annualmaintenance expenditures on infrastructure assets should average approximately 2% of the value of the assets1 (NRC 1990, CERF 1996, Vanier and Rahman 2004). This number is a rough average that takes into
1
2% to 4 % of the current replacement value is the recommended expenditure each year on maintenance; few municipalities come close to 4% (Vanier and Rahman 2004).
account the maintenance cost differences between asset classes and the increasing maintenance costs over time. In general, if this level of maintenance funding is not supported, then the assets will deteriorate more rapidly, will cost more to repair, or will have to be renewed prematurely.
Renewal expenditures, on the other hand, are related to the service life of the asset. That is, if the asset has a service life of 50 years, then roughly 2 % of its replacement value should be ‘saved’2 per year to ensure that it can be replaced at the end of its service life; otherwise it is not sustainable. If assets are replaced prematurely or are replaced too late, then it is more costly to the city.
These two general rules of thumb mean that in order for a city’s infrastructure to be economically sustainable, 4% (i.e. 2% for maintenance and 2% for renewal) of the current replacement value (CRV) of the municipal infrastructure must be available to ensure that the existing infrastructure is in good working condition and that the old assets will be renewed when required. Since very few municipalities have reserve funds to cover these costs, the 4% has to be funded on a year-by-year basis from taxes or service rates.
In addition, if the municipal infrastructure portfolio increases in value, then future generations will be encumbered with the maintenance and renewal costs of those additional assets as well. Likewise, if the tax revenues shrink then the city must be prepared to decommission surplus assets, which is also an expense.
7.2 Deteriorating municipal infrastructure
There is no need to dwell on the situation of deteriorating municipal infrastructure, as there has been considerable well-documented concern about the current state of municipal infrastructure (ANAO 1996, CSCE 2003, WIN 2003, Vanier and Rahman 2004). In Canada, generally the problems relate to the following causes or symptoms:
Aging and deteriorating infrastructure.
Lack of funding (all levels of government, downloading of responsibilities from higher levels of government).
2
In large organizations, these funds are not banked but obtained from annual city tax revenues.
Pollution - health issues (e. coli, toxic wastes). Scarce resources (oil, water, lumber), and
Demographic and population shifts (baby boomers, generation-X, sun belt growth).
Given the current situation of aging infrastructure, the following challenges exist (the challenges in the New World, are similar to those of the established municipalities of Europe or the rapidly growing municipal economies of Asia):
o Many municipalities do not know the extent and/or the value of their infrastructure assets.
o Some cities are not aware of the amount of their deferred maintenance or their renewal requirements.
o There is little knowledge about how specific classes of assets deteriorate.
o The technical service life of many classes of infrastructure assets is not known.
o There are considerable amounts of non-digital data in this community.
o Decision support tools are not available to infrastructure managers and decision makers.
In addition, there is a considerable amount of municipal infrastructure to manage and to replace; a rough estimate of the value of municipal assets in Canada (with a population of 32 million) is over € $615 billion (Vanier and Rahman 2004).
7.3 What is municipal infrastructure asset management?
The managers in a municipality must manage a large and diversified set of built assets ranging from complex underground networks (e.g. water distribution, sewers) to buildings, roadway systems to parks, and transit systems to water treatment plants. These municipal assets are collectively known as municipal infrastructure but the city might also be responsible for some social housing, police stations, vehicles, and maintenance depots. All these built assets are subject to deterioration due to aging, geological conditions, climate, usage or changes in use.
Recent years have seen a lack of adequate funding for maintenance and renewal. As a result, certain components of municipal infrastructure have been neglected, or at most receive only remedial treatments. Consequently,
these municipal assets have little chance to reach their predicted service life. Therefore, city managers are continually faced with challenges regarding when and how to inspect, how to maintain, when to repair, where to renew, and what to replace in their infrastructure portfolio. In addition, these decisions must take place across a diverse set of facilities (historical, old, new, costly, popular, roads, bridges, sewers, buildings, etc.).
Few tools exist in the form of standards, guidelines, technical literature, or best practices to assist in decision-making. Information technology (IT) solutions claiming to address the needs of infrastructure management are now coming into prominence in the developed world.
7.4 Definitions
A number of definitions are needed to support this discussion on managing municipal infrastructure. The Canadian Oxford Dictionary defines ‘infrastructure’ as “the basic structural foundation of a society or enterprise; roads, bridges, sewers, etc. regarded as a country's economic foundation”. Many organizations are now employing the term civil infrastructure systems (CIS) to encompass this type of built asset and to distinguish it from other forms of infrastructure that can exist in a city such as computer networks, telephone systems, fiber optic networks, etc. In some cities or countries municipal government also controls these infrastructure networks.
Municipal infrastructure can be seen as a subset of CIS and includes those infrastructure assets typically managed by municipalities. These include, but are not restricted to the following: buried utilities, roads, transit systems, bridges, water/sewage treatment plants and parks. Some jurisdictions could also be responsible for a variety of buildings (i.e. police stations, fire halls, indoor swimming pools, arenas and community centers) but their responsibility could also extend to other types of buildings such as social housing, schools and vehicle maintenance depots. The type and the amount of municipal infrastructure inventory in a city is a reflection of its geography, needs and history. That is, bridges might predominate in one municipality, whereas it could be roads or buildings in another. Again, it must be reiterated that municipal infrastructure asset management deals with a diverse set of assets.
National Research Council’s (NRC) project on Municipal Infrastructure Investment Planning (MIIP 2005) has selected the following definition for asset management:
Asset management is a business process and decision-support framework that: (1) covers the extended service life of an asset, (2) draws from engineering as well as economics, and (3) considers a diverse range of assets.
The term maintenance covers a wide selection of processes that are needed to support municipal infrastructure operations, specifically: inspection, preventive maintenance, and repair. Maintenance ensures that an asset reaches the desired service life. The term renewal is used to mean
rehabilitative, replacement or renewal interventions on municipal
infrastructure that has reached its service life. These renewal actions provide the municipality with ‘as-new’ infrastructure with a new, and perhaps different, service life.
7.4.1 Why municipal infrastructure asset management?
Asset management is not a new science, process or methodology; cities have been managing assets for thousands of years. However, new legislation in a number of countries such as USA, Australia and Canada is compelling municipalities to record properly the extent and the condition of their municipal assets.
The US Governmental Accounting Standards Board (GASB), a non-profit organization, published a financial reporting standard in June 1999 to dictate how State and local governments must present their financial statements. GASB Statement 34 (Basic Financial Statements—and Management’s Discussion and Analysis—for State and Local Governments) requires municipal, local and state authorities to account for their assets and to identify them in their financial statements (GASB 2001).
Statement 34 attempts to establish and improve “standards of state and local governmental accounting and financial reporting that will result in useful information for users of financial reports and guide and educate the public, including issuers, auditors, and users of those financial reports”. ‘Long lived’ assets3 including buildings, land and infrastructure must be reported in a city’s financial statement. Statement 34 provides for two methods to report the infrastructure owned by governmental authorities: (1) straight depreciation method (traditional), referred to as the Standard Reporting Approach, and (2) the Modified Approach.
3
The term ‘long lived’ refers to assets that have initial useful lives beyond one reporting period.
The traditional approach requires reporting the annual cost of using the capital assets including the operating and maintenance costs, as well as depreciation costs.
The Modified Approach requires information on the current physical condition and long-term maintenance needs of the infrastructure assets. In the Modified Approach, infrastructure assets do not have to be depreciated if the city uses an asset management system and assets are maintained at a pre-established condition. The GASB implementation schedule is dependent on the size of the agency (GASB 2003):
“… all governments have a minimum of two years to get ready to publish the new financial statements, and smaller governments have as many as two additional years to prepare (The largest governments must prepare the new statements for fiscal years beginning after June 15, 2001)”.
In the province of Ontario, Canada, the provincial government recently established the Sustainable Water and Sewage Systems Act, 2002. This Act applies to all municipalities that provide water and wastewater services to the public (Bill 175 2002). These designated municipalities are required to prepare a report detailing their water and wastewater services. The annual report must include an inventory and management plan for the water and wastewater services, a certification of this plan by a professional engineer, and an assessment of the total cost of providing these services including revenues. The Act specifies that the total cost of providing services should include water source protection costs, operating costs, financing costs, renewal and replacement costs, and improvement costs. This Act is known locally as ‘Bill 175’.
The National Guide to Sustainable Municipal Infrastructure (Guide 2003) is funded under the Infrastructure Canada Program (ICP) and managed by the Federation of Canadian Municipalities (FCM) in partnership with the National Research Council of Canada (NRC). The four-year project started in 2001 and has a budget of € 16 million. The InfraGuide provides a road map to the best available solutions (i.e. Best Practices) for addressing municipal infrastructure issues. It also serves as a focal point for a Canada-wide network of practitioners, researchers, and municipal governments focused on infrastructure operations and maintenance. The Guide addresses six target areas:
Environment protocols.
Municipal roads and sidewalks.
Transit.
Potable water (production and distribution), and Storm and wastewater.
Stakeholders from Canadian municipalities and infrastructure specialists from across Canada assist engineering consultants to develop these Best Practices. The Best Practices help municipalities identify needs, evaluate solutions, and plan for long-term sustainable solutions for improved infrastructure. A total of 50 Best Practices have been published to date.
The Australian National Audit Office (ANAO) is a public sector organization providing audit services to parliament and commonwealth public agencies. The ANAO assists the Auditor-General by providing an objective evaluation of the performance and financial management of public sector agencies. ANAO’s Asset Management Handbook (ANAO 1996) provides an overview of asset management principles, instructions on the application of asset management principles and concepts, a selection of case studies, and a glossary of terms. The Australian National Audit Office found that:
Most organizations can benefit from proper asset management strategies.
Asset management strategies should integrate with other strategic planning processes.
Alternatives should be considered when purchasing and replacing assets.
Life-cycle (see Glossary) costing analysis should be used.
Improved asset management can occur from proper codification of costs of assets, and
Regular inspection of the condition and performance of assets, combined with careful planning for replacement, can maximize the return on investment.
The ANAO has also published a better practice guide entitled the Asset Management Guide (ANAO 1996a).
This author believes that the introduction of USA’s GASB Statement 34, Ontario’s Bill 175 and the Australian asset management activities have contributed to the recent ‘popularity’ in asset management and have promoted the implementation of asset management techniques and the use of asset management software.
7.4.2 What is the state of municipal infrastructure asset management?
North America has seen many reports, in both the popular press and technical literature, on the state of deteriorating public assets. For example, Macleans and Time magazines have had a number of articles related to the state of infrastructure. More recently, the American Society for Civil Engineers gave USA’s civil infrastructure a failing grade of D in its 2005 Report Card for America's Infrastructure (ASCE 2005).
A recent study of Canadian municipalities identified reasons for concern about the state of its municipal infrastructure (Vanier and Rahman 2004):
44% of respondents did not know that suggested levels of investment4 are available, and
21% of respondents were unable to identify their actual level of investment.
Other reasons for concern identified in this study are that Canadian municipalities desire more maintenance funding than they currently receive:
77% of respondents desired the recommended 2% to 4% annual maintenance funding;
70% were spending less than 2%;
9% of respondents desired at least four times as much as they currently receive, and
60% of respondents desired at least 50% more than they were currently receiving.
The study concluded that:
Canadian municipal assets were rated as 2.9 or ‘good’ to ‘fair’ from a range of 7 ratings (excellent = 1, very good, good, fair, poor, very poor and failed = 7).
The condition of assets is skewed to the better side of the range. 50% of the assets were at least 30 years old, and
4
Federal governments in North America recommend spending annually 2% to 4% of the current replacement value of its assets on maintenance (NRC 1990).
25% of assets were between 20 and 30 years old: -- therefore in 10 years, without any renewal, the proportion of +30 year old assets will be 75%.
The identified contributors to the current situation included the age of assets, political inaction, expanded need for facilities, and inflation.
In general, the study determined that municipal infrastructure managers were able to provide reliable answers to the first three whats of asset management (Vanier 2001): what do you own, what is it worth, and what is
deferred. However, these same managers were not confident about their
answers regarding the last three whats: what is the condition, what is the
remaining service life and what do you fix first.
7.4.3 How can municipal infrastructure be sustainable?
A common definition of ‘sustainable’ exists for most industries, and an appropriate one is from CIB’s Agenda 21 on Sustainable Construction (Agenda 21 1999)(see also section 3.1 in Chapter 3):
“development that meets the needs of the present without compromising the ability of future generations to meet their own needs.”
The following quotation summarizes the challenges of managing a diverse network of municipal infrastructure assets
“The main goal of asset management is to maintain the condition of the assets at acceptable performance levels at minimum cost or within the budget constraints.” (Halfawy 2004)
There are many ‘unknowns’ in this equation including definitions of ‘acceptable performance’, ‘minimum cost’ and ‘maintain the condition’. As mentioned earlier, many municipalities have portfolios of extensive assets, and in many cases, these cities are experiencing growth.
7.5 Six simple questions with six difficult answers
Municipal infrastructure assets can be sustainable. This chapter deals more with the engineering and economic aspects of assets; as a result, it is focusing on producing the objective numbers needed to make municipal infrastructure assets sustainable. Municipal infrastructure asset management can be viewed as six simple questions with six difficult answers:
What do you own? What is it worth? What is deferred? What is the condition?
What is the remaining service life? What do you fix first?
The sequence of these questions is important: the answers to the first questions are needed to answer the questions following. In addition, the first questions are easier to answer; that is, they require fewer resources.
7.5.1 What do you own?
The first question that should be answered in this quest for sustainable municipal infrastructure asset management is what do you own. This appears to be a trivial question, but many municipalities might not have accurate records of their portfolio for any number of reasons. Among these are: inaccurate construction drawings (as-builts), inconsistent maintenance records, incompatible asset records after amalgamation of adjoining municipalities, or informal procedures to manage asset knowledge by city workers. How can a municipal asset be maintained (and sustainable for that matter) if the city does not know who owns it?
So, this first question has to do with the actual ownership of city property and assets. Municipal infrastructure asset managers must know the extent of the city’s assets as well as specific administrative and engineering details about individual assets. Typically, the answer to this first question requires an inventory system. An inventory system (whether it is a computerized maintenance management system - CMMS, spread sheet, database or set of inventory cards) should include an enumeration, classification, and description of all assets contained in the municipal infrastructure portfolio according to a preset classified list (buildings, buried utilities, roads, sidewalks, curbs, bridges, culverts, land, etc.). Aside from the standard infrastructure assets, the municipal portfolio could include ‘non-construction’ assets under the responsibility of the public works organization such as vehicles, trailers, playground structures, highway appurtenances, and street signs.
7.5.1.1 Inventory systems
A file structure, whether it is manual or electronic, is required to store and classify essential information about every type of municipal infrastructure asset. This should include information about the asset location, type, physical description, responsibility, installation date, material, dimensions, etc. In addition, for specific types of assets there should be an adequate number of fields to store pertinent information about this type of asset. For example, data stored about building assets should include the gross area, location, height, date of construction, number of floors, etc. Inventory data about buried utilities should include the pipe material, pipe diameter, pipe thickness, pipe depth and associated maintenance holes (aka manholes).
Table 7.1 lists typical classes and subclasses of municipal infrastructure assets. This list is not intended to be exhaustive, but to indicate the breadth of municipal infrastructure.
Table 7.1 Classes and subclasses of municipal infrastructure assets
Buried utilities Roads/Roadways Roadway
appurtenances Bridges Water Sewer Storm Sewer Electrical Telephony Gas Telecommunication Other (Name) Roadways Parking Lots Curbs Sidewalks Drainage Culverts Landscaping Other (Name) Standards Signs Barricades Guard Rails Other (Name) Road surface Deck Abutments Piers Other (Name)
Buildings Treatment plants Parks and grounds Vehicles Architectural Electrical Mechanical Structural Other (Name) Structure Equipment Other (Name) Parks Structures Landscaping Benches Trees Other (Name) Road Repair Snow Clearing Trailers Other (Name)
Most municipalities in the world are in the process of changing from paper-based systems (drawings and inventory cards) to electronic databases (computer-aided design – CAD, CMMS, and geographic information systems – GIS) to store their inventory. It might take decades for some cities to
complete this transition; as a result, a hybrid system consisting of both paper-based and electronic records will exist for many cities, for many years into the future. Which data to collect and in which format (paper-based or electronic), are questions being asked by most municipalities.
The answer is not straightforward, as it depends on many factors: cost of data collection, format of existing data, current cost of data retrieval, accuracy of existing information, degree of computerization of city records, etc. Computerization of inventory records is no longer a question of ‘if’, but it is now a question of ‘when’. Two rules of thumb are proposed: (1) if good paper-based records already exist – keep them in that format for now, and (2) if poor or no records exist – make all efforts to collect data electronically. 7.5.1.2 Where is it?
This question is not in the original list of whats, -- perhaps it should be rephrased as what is the location. In the past and present, this answer has relied on access to accurate drawings and plans. In the future, the answer to this question will be a geographic information system or GIS.
GIS is not a new technology as it was first investigated for engineering applications as early as 1950. Recent surveys (Vanier and Rahman 2004; Vanier 2004) have shown the growth in popularity of this technology as a decision-support system (DSS) for municipal infrastructure management. GIS’s main contribution to what do I own is the physical location of the asset. If the GIS database is properly structured, it can also save a considerable amount of valuable information about the relationship of a specific asset to its neighboring assets. For example, if the contact coordinates (e.g. phone number) of property owners can be linked to the same database as the water distribution network, it is a relatively simple task for the municipality to contact property owners when services are to be disrupted.
Much has been written about the advantages of using GIS to manage municipal infrastructure (Vanier 2005); however, this solution can be an expensive one. Fortunately, many municipalities are using GIS in their day-to-day administrative and political operations, so the public works managers can benefit from these earlier implementations.
The same two rules of thumb regarding the dilemma of when to move from paper-based to electronic data apply to GIS implementation: (1) if good paper-based records already exist – keep them in that format for now, and (2) if poor or no records exist – make all efforts to collect data electronically.
7.5.2 What is it worth?
The second question to be answered in this quest for sustainable municipal infrastructure asset management is what is it worth. Another general rule of thumb applies here: the more it is worth, the more expensive it is to repair or replace. Therefore, it is important to know the answer to this question before decisions are made to maintain or renew a failing asset. Answering this question adds extra data to the inventory records and makes for better support of decision-making.
The second question is not: what did it cost or what is the replacement
value, but the more complex question what is the asset’s worth to the organization. The analogy to an individual’s car or house immediately
identifies the complexity of this issue: what is the price of a new ‘equivalent’ car; what is the market value of my home; what could I get for my used car; how much would it cost to rebuild my current home, or could I rent instead and what would it cost? Therefore, the value of an asset can be represented in many ways.
The historical value is the original ‘book value’ of the asset: it is the recorded construction cost (minus all the design, planning and maintenance costs). Typically, in many municipalities this is the only value that is recorded, maintained, and used.
The appreciated historical value is the historical value brought up to current value using multipliers reflecting the annual changes in construction costs (ENR 1999). The Engineering News Record (ENR) Construction Cost Index (CCI) data are based on historical costs (averaged over 20 cities in the USA and two in Canada) for 200 hours of weeks of common labor. The Building Cost Index (BCI) data are based on two weeks of skilled labour (carpenter, bricklayers, and structural ironworkers). The CCI and BCI material costs are both based on the cost of a standard weight of structural steel, portland cement, and processed lumber. This historical value updating therefore takes into account annual inflation or deflation. ENR uses the year 1913 as the base year (value = 100). For example, an asset constructed in 1960 has a multiplier of CCI = 824 (BCI = 559), whereas a multiplier of CCI = 6000 (BCI = 3425) is applied to an asset built in January of 1999. Therefore, a construction project completed in 1960 for € 1 million has a value of € 1 million X 6000 / 824 or € 7.28 million. A building constructed at the same time has a 1999 value of € 1 million X 3425 / 559 or € 6.13 million.
Current replacement value is the cost of replacing the asset today using
current construction techniques. Typically, this is calculated on per unit cost (i.e. per length, area or volume). Sometimes multipliers are available for different types of construction or for different cities (RSMeans 2002). It is recognized that sometimes an exact replacement is not available and the cost of a replacement that provides equivalent functionality must be calculated.
Performance-in-use value is the calculated value of the actual asset for
the user (Lemer 1998). This value takes into account the actual performance of the asset as opposed to the current replacement value. That is, if an asset is too large or is under-utilized, then the value of a more suitable asset (smaller, ‘right-sized’) is substituted.
The deprival cost is the “cost that would be incurred by an entity if it were deprived of an asset and was required to continue delivering programs/services using the asset” (ANAO 1996). It is a term used predominantly in Australia, but reflects the subtleties of establishing what is
it worth. For example, what would the city do if it did not have access to its
city hall? The deprival cost might be the cost of leasing the vacant office building across the street.
The market value is the value of an asset if it were sold on the open market today. In many instances, the market value cannot be used for municipal infrastructure; however, it is applicable to many types of assets such as buildings or unoccupied land. The recent interest in public-private partnerships (PPP) throughout the world is opening up opportunities for funding municipal infrastructure projects (examples include bridges, toll-roads, municipal buildings) and for relating municipal infrastructure assets to market values. The definition for PPP proposed by The Canadian Council for Public-Private Partnerships (CCPPP 2005) is a “cooperative venture between the public and private sectors, built on the expertise of each partner, that best meets clearly defined public needs through the appropriate allocation of resources, risks and rewards”.
A comprehensive asset management system should include a minimum of two fields to record the value of an asset. Typically, organizations record the cost of construction and an estimate of the current replacement value. In addition, a comprehensive asset management system should associate or link all on-going maintenance and renewal costs to the corresponding asset. A comprehensive system should also calculate the present value of these costs using standard life cycle costing methods (ASTM E917).
7.5.3 What is deferred?
The third question that needs to be answered for achieving sustainable municipal infrastructure asset management is what is deferred. Knowing the extent of outstanding work is akin to knowing the balance outstanding on one’s credit card, or one’s deficit in the budget. Not unlike the previous question what is it worth” this question can have numerous answers. What is meant by deferred? Does it include capital renewal?
Deferred maintenance (DM) can be defined as the cost of maintenance (and not renewal) that has been postponed or phased for future action that would bring the asset to its original potential.
Renewal, on the other hand, is the replacement of an asset at the end of its service life or because of economic, obsolescence, modernization, or compatibility issues. Renewal includes examples such as the rehabilitation of an existing bridge that results in an ‘as-new’ bridge.
Comprehensive asset management systems include a method to calculate the Facility Condition Index (NACUBO 1991) for the various classes of municipal inventory assets in the portfolio.
FCI = Deferred Maintenance (DM)/Current Replacement Value (CRV) As the simple example in Table 7.2 illustrates, the FCI can be used as a simple metric to rank maintenance activities; that is, the higher the FCI, the higher the priority for maintenance intervention. It can also be used as a rough guide for the condition of an asset, if no other method has been implemented.
Table 7.2 What is deferred?
Asset class Deferred maintenance
Replacement
value FCI Priority Building A € 640,509 € 6,967,000 9.19 % - Architectural € 216,011 € 2,345,000 9.21 % 4 Mechanical € 30,241 € 1,267,000 2.39 % 7 Structural € 242,234 € 2,134,000 11.35 % 3 Electrical € 152,023 € 1,221,000 12.45 % 2 Water € 239,391 € 23,359,000 1.02 % 6 Storm € 326,239 € 10,031,000 3.25 % 5 Sanitary € 956,000 € 6,451,000 14.82 % 1
One can question the value of such numbers to an organization. Hypothetically, the FCI could be based on two inaccurate numbers: a very rough approximation of the deferred maintenance and an old historical cost of the asset. On the positive side, if no other data are available for prioritization of projects, then using the FCI as the metric is objective and directs maintenance funding to the assets with the highest proportion of deferred maintenance.
A sub-classification of the deferred maintenance is proposed by the City of Edmonton (Edmonton 2004). In this methodology, the deferred maintenance gap is sub-categorized: suitability gap, functionality gap and condition gap. The suitability gap is the difference between the current and the required suitability of an asset. Suitability is defined as the quality of having the properties that are right for a specific purpose. For example, the combined sewers in a municipality are not suitable in this era; however, millions of Euros are required to separate the storm from the sanitary sewers.
The functionality gap is the cost difference between the current and the required functional requirements of an asset. For example, the asset can be a swimming pool in perfect condition, but it is centimeters short of the Olympic length needed for competitions.
The condition gap is more like the DM described above.
The suitability and the functionality gaps, in many cases, have more to do with renewal than with maintenance, as little will be done with these assets until the end of their service life. These two gaps should be lumped with those renewal projects where the asset is at the end of its service life. This differentiation leads to the obvious conclusion that municipalities should have two categories of deferred work: deferred maintenance and deferred
renewal.
7.5.4 What is the condition?
The fourth question deals with trying to establish what is the condition of the asset and portfolio. This question cannot be properly answered until the extent of the municipal inventory, the value of the city’s assets, and the amount of deferred maintenance and renewal are objectively quantified. Like the previous question, this one is also complex: what is the condition; what is the performance; what is the desired functionality; what is the desired level of service, or how much better or worse is an asset performing than the desired functionality?
In this chapter, the term condition is used in a very broad sense, covering areas such as the physical state, hydraulic performance, structural strength or even aesthetics of the asset. Performance can be defined as the capability of a facility to perform the function(s) for which it is designed, used, or required to be used”. The term performance is used in the context of how well the asset performs its functions, a subset of condition. The subtle differences between the two terms become obvious after examples of condition assessment are presented below.
Protocols for determining the condition of assets are not yet available for the full spectrum of municipal infrastructure. In fact, few researchers and practitioners are in agreement as to how and whether existing techniques can be used to evaluate the condition of an asset. It could be decades before standardized protocols are used consistently in one municipality, and some infrastructure assets might never have objective protocols. For example, will we ever see a method to evaluate the condition or performance of wetlands?
There are many techniques, either subjective or objective, to rate5 the condition of an asset, for example: (1) satisfaction surveys, (2) subjective evaluations, (3) engineering calculations, (4) weighted factors, (5) distress-based metrics, or (6) hybrid systems.
Satisfaction surveys are one way to have the user or maintainer of an
asset evaluate its condition. Examples include benchmarking studies (OMBI 2003) and post-occupancy evaluation (FFC 2002). Benchmarking rates the overall condition of an asset (or organization) according to a number of predetermined key performance indicators (KPI). Typically in a post-occupancy evaluation, the evaluation team selects a representative number of occupants or users of the service; it establishes the criteria to be rated (e.g. heating quality, water clarity, response time), and it assists the users/owners to determine the importance of each criteria. The results of the evaluations (i.e. ranking the satisfaction levels from a spectrum of fully satisfied to fully dissatisfied) form the rating of the asset (Aronoff and Kaplan 1998).
Subjective evaluations rate an asset according to predefined
organizational standards. Typically, scales such as 1 to 5, A to F, or ‘failed’ to ‘excellent’ are used to rate the condition of the asset or its components. Descriptions of the ratings can also be provided by the organization (1 or failed -- replace asset immediately; 5 or excellent -- minimal maintenance required, as new condition). Owing to the subjectivity of the evaluation
5
The term to rate is used to mean an objective inspection and assessment of how well the asset performs its mandatory functions.
process, it is difficult for these metrics to be used outside a specific organization. Subjective evaluations have an advantage that they are relatively easy to implement and can be expanded to more rigorous protocols.
Engineering calculations are used to determine if the physical
characteristics of a specific asset or component meet pre-described requirements. For example, the calculation of the hydraulic flow and remaining cross-sectional area of reinforcement are ways to determine the performance of a section of pipe and a concrete slab, respectively. Because the results of such calculations are binary (pass/fail), engineering calculation should be used in conjunction with other condition assessment techniques.
Weighted factor is a technique where the desired functions of an asset
class are identified and then assigned weighted factors according to the function’s significance to the organization. An evaluator then assesses an asset’s ability to perform the desired function. The final rating is obtained by multiplying the evaluator-assigned scores by the weighted factors. This technique can also be extended to include scores from different evaluators or from different weighted factors from any number of individuals. The condition rating of individual components of an asset can also be weighted in order to reflect their relative significance (consequence) to the condition of the overall asset.
A more sophisticated weighted factor technique, called Analytic Hierarchy Process (AHP), can also be used to determine the condition of an asset (Saaty and Vargas 2000). AHP is described in detail in the section on
what do you fix first.
The condition of an asset can be also estimated using distress-based
metrics (Shahin 1992, Zhao et al 2001). In this method, domain experts
develop a protocol to rate distress indicators that are the most problematic and that are most likely to affect the performance of a specific asset class. Weighted factors are also developed to rate the severity (low, medium, high) and the extent (area, length, depth) of the distress. Each distress indicator (e.g. pothole, sidewalk crack, misaligned sewer, root intrusion, or failed concrete) contributes a predetermined number of ‘deduct values’ from a theoretically excellent mark of 100%. The deduct values vary depending on the extent (e.g. 10% of area, 1 m, 10 m2) or the severity (e.g. high, medium, or low) of the distress.
This technique is used heavily in pavement and bridge management systems, but few protocols have been developed for many of the other construction domains.
A hybrid system employs a combination of the aforementioned techniques to determine the condition of the asset. The system might be specific to one organization or shared in a limited community of users. The hybrid system can also include weighted factors from a selection of other condition assessment techniques.
7.5.5 What is the remaining service life?
This question cannot be correctly answered until the condition of the asset has been objectively determined. As with the previous one on what is
the condition, this question is also multi-faceted. What is the average service
life of similar assets? What is the technical service life? What is the economic service life? What is the deterioration rate? Is this asset deteriorating faster or slower than the average?
If the infrastructure manager can establish the remaining service life of an asset or component, then plans can be made for remedial action; life cycle costs can be calculated; alternatives can be compared; priorities can be established, and maintenance or renewal can be scheduled.
There are a number of methods that can be used to determine the remaining service life of infrastructure assets: demonstrated effectiveness, testing of materials or components, factor methods, deterministic curves, analytical models, or probabilistic models. Unfortunately, there are few methods or protocols that are readily available to practitioners for the wide selection of infrastructure disciplines.
Demonstrated effectiveness implies that the service life of the asset is
based on documented records of successful performance. For example, an experienced infrastructure manager has a reasonable estimation of how often a specific component of an asset (e.g. bridge deck) requires replacement. Alternatively, the infrastructure manager could derive a service life from a review of in-house records. In essence, such types of information are referred to as age-based or condition-based estimates. Service life estimates for components are also provided in current service life tables, guidelines, codes, standards and other sources (HAPM 1995, 2002, CSA 1995, Newton and Vanier 2005).
Testing of materials or components provides accurate numbers that can
be used in the development of models for service life prediction (ASTM E1765, RILEM 1989, ISO 156861 2000). The testing can include gathering field data from the periodic inspection of components. The tests can then be used to assess the level of resistance to deterioration in relation to comparable
materials or components. Typically, short-term or long-term tests are carried out using indoors laboratory settings or outdoor field-testing. Modeling of the deterioration process involves alternate systematic approaches; each of the four methods described below requires data obtained from either these short-term or long-short-term tests.
The first two methods of service life prediction are described in the Canadian Standards Association (CSA) guideline on Durability in Buildings (CSA 1995).
The factor method (ISO 15686-1 2000) is a weighted factor approach in which a number of independent factors contributing to the service life of an asset are identified, evaluated, and rated. The evaluation team selects the factors affecting the service life (e.g. design, construction quality, load, maintenance level, and material quality) and each factor’s contribution to the service life is rated. The estimated service life is calculated by multiplying a predetermined reference service life by all of the weighted factors. This approach was first presented by the Architectural Institute of Japan (AIJ 1993) and later adopted by ISO (see Glossary) in the development of an international standard for the calculation of the service life (ISO 15686-1 2000). The factor method should be used only where the requirement for accuracy is not high and the consequences of an incorrect estimate are low. For example, it can be used for the calculation of life cycle costs but should not be used to determine remaining structural strength.
Deterministic curves attempt to model the deterioration of assets.
Deterministic curves have been developed for a number of municipal infrastructure disciplines (Bailey et al 1989; Shahin 1992, Newton and Vanier 2005). A typical example of the deterioration is shown as the two dotted lines in Figure 7.1. In this approach, experts determine the shape of the curve based on research data and experiential knowledge. In Figure 7.1, the user's assessment of the condition of two 12 year-old assets (Assets A and B) determines their remaining service life (RSL). The user must also decide what Failure State constitutes the end of the service life; in some municipalities it could be condition rating 1, 2, 3 or higher. Lowering or raising the Failure State changes the RSL for both Asset A and B. In Figure 7.1, Asset A with a condition rating of 6 after 12 years has a RSL of approximately 8 years, whereas the RSL for Asset B with a condition rating of 4 is significantly shorter. The remaining service life for each asset would decrease if the Failure State for these assets would be 3, instead of 2.
Failure State 7 7 C C o o n n d d i i t t i i o o n n R R a a t t i i n n g g 1 1 2 2 3 3 4 4 6 6 5 5 1100 1155 S SeerrvviicceeLLiiffee((yyeeaarrss) ) 0 0 5 5 2 20 0 R R..SS..LL . . R R..SS..LL . . A A B B
Figure 7.1 Deterministic deterioration curve
Analytical models attempt to calculate the remaining service life by
modeling the deterioration process. For example, calculating the rate of chloride diffusion is one method to predict the remaining service life of concrete structures: “The length of the initiation period … depends on the rate of ingress of chlorides into concrete, surface chloride concentration, depth of concrete cover, and the value of the threshold chloride level” (Lounis 2005). The concrete will start to deteriorate once the chlorides have reached the reinforcing steel, a threshold chloride level has been reached and rusting of the reinforcing steel has started. Analytical methods are useful where a specific component of the assembly or network is to be maintained and where there exists considerable knowledge as to the in-service conditions.
Probabilistic models, such as Markov chain (see Glossary) attempt to account for the apparent randomness of the failure of components and systems. This technique predicts remaining service life based on studies of similar construction forms under test and/or in-situ conditions. Probability mass functions of performance are determined for the percentage of the sample group in each of the pre-established condition ratings, as displayed in Figure 7.2. A probability distribution matrix can then be developed from these results. Unfortunately these techniques require the collection of considerable amounts of data; only a few domains such as bridges (Frangopol et al 1997), trunk sewers (Kleiner et al 2001), wastewater systems (Newton
and Vanier 2005) and roofing (Lounis et al 1998) management have developed reliable service life prediction using probabilistic models. Hybrid systems combining factor methods with probabilistic models have been proposed by Moser and Edvardsen (2002).
Limit State 7 7 C Co on nd di it ti io on nR Ra at ti in ng g 1 1 2 2 3 3 4 4 6 6
t
t
nn--11t
t
nnt
t
nn++11 TTiimme e 0 0 5 5 P Prroobbaabbiilliittyymmaassss f fuunnccttiioonnssooff p peerrffoorrmmaanncce eFigure 7.2 Probabilistic deterioration curve (from Lounis et al 1998)
7.5.6 What do you fix first?
This question cannot be correctly answered until the remaining service life of the asset has been objectively determined. However, this decision will take place tomorrow in many municipalities despite a lack of data about what
do you own, what is it worth, what is deferred, what is the condition and what is the remaining service life. Why is this?
It is because infrastructure managers have no choice, currently. However, if the first five questions to achieve sustainable municipal infrastructure have been answered, then a systematic and objective method to prioritize projects can be implemented.
Although this chapter deals with sustainable municipal infrastructure asset management, the topic of decision-making for achieving sustainable cities is also covered in detail in Chapters 16 and 17.
An innovative technique for decision-making is proposed in this chapter: -- it is necessary to first decouple or separate the engineering priorities from the political issues. That is, provide a system that first allows the public works managers to prioritize their projects according to objective engineering criteria, then allow the decision-makers to select which projects are funded (Vanier et al 2005). In this methodology, the city’s technical staff uses the objective and systematic techniques and methods described in the first five
whats to produce an engineering ranking. The political or administrative
decision-makers can also use the techniques described below to select those projects to be funded and those to be deferred.
Techniques that can be used to rank the priority of maintenance and renewal projects include: subjective criteria, expert knowledge, age-based, condition-based, weighted factor or multi-objective optimization.
Subjective criteria technique is based on a priori political, administrative
or budgetary restrictions. “This project must be done” or “we have approved that project already” or “we cannot afford to do it all” are typical justifications for this type of decision-making. For example, many municipalities have indicated that they do their ranking based primarily on safety, health or environmental concerns (Vanier and Rahman 2004). “It does not meet code”, “there are health implications”, and “this one is more important” are some contentious issues that might arise in this decision-making process. In many instances, this technique is the only one available to decision makers.
Expert knowledge relies on the elicitation of knowledge from experts in
the organization (e.g. engineers, managers, foremen, tradesmen, technicians) or from hired consultants. Their decisions are based on years of experience and what they know about the specific projects in question.
Age-based ranking relies solely on the age of the asset to determine its
maintenance or renewal priority. However, this technique is flawed when the ages are inaccurate; when assets with different levels of importance and risk of failure are compared, or when deterioration rates are not taken into consideration. Fixing the ‘oldest first’ can reduce the average age of the asset class, but sometimes replaces an asset that is in acceptable condition.
Condition-based ranking first requires an objective evaluation of the
condition and remaining service life of the asset. If the remaining service life can be calculated based on asset condition, it is an effective way to prioritize maintenance and renewal. However, flaws appear in this technique when the
condition numbers used are subjective or when different asset classes are compared.
Weighted factor method, described in Section 7.5.4, can also be used to assist
users to quantify, compare, and prioritize alternatives. In this method a number of significant characteristics of the asset are selected and assigned weighted factors according to their importance to the organization. The user can then rate how each asset performs according to these characteristics. Results are obtained by multiplying the scores from the assigned weighted factors for each significant characteristic by the user-assigned ratings and then by adding the results. For example, the condition of the asset could account for 25% of the total, the appearance for 25%, and the remaining service life for 50%. If the user rates the condition of the asset at 20 out of a possible 100, the appearance at 60 and the remaining service life at 50, the calculated result for that asset would be (20 x 0.25) + (60 x 0.25) + (50 x 0.50) or 45. Any number of evaluators could also assign their own ratings for this technique; it can also be extended to include different characteristic weighted factors and different ratings from selected individuals.
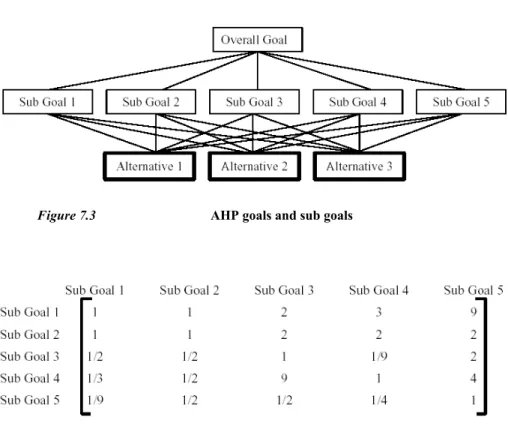
A specific type of the weighted factor method called AHP or Analytic (or Analytical) Hierarchy Process (ASTM E1765; Saaty and Vargas 2000). This process can be used effectively for a limited number of alternatives; however, it proves unwieldy when more than five goals or alternatives are compared.
In this process the overall goal of the decision-making task is first established; then a limited number of Sub Goals and a limited number of Alternatives are selected, as shown in Figure 7.3. In AHP, each Sub Goal is compared one-to-one (pair-wise), with the other Sub Goals in order to develop a comparison matrix (5 x 5 in this example with five Sub Goals). In the pair-wise comparisons, a rating of 1 means there is equal importance of the Sub Goals under review and a rating of 9 means an extreme importance of the first Sub Goal over others. An example is shown in Figure 7.3. Alternatives 1, 2, and 3 from Figure 7.3 are then compared pair-wise separately for each of the five Sub Goals. That is, another five matrices of 3 x 3 are developed in this process, where each of the three alternatives is compared pair-wise to the others (for each of the five Sub Goals).
Figure 7.3 AHP goals and sub goals
Figure 7.3 Analytic Hierarchy Process (AHP) 5 x 5 Matrix
After the two sets of comparison matrices are completed, a well-documented mathematical process (ASTM E1765) is used to rank the Alternatives according to the contributions of the individual Sub Goals and to the overall Goal. A very good and detailed description of AHP, with examples, is found in Saaty and Vargas (2000).
AHP is a comprehensive comparison tool that can be used to compare both subjective and quantifiable data and also can be used to give ‘Power Weights’ to individual decision-makers (e.g. the engineers have three times the ‘Power weights’ on technical issues).
The obvious advantage of AHP is quantifiable results; however, the disadvantage is the number of comparisons required when a large number of Sub Goals and Alternatives are under review.
Multi-objective optimization is an approach based upon compromise
programming methods where the simultaneous satisfaction of conflicting objectives is considered. For example, these could be: the minimization of maintenance costs, the maximization of network performance, and the minimization of risk of failure. Multi-objective optimization (MOO) is a
decision-support approach that uses the concept of Pareto optimality to determine priorities
“A change that can make at least one individual better off, without
making any other individual worse off is called a Pareto improvement … an allocation of resources is Pareto efficient when no further Pareto improvements can be made” (Wikipedia, the Free Encyclopedia)
MOO can be used to determine the optimal ranking of deteriorated assets in terms of their priority for maintenance or renewal, by achieving a satisfactory trade-off between the aforementioned competing / conflicting objectives (Lounis et al 2002).
7.6 Municipal infrastructure asset management plan
Municipal infrastructure asset management is difficult to implement in practice as asset management means many things to many different people. For example, some disciplines in an organization might feel they already have an asset management system in place when they have implemented an inventory system. Or, some organizations can have some disciplines that are well advanced in asset management implementation (i.e. bridges, roads) but also have many that are lagging behind (i.e. parks, buried utilities). Or, some regions can have reached a plateau and wish to advance to a higher level not knowing that a sister discipline in another region has the tools and techniques in place to assist them. Because of these obvious differences in organizations and in any particular organization, an organization's asset management implementation plan should have a series of overlying principles established at the highest level in that organization. An example of an asset management plan is provided in Table 7.3. The asset management implementation plan should:
Assess organization's current level of implementation in various regions and disciplines.
Set minimum criteria for data and information for all levels of implementation.
Estimate cost of implementation, and
Table 7.3 Asset management implementation plan
7.7 Conclusions
The economic sustainability of municipal infrastructure can be achieved using the asset management techniques described in this chapter. If the six simple questions can be answered in the sequence presented, then objective decisions based on the priorities set by the municipality can be readily made about what maintenance or renewal activities should be completed first.
Internet references for Chapter 7
Source: AMQ´s International (2005) Address:
www.amqi.com
Source: Australian National Audit Office (2005) Address:
www.anao.gov.au
Source: American Society of Civil Engineers Title: Report Card for America’s Infrastructure Address:
www.asce.org/reportcard/2005/index.cfm
Source: The Canadian Council for Public-Private Partnerships (CCPPP)
Title: Definitions Address:
www.pppCouncil.ca/aboutPPP_definition.asp
Source: Canadian Public Works Association
Title: Critical condition: Canada’s infrastructure at the crossroads Address:
www.cpwa.net/Documents/TRM_Ministerial_Brief.pdf
Source: Government Accounting Standards Board (2005)
Title: Standard 34 Resource Centre Address:
www.gasb.org/repmodel/index.html
Source: National Guide to Sustainable Municipal Structure
Title: InfraGuide Address:
www.infraguide.gc.ca
Source: National Research Council Canada (2004)
Title: Client report Address:
irc.nrc-cnrc.gc.ca/uir/miip/docs/B5123-4.pdf Source: HAPM (2002)
Title: Building a safer future www.hapm.co.uk
Author: Dana J. Vanier
Source: National Research Council Canada (1998) Title: Innovations in urban infrastructure / APWA 1998 Address:
www.nrc.ca/irc/uir/apwa/apwa98
Source: National Research Council Canada (2000)
Title: Municipal Infrastructure Investment Planning Address:
Source: Reed Construction Data
Title: RSMeans Address:
www.rsmeans.com
Source: Bill 175 2002, Ontario Provincial Government
Title: Sustainable Water and Sewage Systems Act, 2002 Address:
Bibliography
Agenda 21 (1999). “Agenda 21 on Sustainable Construction”, CIB Report Publication 237, International Council for Research and Innovation in Building and Construction, Rotterdam, The Netherlands, 120p.
AIJ (1993). English translation of “Principal Guide for Service Life Planning of Buildings”, Architectural Institute of Japan, Tokyo.
ANAO (1996). “Asset Management Handbook”, Australian National Audit Office, Canberra, Australia, www.anao.gov.au. Check “publications” for “Better Practice Guides - Financial Management And Controls”, (6 June 2005).
ANAO (1996a). “Asset Management Guide”, Australian National Audit Office, Canberra, Australia, www.anao.gov.au/. Check “publications” for “Better Practice Guides - Financial Management And Controls” (6 June 2005).
Aronoff, S., Kaplan, A. (1998). “Total Workplace Performance: Rethinking the Office Environment”, WDL Publications, Ottawa, ON, 416p, ISBN 0-921804-95-4.
ASCE (2005). “ASCE’s 2005 Report Card for America's Infrastructure”, www.asce.org/reportcard/2005/index.cfm
ASTM E917 (1994). “ASTM E917, Standard Practice for Measuring Life-Cycle Costs of Buildings and Building Systems”, American Society for Testing and Materials, West Conshohocken, PA.
ASTM E1765 (1995). “ASTM E1765-95-92, Standard Practice for Applying Analytical Hierarchy Process (AHP) to Multiattribute Decision Analysis of Investments Related to Buildings and Building Systems”. American Society of Testing Materials, West Conshohocken, PA.
Bailey D.M., Brotherson, D.E., Tobiasson, W., Knehans, A. (1989). “ROOFER: An Engineered Management System for Bituminous Built-Up Roofs”, Technical Report M-90/04/ ADA218529, US Army Construction Engineering Research Laboratory, Champaign, IL.
CERF (1996). “Level of Investment Study: Facility and Infrastructure Maintenance and Repair”, Civil Engineering Research Foundation, Washington, D.C.
CSA (1995). “CSA S478-95 Guideline on Durability in Buildings”, Canadian Standards Association, Rexdale, ON.
CSCE (2003). “Critical Condition: Canada's Infrastructure at the Crossroads”, Canadian Society for Civil Engineering, Montreal, PQ, www.cpwa.net/Documents/TRM_Ministerial_Brief.pdf, (6 June 2005).
Edmonton (2004). “Thinking Outside the Gap: Opportunities to Address Edmonton’s Infrastructure Needs - Infrastructure Strategy Report 2004”, www.edmonton.ca/InfraPlan/Infra/City Docs/Infrastructure 2004 v3.pdf (6 June 2005).
ENR (1999). Building Cost Index History (1916-1999)," Engineering News Record, Vol. 242, No. 12 (March22/March29, 1999), p. 99.
FFC (2002). “Learning from Our Buildings: A State-of-the-Practice Summary of Post-Occupancy Evaluation”, Federal Facilities Council, Washington, DC, books.nap.edu/books/0309076110/html/index.html (6 June 2005).
Frangopol, D.M., Lin, K.Y., Estes, A.C. (1997) “Life-cycle cost design of deteriorating structures”, ASCE J. of Struct. Engrg., Vol. 123, No. 10, 1390-1401.
GASB (2001). “Basic Financial Statements—and Management’s Discussion and Analysis—for State and Local Governments”, Governmental Accounting Standards Board, Norwalk, CT.
GASB (2003). www.gasb.org/repmodel/index.html (6 June 2005).
Guide (2003). “National Guide to Sustainable Municipal Infrastructure” www.infraguide.gc.ca/ (6 June 2005).
Halfawy, M. (2004). “The interoperability of geographic information systems for municipal asset management applications”, Institute for Research in Construction, National Research Council Canada, Ottawa, ON, Canada. This document forms Part 2 of B-5123.4, irc.nrc-cnrc.gc.ca/uir/miip/docs/B5123-4.pdf (6 June 2005).
HAPM (1995). “LifeSpans of Building Components”, Technical Note 6, Housing Association Property Mutual, June, 1995, London, www.hapm.co.uk/technotes/technote6.htm (6 June 2005).
ISO 156861 (2000). ISO 156861-1: 2000 “Buildings and constructed assets -- Service life planning -- Part 1: General principles”, International Organization for Standardization, Geneva.
Kleiner, Y., Adams, B.J., Rogers, J.S. (2001). “Water distribution network renewal planning”, Journal of Computing in Civil Engineering, 15, (1), Jan., pp. 15-26.
Lemer, A.C. (1998). “Progress Toward Integrated Infrastructure-Assets-Management Systems: GIS and Beyond”, Innovations in Urban Infrastructure Seminar of the APWA International Public Works Congress, Las Vegas, Nevada, pp. 7-24, irc.nrc-cnrc.gc.ca/fulltext/apwa/ apwaintegrated.pdf (6 June 2005).
Lounis, Z., Vanier, D.J., Lacasse, M.A., Kyle, B.R. (1998). “Effective Decision-Making Tools for Roofing Maintenance Management”, First International Conference on New Information Technologies in Civil Engineering, Montreal PQ, Oct., pp. 425-436, irc.nrc-cnrc.gc.ca/fulltext/nrcc42831.pdf (5 June 2005).
Lounis, Z. (2005). “Uncertainty modeling of chloride contamination and corrosion of concrete bridges”, Applied Research in Uncertainty Modeling and Analysis, Chapter 22, Springer Publishers, pp. 491-511, January 01, 2005.
MIIP (2005). Municipal Infrastructure Investment Planning Project www.nrc.ca/irc/uir/miip (1 May 2005).
Moser, K., Edvardsen, C. (2002). “Engineering Design Methods for Service Life Prediction”, 9th International conference on the Durability of Building Materials and Components, Brisbane, Australia, Paper 222, pp. 1-10.
NACUBO (1991). “Managing the Facilities Portfolio”, National Association of College and University Business Officers, Washington, DC, 100p.
Newton, L.A. ,Vanier, D.J. (2005). “Deterioration of Sewers”, MIIP Report, in press.
NRC (1990). “Committing to the Cost of Ownership”, Building Research Board, National Research Council, Special Report # 60, Washington, D.C.
OMBI (2003). “Ontario Municipal CAO's” (Chief Administrative Officer's) Benchmarking Initiative, www.caobenchmarking.ca/index.asp (8 June 2005). RILEM (1989). “Systematic Methodology for Service Life Prediction of Building Materials and Components”, RILEM – Technical recommendation PSL 1, Paris.
RSMeans (2002). R.S. Means Company Inc., <www.rsmeans.com> (6 June 2005).
Saaty, T.L., Vargas, L.G. (2000) “Models, Methods, Concepts & Applications of the Analytic Hierarchy Process”, Kluwer Academic Publishers, Boston, MA, 333p.
Shahin, M.Y. (1992). “20 Years Experience in the PAVER Pavement Management System: Development and Implementation”, Pavement Management Implementation, F.B. Holt and W.L. Gramling, editors, ASTM, West Conshohocken, PA.
Vanier, D. J. (2001). “Why industry needs asset management tools, Journal of Computing in Civil Engineering”, 15, (1), pp. 35-43, irc.nrc-cnrc.gc.ca/fulltext/nrcc44702/ (1 May 2005).
Vanier, D.J. (2004). “Towards geographic information systems (GIS) as an integrated decision support tool for municipal infrastructure asset management”, CIB 2004 Triennial Congress, Toronto, pp. 1-11, May 01, 2004 irc.nrc-cnrc.gc.ca/fulltext/nrcc46754 (1 May 2005).
Vanier, D.J., Rahman, S. (2004). “MIIP Report: A Primer on Municipal Infrastructure Asset Management”, Institute for Research in Construction, Ottawa, ON, Canada. irc.nrc-cnrc.gc.ca/uir/miip/docs/primer.pdf (6 June 2005).
Vanier, D.J., Newton, L.A., Rahman, S. (2005). “MIIP Report: Framework for Municipal Infrastructure Management for Canadian Municipalities”, Institute for Research in Construction, Ottawa, ON, Canada.), in press.
WIN (2003). “Clean and Safe Water for the 21st Century: A Renewed National Commitment to Water and Wastewater Infrastructure”, Water Infrastructure Network, www.amsa-cleanwater.org/advocacy/winreport/winreport2000.pdf (6 June 2005).
Zhao J.Q., McDonald, S.E., Kleiner, Y. (2001). “Guidelines for Condition Assessment and Rehabilitation of Large Sewers”, Institute for Research in Construction, National Research Council Canada, pp. 78, Ottawa, ON.