HAL Id: hal-01839190
https://hal.archives-ouvertes.fr/hal-01839190
Submitted on 25 May 2020
HAL is a multi-disciplinary open access
archive for the deposit and dissemination of
sci-entific research documents, whether they are
pub-lished or not. The documents may come from
teaching and research institutions in France or
abroad, or from public or private research centers.
L’archive ouverte pluridisciplinaire HAL, est
destinée au dépôt et à la diffusion de documents
scientifiques de niveau recherche, publiés ou non,
émanant des établissements d’enseignement et de
recherche français ou étrangers, des laboratoires
publics ou privés.
Individual characteristics associated with changes in the
contribution of plant foods to dietary intake in a French
prospective cohort
Zoé Colombet, Benjamin Allès, Wendy Si Hassen, Aurélie Lampuré,
Emmanuelle Kesse-Guyot, Sandrine Péneau, Serge Hercberg, Caroline Méjean
To cite this version:
Zoé Colombet, Benjamin Allès, Wendy Si Hassen, Aurélie Lampuré, Emmanuelle Kesse-Guyot, et al..
Individual characteristics associated with changes in the contribution of plant foods to dietary intake
in a French prospective cohort. European Journal of Nutrition, Springer Verlag, 2019, 58 (5), pp.1.
�10.1007/s00394-018-1752-8�. �hal-01839190�
Version postprint
Title page
Individual characteristics associated with changes in the contribution of plant foods to dietary intake in a French prospective cohort
Zoé Colombet1, Benjamin Allès1, Wendy Si Hassen1, Aurélie Lampuré1, Emmanuelle Kesse-Guyot1,
Sandrine Péneau1, Serge Hercberg1,2, Caroline Méjean3
1 Université Paris 13, Sorbonne Paris Cité, Equipe de Recherche en Epidémiologie Nutritionnelle (EREN), Centre d’Epidémiologie et Statistiques Paris Nord, Inserm (U1153), Inra (U1125), Cnam, Université Paris 5, Université Paris 7, F-93017, Bobigny, France
2 Department of Public Health, Hôpital Avicenne, F-93300 Bobigny, France
3 MOISA, Univ Montpellier, CIRAD, CIHEAM-IAMM, INRA, Montpellier SupAgro, Montpellier, France
Colombet, Allès, Si Hassen, Lampuré, Kesse-Guyot, Péneau, Hercberg, Méjean
Corresponding author: Zoé Colombet
EREN, SMBH Paris 13, 74 rue Marcel Cachin, F-93017 Bobigny Cedex, France
Phone number: 00 33 1 48 38 89 33/ Fax number: 00 33 1 48 38 89 31
E-mail: zoe.colombet@gmail.com
Version postprint
Abbreviations:
95% CI: 95% confidence interval ANOVA: analysis of variance BMI: body mass index BMR: Basal Metabolic Rate
CARDIA: Coronary Artery Risk Development in Young Adults ENNS: Etude Nationale Nutrition Santé
INCA2: Individual and National Consumption Survey 2 PEIPP: percent energy intake provided by plant proteins SD: standard deviation
SE: standard error UU: urban unit
Version postprint
Abstract
1
Purpose: Rebalance the contribution of animal- and plant-based foods is needed to achieve
2
sustainable diet. However, little is known concerning individual characteristics that may influence
3
intake of plant-based foods and their changes over time. We aimed to assess changes in the
4
contribution of plant-based foods to dietary intake over time, and their association with individual
5
characteristics.
6
Methods: The contribution of plant-based foods was assessed by percent energy intake provided by
7
plant proteins in diet (PEIPP) and a score of adherence to a pro-vegetarian diet, using repeated
24-8
hours records in 15,615 French adults participating in the NutriNet-Santé cohort study. Associations
9
between baseline individual characteristics and changes in the two indicators over a 4 to 6 year
follow-10
up were assessed using a linear mixed model.
11
Results: At baseline, PEIPP and pro-vegetarian score were positively associated with age
12
(β65+=0.80, 95%CI=[0.71, 0.88], β65+=3.30, 95%CI=[2.97, 3.64], respectively) and education
13
(βpostgraduate=0.23, 95%CI=[0.12, 0.34], βpostgraduate= 1.19, 95%CI=[0.75, 1.62]), while they were
14
inversely associated with BMI class (βobesity=-0.48, 95%CI=[ 0.56, 0.41], βobesity=-2.31,
95%CI=[-15
2.63, -1.98]). Men had higher PEIPP than women (β=0.06, 95%CI=[0.01, 0.11]). Pro-vegetarian score
16
significantly increased over time (β=0.23, 95%CI=[0.08, 0.37]). The older the individual at baseline, the
17
greater the decrease in the two indicators during follow-up. Pro-vegetarian score increased during
18
follow-up for obese participants at baseline.
19
Conclusions: The contribution of plant-based foods was associated with several socio-demographic
20
and economic characteristics at baseline, whereas change over time was related to age and weight
21
status. Further analysis of individual obstacles and lever to consume plant-based foods is needed.
22
Keywords: Plant-based foods, plant proteins, dietary change, sustainable diet, longitudinal analysis,
23
individual characteristics
Version postprint
Introduction
25
Consumption of animal-based foods is a major environmental, public health and economic issue [1].
26
Previous studies have highlighted that, compared to production of plant-based foods, production of
27
animal-based foods mobilizes more resources (space, energy, water, etc.) and seems to have a
28
deleterious impact on the environment [2, 3]. However, the health impact of plant-based diet compared
29
with animal-based diet remains an ongoing discussion. Available studies on the health impact of red
30
and processed meat have mostly highlighted that a high consumption of red and processed meat is a
31
notable risk factor for major nutrition-related chronic diseases and for early mortality, compared with
32
low intake or consumption of other meat [4–8]. In contrast, an increasingly number of studies have
33
shown that plant-based diets and diets with lower intake of red and processed meat and higher intake
34
of fruits and vegetables seems to be associated with longer life expectancy and lower risk of chronic
35
disease [9–14]. To improve overall food and nutrition security, and to limit the environmental impact of
36
diet, rebalancing of dietary intake toward plant-based foods in western societies may therefore
37
represent sustainable answers [1, 15].
38
To rebalance the contribution of plant vs. animal foods in the diet, knowledge of the association
39
between consumption of plant- and animal-based foods and individual characteristics is needed.
40
Available studies focused on socio-demographic and economic characteristics associated with intake
41
of specific plant-based foods and, in particular, fruits and vegetables [16–20]. To the best of our
42
knowledge, no study has yet assessed individual determinants of the contribution of plant- and
animal-43
based foods to diet. Understanding changes in dietary intake in recent years based on individual
44
characteristics is essential so as to efficiently promote consumption of plant-based foods [21]. Few
45
available studies have assessed the association between individual characteristics and change in diet
46
over time [22–28]. In the Coronary Artery Risk Development in Young Adults (CARDIA) study
47
conducted among US adults, dietary quality increased over time with age [22]. In contrast, an
48
Australian study showed that younger age at baseline was independently associated with
49
improvement in dietary quality over time [23]. Change in diet quality and fresh vegetable consumption
50
over time was related to gender in Australian and Finnish adults [23, 24]. Regarding socio-economic
51
factors, dietary quality [22, 23, 25] and daily fresh vegetable consumption [24] increased over time in
52
better-educated individuals, subjects belonging to higher occupational and income classes. Regarding
Version postprint
lifetime events, a decrease in fruit and vegetable intake at the end of a marriage (divorce, widowhood)
54
[26–28] and an increase upon remarrying were observed [26, 27]. However, no prospective cohort had
55
previously assessed the association between individual characteristics and change in consumption of
56
plant- and animal-based foods in recent years, even though readjustment of such intake has become
57
of greater concern to consumers [29].
58
The aim of the present study was to assess the association between individual characteristics and the
59
contribution of plant-based foods to diet both at baseline and over time, using two complementary
60
indicators. The first indicator that assesses the percent energy intake from plant proteins in diet
61
represents the proportion of plant consumption in the diet from a nutritional point of view while the
pro-62
vegetarian score aims to evaluate the adherence to a vegetarian diet and therefore provides a
63
behavioural point of view of dietary habits [30]. In addition, the first indicator had been previously used
64
in epidemiological studies [31–34], enabling comparison of our results with data from the literature.
Version postprint
Methods
66
Population
67
Subjects were participants in the NutriNet-Santé study, a large, ongoing, web-based prospective
68
observational cohort launched in France in May 2009. It was implemented in a general population
69
targeting internet-using adult volunteers aged 18 or older. The study was designed to investigate the
70
relationship between nutrition and health, as well as determinants of dietary behaviour and nutritional
71
status. The design and methods of the study have been described previously [35]. For recruitment,
72
initially a vast multimedia campaign (television, radio, national and regional newspapers, posters, and
73
internet) called for volunteers and provided details on the study's specific website
(http://www.etude-74
nutrinet-sante.fr). Then, multimedia campaigns were repeated every six months. Further information is
75
maintained on a large number of websites (national institutions, city councils, private firms, web
76
organizations). A billboard advertising campaign is regularly updated via professional channels (e.g.
77
doctors, pharmacists, dentists, business partners, municipalities). Participants were included in the
78
cohort once they had completed a baseline set of questionnaires assessing dietary intake, physical
79
activity, anthropometric measures, lifestyle, socio-economic conditions and health status. As part of
80
their follow-up, participants completed the same set of questionnaires every year. In addition, they
81
were invited monthly to fill out optional complementary questionnaires related to determinants of food
82
behaviour, nutritional and health status.
83
The NutriNet-Santé study was conducted according to guidelines laid down in the Declaration of
84
Helsinki, and all procedures were approved by the Institutional Review Board of the French Institute
85
for Health and Medical Research (IRB Inserm No. 0000388FWA00005831) and the French Data
86
Protection Authority (Commission Nationale Informatique et Libertés No. 908450 and No. 909216).
87
Electronic informed consent was obtained from all participants.
88
Data collection
89
Dietary assessment
90
At baseline and each year thereafter, participants were invited to complete three non-consecutive
91
validated web-based 24 hours (24-h) dietary records, randomly assigned over a 2-week period (2
Version postprint
weekdays and 1 weekend day) [35]. The dietary record is completed via an interactive interface and is
93
designed for self-administration on the dedicated website (www.etude-nutrinet-sante.fr) [36]. The
94
accuracy of this web-based 24-h dietary record was assessed by comparing the record to interviews
95
by trained dietitians [36] and to 24-h urinary biomarkers [37, 38]. The web-based dietary assessment
96
method relied on a meal-based approach, recording all foods and beverages (type and quantity)
97
consumed at breakfast, lunch, dinner and all other eating occasions. First, the participant fills in the
98
names of all food items eaten. Next, he/she estimates portion sizes for each reported food and
99
beverage according to standard measurements (e.g., home containers, grams indicated on the
100
package) or using validated photographs available via the interactive interface. These photographs,
101
taken from a validated illustrated booklet [39], represent more than 250 foods (corresponding to 1,000
102
generic foods) served in seven different portion sizes. One dish could pertain to several groups if it
103
was composed of several components. For each food group, components of composite dishes were
104
proportionally accounted for, using French recipes validated by food and nutrition professionals.
105
Values for energy, macronutrients and micronutrients were estimated using published nutrient
106
databases [40].
107
In the present study, two indicators were used to assess the contribution of plant foods to the diet.
108
First, a nutritional indicator, the percentage of energy intake without alcohol, provided by plant proteins
109
was computed as:
110
Plant protein, % of energy = plant protein (g) × 17 kJ
energy intake without alcohol× 100
111
This indicator had been previously used in epidemiological studies [31–34], enabling comparison of
112
our results with data from the literature. Plant protein intake was positively associated with overall
113
nutrient adequacy, making a robust marker of health awareness, better compliance to dietary
114
guidelines and quality of the diet [32, 41]. In addition, the structure of this indicator included the effect
115
of energy intake, and thus did not require adjustment for this variable.
116
The second indicator, a behavioural indicator, was a score of adherence to a “pro-vegetarian” food
117
pattern elaborated by Martínez-González et al. [30]. Briefly, consumption (in g/day) of seven plant food
118
groups (vegetables, fruits, legumes, cereals, potatoes, nuts, olive oil) and five animal food groups
119
(meat and meat products, animal fat for cooking or as a spread, eggs, fish and seafood, dairy
Version postprint
products) was computed by adjusting for total energy intake using the residual method [42] separately
121
for men and women. The energy-adjusted estimates were ranked according to their sex-specific
122
quintiles. For this score, plant-derived foods were positively weighted, assigning a value of 1 for the
123
first quintile, 2 for the second quintile, and successively, up to a value of 5 for the fifth quintile.
Animal-124
derived foods were negatively weighted, assigning a value of 5 for the first quintile to 1 for the fifth
125
quintile. The scores were then summed up to obtain a global score ranging from 12 (lowest
126
adherence) to 60 (highest adherence).
127
Assessment of socio-economic and demographic characteristics
128
At baseline, self-administered questionnaires were used to collect data on socio-economic and
129
demographic characteristics, including sex, age, size of the urban unit of residence, educational level
130
and household composition. To assess educational level, participants were asked their highest
131
attained diploma. Educational level was recoded into five categories: none or primary education,
132
secondary education, high school graduate or equivalent, undergraduate (corresponding to up to 3
133
years following high school graduation), and post-graduate (more than 3 years after high school
134
graduation). Household composition was classified into three categories: living alone without a child,
135
living with at least one adult and no child, or living with at least one child. Size of the urban unit of
136
residence was categorized into rural, fewer than 20,000 inhabitants, 20,000 to 200,000 inhabitants,
137
more than 200,000 inhabitants and Paris. Height and weight were also self-reported at baseline; body
138
mass index (BMI) was calculated and categorized according to the World Health Organization (WHO)
139
classification for adults [43]: underweight, normal weight, overweight and obesity. Validity of
self-140
reported height and weight has been evaluated by a previous study conducted in the NutriNet-Santé
141
cohort [44]. Self-reported and measured height and weight were compared and showed a sensitivity of
142
88% and a specificity of 99%.
143
Statistical analysis
144
The present analysis focused on participants in the NutriNet-Santé study included between May 2009
145
and April 2010 who had at least 2 sets of 24-h dietary records: at baseline and after 4 years of
follow-146
up. A set was composed of two or three 24-h dietary records. Participants were invited to complete a
147
set every year during the 6 years of follow-up, leading to a maximum of 6 sets of 24-h dietary records
Version postprint
per subject (range: 2 to 6 collected sets). Other selection criteria to be included in the analysis sample
149
were: residency in mainland France, not being underreporters of energy intake, and no missing data
150
for individual characteristics at baseline. Self-reported vegetarians and vegans were excluded from
151
this analysis. They are overrepresented in the NutriNet-Santé study cohort, and their inclusion in the
152
analysis sample might have artificially increased the mean scores of vegetable protein consumption.
153
Energy-underreporting participants were identified by the method proposed by Black [45] and
154
excluded. Briefly, basal metabolic rate (BMR) was estimated by Schofield equations [46] according to
155
sex, age, weight and height collected at enrolment in the study. BMR was compared to energy intake,
156
taking into account the physical activity level (a physical activity level of 1.55 was used to identify
157
underreporting subjects) [45].
158
For each sex, weighting was calculated using the iterative proportional fitting procedure according to
159
the 2009 French national census reports on age, occupational categories, educational level, marital
160
status and geographical area of residence [47]. Weighting was accounted for all analyses.
161
Mean percent energy intake provided by plant proteins and mean pro-vegetarian score at baseline
162
were compared by sex, age group, educational level, household composition, size of the urban unit of
163
residence and BMI category, using Student’s t-test or analysis of variance (ANOVA) as appropriate,
164
and were presented with their standard error (SE).
165
The database was constituted of repeated yearly measurements of the two dietary indicators for each
166
participant. To assess the evolution of the two indicators over time and their interaction with individual
167
characteristics, linear mixed models were used. They take into account inter-individual variability
168
induced by the change in consumption for each subject, and the intra-subject correlation resulting from
169
repeated measurements of indicators in the same subject [48]. Multivariate linear mixed models,
170
including sex, age, educational level, household composition, size of the urban unit of residence and
171
BMI categories at baseline, were established. Models were also adjusted for household composition at
172
the last follow-up. To select individual characteristics, univariable analysis was conducted and all
173
analyses were significant. A P-value <0.05 was considered statistically significant.
Version postprint
Data management and statistical analyses were performed using SAS (version 9.4; SAS Institute, Inc.,
175
Cary, NC, USA).
Version postprint
Results
177
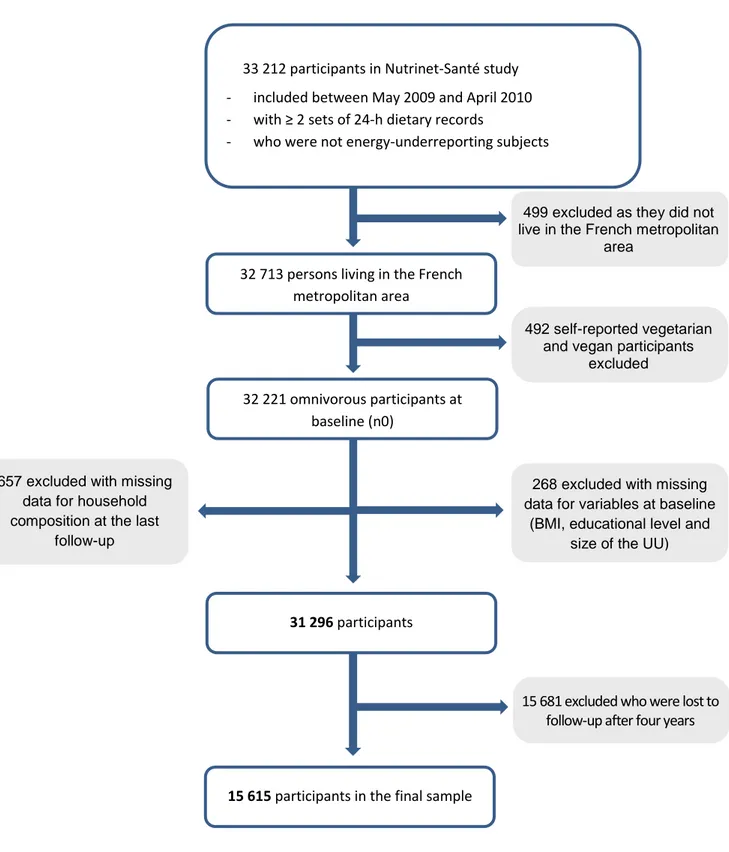
Among 33,212 subjects included between May 2009 and April 2010, with at least 2 sets of 24-h
178
dietary records and who were not energy-underreporting subjects, we excluded 499 persons not living
179
in the French metropolitan area, 492 who self-reported being vegetarian and vegan, 268 participants
180
with missing data for variables at baseline (BMI, educational level and size of the UU) and 657
181
participants with missing data for household composition at the last follow-up (Figure 1). We also
182
excluded 15,681 participants who were lost to follow-up after four years, leaving 15,615 participants in
183
the final sample.
184
All subjects had been followed for 4 years, and 51% had been followed for up to 6 years. The mean
185
follow-up was 4.6 years (SD: 0.5 years). In this sample, 29% of the participants had completed all their
186
dietary sets of records every year for 6 years, 36% had 5 sets of records, 21% had 4 sets of records,
187
10% had 3 sets of records and 4% had only 2 sets of records.
188
Comparisons between participants and excluded subjects (17,598 subjects) presented in
189
Supplementary Table 1 showed that included subjects were older (mean 48.4 years (SD: 14.1) vs.
190
41.7 years (SD: 14.1)); the percentage of those not living with children and the prevalence of
191
overweight were higher, while the percentage of those living with children and the obesity prevalence
192
were lower. In addition, the mean percentage of energy intake from plant proteins and the mean
pro-193
vegetarian score were equivalent in both included and excluded subjects (means 5.6% (SD: 1.3) vs.
194
5.5% (SD: 1.4) and 36.1 (SD: 5.1) vs. 35.9 (SD: 5.3), respectively) (Supplementary Table 1).
195
According to raw data, the size of the urban unit of residence of our sample has similar percentage
196
that those reported by the national census while men, young adults, subjects with a low level of
197
education and individuals living with a child were poorly represented in our sample (Table 1).
198
Sociodemographic characteristics were modified by the weighting procedure. Demographic and
199
socioeconomic characteristics were mostly comparable between the weighted sample and the French
200
general population, except for education (Table 1). After weighted, about half of participants in the
201
analysis sample were women (Table 1). Mean age at baseline was 47.8 years (SE: 0.1). In addition,
202
63% of participants had an educational level higher than or equal to high school graduation. More than
203
half of the subjects were living without a child but with at least one adult but only 5% were living alone,
Version postprint
and 22% lived in rural areas. Finally, 28% of individuals presented overweight and 10% presented
205
obesity. At baseline, the mean percent energy intake provided by plant proteins (PEIPP) was 5.4%
206
(SD: 0.1, range: 0.9 to 20.1) and the mean pro-vegetarian score was 35.4 (SD: 0.2, range: 16 to 55)
207
(Table 2).
208
The mean PEIPP was higher in older subjects, individuals who lived alone and underweight or
normal-209
weight subjects, compared to young adults, those who lived with at least one child and obese persons
210
respectively (Table 2). The mean pro-vegetarian score was positively associated with age (Table 2).
211
The score was higher in individuals who lived alone or with another adult and in underweight or normal
212
weight subjects compared to those who lived with at least one child, and compared to obese persons.
213
During follow-up, PEIPP decreased slightly (-0.1% (SE: 0.01), p<0.01), while the pro-vegetarian score
214
showed a slight increase (+0.1 (SE: 0.04), p=0.02) over time (Supplementary Table 2). In addition,
215
energy intake without alcohol decreased (-156.2 kJ/day (SE: 16.8), p<0.01) as the mean protein intake
216
(-1.9 g/day (SE: 0.2), p<0.01) and the percent of plant protein in the protein intake (-0.5% (SE: 0.1),
217
p<0.01).
218
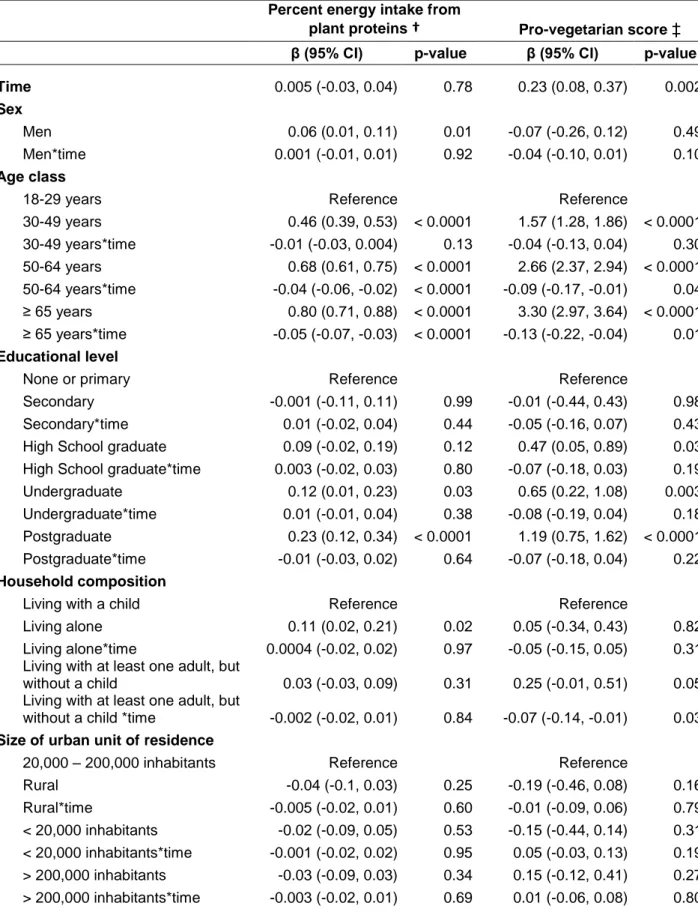
Results of the associations between baseline individual characteristics and change over time of PEIPP
219
and the pro-vegetarian score after weighting are presented in Table 3. The pro-vegetarian score
220
significantly increased over time (β=0.23,95% CI = [0.08, 0.37]), while the change in PEIPP was not
221
significant (β=0.005, 95% CI = [-0.03, 0.04]). The size of the urban unit of residence was not
222
significantly associated with either of the indicators, either at baseline or during follow-up. Being a man
223
was positively associated with PEIPP, whereas the association between sex and the pro-vegetarian
224
score was not significant. In addition, sex was not significantly associated with change over time of
225
either indicator. PEIPP and the pro-vegetarian score were positively associated with age at baseline.
226
Both indicators declined over time in subjects aged 55 to 64 and over 65. Educational level higher
227
than or equal to an undergraduate degree was positively associated with PEIPP, while an educational
228
level higher than or equal to high school graduation was positively associated with the pro-vegetarian
229
score at baseline. Education was not significantly associated with a change over time of either
230
indicator. Household composition was not significantly associated with the pro-vegetarian score at
231
baseline, but individuals living alone had higher PEIPP than those living with a child. The
pro-232
vegetarian score decreased over time in persons living with at least one adult but without a child
Version postprint
compared to those living with a child. Compared to underweight or normal-weight participants,
234
overweight subjects and those with obesity had lower PEIPP and pro-vegetarian score at baseline. In
235
subjects who presented obesity at baseline, pro-vegetarian score significantly increased over time.
Version postprint
Discussion
237
To the best of our knowledge, this is the first prospective study on consumption of plant-based foods
238
and its associated characteristics. Also, our study uses of two complementary indicators assessing the
239
contribution of plants to diet from a nutritional and a behavioural point of view, thereby rendering our
240
results more robust.
241
Our findings indicate that the percent energy intake provided by plant proteins, and the pro-vegetarian
242
score, were positively associated with age and education at baseline, while they were inversely
243
associated with weight status. During follow-up, the contribution of plant foods to overall diet
244
decreased in older adults whereas pro-vegetarian score increased only in participants who presented
245
obesity. Thus, very few individual characteristics influenced changes in plant-based food intake over
246
time. This may be due to the slight variation in the contribution of plant-based foods to diet over time
247
across population subgroups. A longer follow-up period might reveal a greater change in food
248
consumption according to individual factors. Another explanation is that, in the context of the recent
249
economic crisis, environmental factors such as food price may more strongly influence consumption of
250
plant-based foods than individual characteristics [49, 50].
251
Men had slightly higher intakes of plant proteins than women whereas previous studies showing lower
252
consumption of plant foods such as fruits and vegetables in men than in women [17, 24, 51]. Further
253
analysis showed that the slightly higher contribution of plant proteins in men in our study may be
254
explained by their equivalent cereals, potatoes and tubers consumption, an important source of plant
255
proteins (Supplementary Table 2).
256
At baseline, the contribution of plant proteins to diet was positively associated with age, in agreement
257
with the literature [17, 18]. This suggests that dietary habits of older adults are more in line with
258
nutritional recommendations than in young adults, including higher consumption of fruits and
259
vegetable, possibly due to a generational effect on dietary patterns and food supply practices. Despite
260
higher intake of plant-based foods, the older the participant at baseline, the more the two indicators
261
decreased over time compared to younger participants at baseline. Food and nutrient intake, including
262
plant-based foods, declined with age [18], possibly due to physiological changes associated with aging
263
such as altered taste and smell, altered digestive capacity and altered dentition and chewing ability,
264
limiting intake of certain foods and reducing dietary diversity [18, 52].
Version postprint
In agreement with a multicenter study on protein intake conducted in 10 European countries including
266
France [34], our study showed that education was positively associated with both pro-vegetarian score
267
and PEIPP. Indeed, education is associated with better understanding of the importance of nutritional
268
information messages and the ability to appropriate these in order to generate eating behaviour in line
269
with nutritional recommendations, such as higher consumption of fruits and vegetables and lower
270
intake of animal-based foods [16, 53, 54].
271
Previous studies on the association between the presence of children in the household and intake of
272
fruits and vegetables showed contradictory results [19, 20]. In the present study, at baseline, no
273
significant association was found with the pro-vegetarian score, but individuals who lived alone had
274
higher PEIPP than those living with children. In available studies, for individuals living with children
275
compared to those living alone, overall consumption of meat, seafood and eggs was higher [55, 56],
276
which may explain their lower ratio of plant proteins vs. animal proteins. Results showing the decrease
277
in the pro-vegetarian score over time in persons living with at least one adult but without a child at
278
baseline may be due to additional intrahousehold factors not taken into account in our study, such as
279
psychosocial influences [20, 57].
280
The pro-vegetarian score and the contribution of plant proteins to the diet were lower in subjects who
281
presented overweight and obesity. Our finding is consistent with a multicenter study showing an
282
inverse association between BMI and intake of plant proteins in French women, while a positive
283
association between BMI and intake of animal proteins was found [34]. Our results is also in line with
284
the findings of the prospective cohort Chicago Western Electric Study showing a significant inverse
285
association between higher vegetable protein intake and obesity and a positive association between
286
animal protein intake and obesity in employed men aged 40–55 years [58]. Our result is mainly due to
287
higher consumption of animal foods such as red and processed meats, eggs and dairy products and,
288
to a lesser extent, to lower intake of fruits, cereals and nuts in obese and overweight participants (data
289
not shown). The pro-vegetarian score was higher at baseline and over time for participants who
290
presented obesity compared to underweight or normal-weight participants. Obese subjects increased
291
their intake of plant-based foods such as fruits, legumes and nuts during follow-up, and decreased
292
their intake of animal-based foods (Supplementary Table 2) as a large majority of obese participants in
293
our sample (86%) reported dieting during follow-up. The energy intake decreased during the follow-up
Version postprint
as the protein intake but the percent of plant protein in the protein intake increased (Supplementary
295
Table 2). Obese participants at baseline may have changed their dietary intake over time, possibly
296
increasing plant-based food intake.
297
For this analysis, two indicators were chosen among several potential indicators to assess the role of
298
plant foods in the diet. We have chosen the PEIPP rather than the ratio of plant proteins to animal
299
proteins also used in the literature, since our preliminary analyses showed that this indicator reflected
300
the percent energy intake provided by animal proteins. Indeed, when the PEIPP increased, the
301
percent of energy intake provided by animal proteins decreased. Also, an increase in PEIPP was
302
associated with a decrease of the intake of protein: 90.3 g in the first quartile of PEIPP and 83.1 g in
303
the last quartile (p<0.01, Supplementary Table 3). Thereby, an increase in PEIPP not reflects a diet
304
with more protein but it represents an increase of the proportion of plant consumption in the diet from a
305
nutritional point of view. As expected, an increase in the pro-vegetarian score was associated with an
306
increase of plant product intakes but a decrease of the animal product intakes (Supplementary Table
307
4).
308
Interpretation of present results should take into account several limitations. Since the cohort is not
309
random, women and individuals belonging to highly educated groups may be overrepresented. These
310
individuals tend to have lifestyles more in line with nutritional recommendations than the general
311
population [59, 60]. Analyses, however, were weighted according to French population
socio-312
demographic distribution, which allows bias to be limited. Compared to a nationally representative
313
study (Etude Nationale Nutrition Santé (ENNS) 2006-2007), we observed in our study slightly lower
314
total energy and protein intakes at baseline in men (means for energy: 2291.3 kcal (SE: 26.9) vs.
315
2388.7 kcal (SE: 27.7); means for protein: 93.7 g (SE: 1.7) vs. 98.3 g (SE: 1.1), respectively) while
316
intakes were slightly higher in women (means for energy: 1830.4 kcal (SE: 12.2) vs. 1713.7 kcal (SE:
317
14.0); means for protein: 77.6 g (SE: 0.5) vs. 74.1 g (SE: 0.7), respectively) [60]. Compared to another
318
nationally representative study (Individual and National Consumption Survey 2 (INCA2) 2006–2007),
319
total energy intake was also lower in men of our sample (means 2291 vs. 2500 kcal, respectively) but
320
equivalent in women and protein intakes were equivalent for men and women [32]. At baseline, the
321
portion of energy intake from plant proteins was similar compared to the INCA2 (5.4 vs. 4.9%) while
322
the percent of energy intake without alcohol provided by protein in our study was slightly higher in
Version postprint
women (17.6 vs. 16.5%, respectively) but similar in men [32]. Difference regarding men in our sample
324
may be due to a bias induced by volunteering: male participants may be more aware and may attach
325
greater importance to nutrition issues and so may make dietary choices more in line with nutritional
326
recommendations than those of the general population. Caution is therefore needed when interpreting
327
and generalizing our results. Differences in dietary intake between gender and education categories
328
are probably wider in the general population, which may explain why there was no significant
329
association with indicators over time. The large size of our sample may have also been a constraint,
330
since significant results were found even when the difference in intake according to categories was
331
slight. However, the large sample size was also a strength, as it enabled a wide diversity of individual
332
characteristics. Validity of self-reported height and weight can be questioned therefore it has been
333
evaluated by a previous study conducted in the NutriNet-Santé cohort, showing that they can be
334
considered as valid enough to be used [44]. The question of accuracy of web-based self-reported data
335
also arises for repeated 24-h dietary records compared to interviews by trained dietitians. However,
336
the validity of our web-based self-reported dietary record tool was tested against 24-h urinary and
337
plasma biomarkers. It showed that the web-based dietary record tool used in the NutriNet-Santé study
338
performs well at estimating protein (correlations with urinary, 0.61 in men, 0.64 in women) and
339
potassium (correlations with urinary, 0.78 in men, 0.42 in women) intakes, and fairly well at estimating
340
fruits and vegetables (correlation with plasma beta-carotene, 0.35 in men and 0.41 in women), fish
341
(correlation with plasma docosahexaenoic acid and eicosapentaenoic acid, 0.51 in men and 0.54 in
342
women), beta-carotene (correlations with plasma, 0.37 in men, 0.38 in women), vitamin C (correlations
343
with plasma, 0.58 in men, 0.32 in women), sodium (correlations with urinary, 0.47 in men, 0.37 in
344
women), and n-3 fatty acids intakes (correlations with plasma, 0.36 in men, 0.38 in women) [37, 38]. In
345
addition, a pilot study comparing our web-based 24-h record tool with dietitian interviews showed
346
strong agreement between the two methods, particularly for plant-based vs. animal-based food intakes
347
[36]. Some participants may belong to the same household and this may modify the results but this
348
information has not been collected. Finally, we did not take into consideration life-events even though
349
previous studies shown that life-events can influence dietary intake [61].
Version postprint
Conclusion
351
Our findings provide useful information on individual characteristics associated with the contribution of
352
plant-based foods to the overall diet, and changes over time, associated with age, education and BMI.
353
Further studies targeting specific subgroups known to have changed their intake of these foods are
354
needed to understand their motivation to change and identify levers affecting the rebalance of the
355
contribution of plant vs. animal foods in the diet.
356
357
Conflict of interest: On behalf of all authors, the corresponding author states that there is no conflict
358
of interest.
Version postprint
References
1.
Burlingame B, Dernini, Nutrition and Consumer Protection Division, Food and Agriculture
Organization of the United Nations (FAO) (2012) Sustainable diets and biodiversity - Directions
and solutions for policy research and action. FAO, Rome
2.
Carlsson-Kanyama A, González AD (2009) Potential contributions of food consumption patterns
to climate change. Am J Clin Nutr 89:1704S–1709S . doi: 10.3945/ajcn.2009.26736AA
3.
McMichael AJ, Powles JW, Butler CD, Uauy R (2007) Food, livestock production, energy, climate
change, and health. Lancet Lond Engl 370:1253–1263 . doi: 10.1016/S0140-6736(07)61256-2
4.
World Cancer Research Fund, American Institute for Cancer Research (2007) Food, nutrition,
physical activity and the prevention of cancer: a global perspective. American Institute for
Cancer Research, Washington, D.C
5.
Micha R, Wallace SK, Mozaffarian D (2010) Red and processed meat consumption and risk of
incident coronary heart disease, stroke, and diabetes mellitus: a systematic review and
meta-analysis. Circulation 121:2271–2283 . doi: 10.1161/CIRCULATIONAHA.109.924977
6.
Sinha R, Cross AJ, Graubard BI, et al (2009) Meat intake and mortality: a prospective study of
over half a million people. Arch Intern Med 169:562–571 . doi: 10.1001/archinternmed.2009.6
7.
Pan A, Sun Q, Bernstein AM, et al (2012) Red meat consumption and mortality: results from 2
prospective cohort studies. Arch Intern Med 172:555–563 . doi:
10.1001/archinternmed.2011.2287
8.
Nagao M, Iso H, Yamagishi K, et al (2012) Meat consumption in relation to mortality from
cardiovascular disease among Japanese men and women. Eur J Clin Nutr 66:687–693 . doi:
10.1038/ejcn.2012.6
9.
Huang T, Yang B, Zheng J, et al (2012) Cardiovascular disease mortality and cancer incidence in
vegetarians: a meta-analysis and systematic review. Ann Nutr Metab 60:233–240 . doi:
10.1159/000337301
10. Aston LM, Smith JN, Powles JW (2012) Impact of a reduced red and processed meat dietary
pattern on disease risks and greenhouse gas emissions in the UK: a modelling study. BMJ Open
2: . doi: 10.1136/bmjopen-2012-001072
11. Scarborough P, Allender S, Clarke D, et al (2012) Modelling the health impact of
environmentally sustainable dietary scenarios in the UK. Eur J Clin Nutr 66:710–715 . doi:
10.1038/ejcn.2012.34
12. Key TJ, Appleby PN, Crowe FL, et al (2014) Cancer in British vegetarians: updated analyses of
4998 incident cancers in a cohort of 32,491 meat eaters, 8612 fish eaters, 18,298 vegetarians,
and 2246 vegans. Am J Clin Nutr 100 Suppl 1:378S–85S . doi: 10.3945/ajcn.113.071266
13. Chang-Claude J, Hermann S, Eilber U, Steindorf K (2005) Lifestyle determinants and mortality in
German vegetarians and health-conscious persons: results of a 21-year follow-up. Cancer
Epidemiol Biomark Prev Publ Am Assoc Cancer Res Cosponsored Am Soc Prev Oncol 14:963–
968 . doi: 10.1158/1055-9965.EPI-04-0696
Version postprint
14. Key TJ, Appleby PN, Spencer EA, et al (2009) Mortality in British vegetarians: results from the
European Prospective Investigation into Cancer and Nutrition (EPIC-Oxford). Am J Clin Nutr
89:1613S–1619S . doi: 10.3945/ajcn.2009.26736L
15. Pimentel D, Pimentel M (2003) Sustainability of meat-based and plant-based diets and the
environment. Am J Clin Nutr 78:660S–663S
16. Darmon N, Drewnowski A (2008) Does social class predict diet quality? Am J Clin Nutr 87:1107–
1117
17. Micha R, Khatibzadeh S, Shi P, et al (2015) Global, regional and national consumption of major
food groups in 1990 and 2010: a systematic analysis including 266 country-specific nutrition
surveys worldwide. BMJ Open 5:e008705 . doi: 10.1136/bmjopen-2015-008705
18. Drewnowski A, Shultz JM (2001) Impact of aging on eating behaviors, food choices, nutrition,
and health status. J Nutr Health Aging 5:75–79
19. Laforge RG, Greene GW, Prochaska JO (1994) Psychosocial factors influencing low fruit and
vegetable consumption. J Behav Med 17:361–374
20. Devine CM, Wolfe WS, Frongillo EA, Bisogni CA (1999) Life-course events and experiences:
association with fruit and vegetable consumption in 3 ethnic groups. J Am Diet Assoc 99:309–
314 . doi: 10.1016/S0002-8223(99)00080-2
21. Lea EJ, Crawford D, Worsley A (2006) Consumers’ readiness to eat a plant-based diet. Eur J Clin
Nutr 60:342–351 . doi: 10.1038/sj.ejcn.1602320
22. Sijtsma FPC, Meyer KA, Steffen LM, et al (2012) Longitudinal trends in diet and effects of sex,
race, and education on dietary quality score change: the Coronary Artery Risk Development in
Young Adults study. Am J Clin Nutr 95:580–586 . doi: 10.3945/ajcn.111.020719
23. Arabshahi S, Lahmann PH, Williams GM, et al (2011) Longitudinal change in diet quality in
Australian adults varies by demographic, socio-economic, and lifestyle characteristics. J Nutr
141:1871–1879 . doi: 10.3945/jn.111.140822
24. Roos E, Talala K, Laaksonen M, et al (2008) Trends of socioeconomic differences in daily
vegetable consumption, 1979-2002. Eur J Clin Nutr 62:823–833 . doi: 10.1038/sj.ejcn.1602798
25. Harrington JM, Dahly DL, Fitzgerald AP, et al (2014) Capturing changes in dietary patterns
among older adults: a latent class analysis of an ageing Irish cohort. Public Health Nutr
17:2674–2686 . doi: 10.1017/S1368980014000111
26. Eng PM, Kawachi I, Fitzmaurice G, Rimm EB (2005) Effects of marital transitions on changes in
dietary and other health behaviours in US male health professionals. J Epidemiol Community
Health 59:56–62 . doi: 10.1136/jech.2004.020073
27. Lee S, Cho E, Grodstein F, et al (2005) Effects of marital transitions on changes in dietary and
other health behaviours in US women. Int J Epidemiol 34:69–78 . doi: 10.1093/ije/dyh258
28. Vinther JL, Conklin AI, Wareham NJ, Monsivais P (2016) Marital transitions and associated
changes in fruit and vegetable intake: Findings from the population-based prospective
EPIC-Norfolk cohort, UK. Soc Sci Med 1982 157:120–126 . doi: 10.1016/j.socscimed.2016.04.004
Version postprint
29. Vainio A, Niva M, Jallinoja P, Latvala T (2016) From beef to beans: Eating motives and the
replacement of animal proteins with plant proteins among Finnish consumers. Appetite
106:92–100 . doi: 10.1016/j.appet.2016.03.002
30. Martínez-González MA, Sánchez-Tainta A, Corella D, et al (2014) A provegetarian food pattern
and reduction in total mortality in the Prevención con Dieta Mediterránea (PREDIMED) study.
Am J Clin Nutr 100 Suppl 1:320S–8S . doi: 10.3945/ajcn.113.071431
31. Lin Y, Bolca S, Vandevijvere S, et al (2011) Plant and animal protein intake and its association
with overweight and obesity among the Belgian population. Br J Nutr 105:1106–1116 . doi:
10.1017/S0007114510004642
32. Camilleri GM, Verger EO, Huneau J-F, et al (2013) Plant and animal protein intakes are
differently associated with nutrient adequacy of the diet of French adults. J Nutr 143:1466–
1473 . doi: 10.3945/jn.113.177113
33. Lin Y, Bolca S, Vandevijvere S, et al (2011) Dietary sources of animal and plant protein intake
among Flemish preschool children and the association with socio-economic and
lifestyle-related factors. Nutr J 10:97 . doi: 10.1186/1475-2891-10-97
34. Halkjaer J, Olsen A, Bjerregaard LJ, et al (2009) Intake of total, animal and plant proteins, and
their food sources in 10 countries in the European Prospective Investigation into Cancer and
Nutrition. Eur J Clin Nutr 63 Suppl 4:S16-36 . doi: 10.1038/ejcn.2009.73
35. Hercberg S, Castetbon K, Czernichow S, et al (2010) The Nutrinet-Santé Study: a web-based
prospective study on the relationship between nutrition and health and determinants of
dietary patterns and nutritional status. BMC Public Health 10:242 . doi:
10.1186/1471-2458-10-242
36. Touvier M, Kesse-Guyot E, Méjean C, et al (2011) Comparison between an interactive
web-based self-administered 24 h dietary record and an interview by a dietitian for large-scale
epidemiological studies. Br J Nutr 105:1055–1064 . doi: 10.1017/S0007114510004617
37. Lassale C, Castetbon K, Laporte F, et al (2015) Validation of a Web-based, self-administered,
non-consecutive-day dietary record tool against urinary biomarkers. Br J Nutr 113:953–962 .
doi: 10.1017/S0007114515000057
38. Lassale C, Castetbon K, Laporte F, et al (2016) Correlations between Fruit, Vegetables, Fish,
Vitamins, and Fatty Acids Estimated by Web-Based Nonconsecutive Dietary Records and
Respective Biomarkers of Nutritional Status. J Acad Nutr Diet 116:427–438.e5 . doi:
10.1016/j.jand.2015.09.017
39. Le Moullec N, Deheeger M, Preziosi P, et al (1996) Validation du manuel-photos utilisé pour
l’enquête alimentaire de l’étude SU.VI.MAX. Cah Nutr Diététique 31:158–164
40. Arnault N, Caillot L, Castetbon K, et al (2013) Table de Composition des aliments
NutriNet-Santé. Edition Économica, Paris, France
41. Bianchi CM, Egnell M, Huneau J-F, Mariotti F (2016) Plant Protein Intake and Dietary Diversity
Are Independently Associated with Nutrient Adequacy in French Adults. J Nutr 146:2351–2360 .
doi: 10.3945/jn.116.236869
Version postprint
43. World Health Organization (WHO) Expert Committee (1995) Physical status: the use and
interpretation of anthropometry. Report of a WHO Expert Committee. World Health Organ
Tech Rep Ser 854:1–452
44. Lassale C, Péneau S, Touvier M, et al (2013) Validity of web-based self-reported weight and
height: results of the Nutrinet-Santé study. J Med Internet Res 15:e152 . doi: 10.2196/jmir.2575
45. Black AE (2000) Critical evaluation of energy intake using the Goldberg cut-off for energy
intake:basal metabolic rate. A practical guide to its calculation, use and limitations. Int J Obes
Relat Metab Disord J Int Assoc Study Obes 24:1119–1130
46. Schofield WN (1985) Predicting basal metabolic rate, new standards and review of previous
work. Hum Nutr Clin Nutr 39 Suppl 1:5–41
47. Institut national de la statistique et des études économiques (Insee) La macro SAS CALMAR.
http://www.insee.fr/fr/methodes/default.asp?page=outils/calmar/accueil_calmar.htm.
Accessed 20 Mar 2016
48. Laird NM, Ware JH (1982) Random-effects models for longitudinal data. Biometrics 38:963–974
49. FranceAgriMer (2011) Crise économique et comportements de consommation alimentaire des
Français. Les cahiers de FranceAgriMer Les études
50. FranceAgriMer (2015) Impact de la crise économique sur la consommation de viandes et
évolutions des comportements alimentaires. Les synthèses de FranceAgriMer Élevage / Viandes
21:
51. O’Doherty Jensen K, Holm L (1999) Preferences, quantities and concerns: socio-cultural
perspectives on the gendered consumption of foods. Eur J Clin Nutr 53:351–359
52. Kimura Y, Ogawa H, Yoshihara A, et al (2013) Evaluation of chewing ability and its relationship
with activities of daily living, depression, cognitive status and food intake in the
community-dwelling elderly. Geriatr Gerontol Int 13:718–725 . doi: 10.1111/ggi.12006
53. Galobardes B, Shaw M, Lawlor DA, et al (2006) Indicators of socioeconomic position (part 1). J
Epidemiol Community Health 60:7–12 . doi: 10.1136/jech.2004.023531
54. Méjean C, Si Hassen W, Lecossais C, et al (2016) Socio-economic indicators are independently
associated with intake of animal foods in French adults. Public Health Nutr 19:3146–3157 . doi:
10.1017/S1368980016001610
55. Touvier M, Kesse-Guyot E, Méjean C, et al (2010) Variations in compliance with
recommendations and types of meat/seafood/eggs according to sociodemographic and
socioeconomic categories. Ann Nutr Metab 56:65–73 . doi: 10.1159/000271469
56. Hercberg S, Chat-Yung S, Chaulia M (2008) The French National Nutrition and Health Program:
2001-2006-2010. Int J Public Health 53:68–77
57. Schäfer M, Herde A, Kropp C, others (2010) Life events as turning points for sustainable
nutrition. Syst Innov Sustain 4:210–226
Version postprint
58. Bujnowski D, Xun P, Daviglus ML, et al (2011) Longitudinal association between animal and
vegetable protein intake and obesity among adult males in the United States: the Chicago
Western Electric Study. J Am Diet Assoc 111:1150–1155.e1 . doi: 10.1016/j.jada.2011.05.002
59. Andreeva VA, Salanave B, Castetbon K, et al (2015) Comparison of the sociodemographic
characteristics of the large NutriNet-Santé e-cohort with French Census data: the issue of
volunteer bias revisited. J Epidemiol Community Health 69:893–898 . doi:
10.1136/jech-2014-205263
60. Andreeva VA, Deschamps V, Salanave B, et al (2016) Comparison of Dietary Intakes Between a
Large Online Cohort Study (Etude NutriNet-Santé) and a Nationally Representative
Cross-Sectional Study (Etude Nationale Nutrition Santé) in France: Addressing the Issue of
Generalizability in E-Epidemiology. Am J Epidemiol 184:660–669 . doi: 10.1093/aje/kww016
61. Wethington E (2005) An overview of the life course perspective: implications for health and
Version postprint
Figure 1. Selection of the analysis sample from the NutriNet-Santé study cohort.
492 self-reported vegetarian and vegan participants
excluded
31 296 participants
499 excluded as they did not live in the French metropolitan
area
33 212 participants in Nutrinet-Santé study - included between May 2009 and April 2010 - with ≥ 2 sets of 24-h dietary records
- who were not energy-underreporting subjects
32 221 omnivorous participants at baseline (n0)
268 excluded with missing data for variables at baseline
(BMI, educational level and size of the UU)
32 713 persons living in the French metropolitan area
657 excluded with missing data for household composition at the last
follow-up
15 615 participants in the final sample
15 681 excluded who were lost to follow-up after four years
Version postprint
Table 1. Characteristics of the sample (n = 15,615).
Raw data Weighted
data* Census estimates** n % % % Sex Women 11427 73.2 52.4 52.4 Men 4188 26.8 47.6 47.6 Age class 18-29 Years 1913 12.3 16.0 19.2 30-49 Years 5606 35.9 36.5 34.9 50-64 Years 6515 41.7 25.9 24.4 ≥ 65 Years 1581 10.1 21.6 21.6 Educational level None or primary 441 2.8 11.4 25.3 Secondary 2038 13.1 26.0 34.3
High school graduate 3058 19.6 40.4 15.9 Undergraduate 4682 30.0 10.3 11.8
Postgraduate 5396 34.6 11.9 12.7
Household composition
Living alone 2656 17.0 5.1 14.8
Living with at least one adult, but without a child 8487 54.4 58.3 27.3 Living with a child 4472 28.6 36.6 57.9
Size of the urban unit of residence
Rural 3420 21.9 22.4 25.8 < 20,000 inhabitants 2535 16.2 18.0 16.7 20,000 - 200,000 inhabitants 2727 17.5 18.6 18.5 > 200,000 inhabitants 4123 26.4 24.9 22.5 Paris 2810 18.0 16.0 16.5 BMI class
Underweight or normal weight 11020 70.6 62.1 50.7*** Overweight 3466 22.2 27.7 32.4***
Obesity 1129 7.2 10.3 16.9***
* Weighting accounted for each gender and social and demographic characteristics compared to the national census (age, occupational categories, area of residence, marital status and educational level).
** 2009 national estimates for individuals aged ≥18 years in metropolitan France
*** prevalence from a nationally representative study (Etude Nationale Nutrition Santé (ENNS) 2006-2007)
Version postprint
Table 2. Comparison of the percent energy intake* provided by plant proteins and the pro-vegetarian
score according to individual characteristics at baseline in French adults participating in the NutriNet-Santé cohort (n = 15,615)**.
Percent energy intake provided by plant
proteins*** Pro-vegetarian score
†
Mean ± SE p-value Mean ± SE p-value Total sample 5.4 ± 0.1 35.4 ± 0.2 Sex 0.69 0.66 Women 5,4 ± 0.03 35.5 ± 0.2 Men 5,4 ± 0.1 35.3 ± 0.4 Age class < 0.0001 < 0.0001 18-29 Years 4,9 ± 0,1 34.1 ± 1.0 30-49 Years 5,3 ± 0,2 34.8 ± 0.4 50-64 Years 5,6 ± 0,1 35.6 ± 0.3 ≥ 65 Years 5,8 ± 0,1 37.2 ± 0.2 Educational level 0.03 0.09 None or primary 5,3 ± 0,4 34.4 ± 0.9 Secondary 5,6 ± 0,1 35.7 ± 0.3 High school graduate 5,3 ± 0,1 35.4 ± 0.5 Undergraduate 5,3 ± 0,04 35.4 ± 0.2 Postgraduate 5,5 ± 0,03 36.0 ± 0.1Household composition 0.03 < 0.0001 Living alone 5,6 ± 0,1 36.2 ± 0.4
Living with at least one adult, but
without a child 5,5 ± 0,1 36.1 ± 0.3 Living with a child 5,1 ± 0,1 34.3 ± 0.4
Size of urban unit of residence 0.19 0.08
Rural 5,3 ± 0,1 35.0 ± 0.3 < 20,000 inhabitants 5,7 ± 0,2 35.1 ± 0.3 20,000 – 200,000 inhabitants 5,3 ± 0,1 35.9 ± 0.7 > 200,000 inhabitants 5,3 ± 0,2 35.3 ± 0.6 Paris 5,3 ± 0,1 36.0 ± 0.2 BMI class 0.02 0.0001
Underweight or normal weight 5,4 ± 0,1 35.8 ± 0.3 Overweight 5,5 ± 0,1 35.3 ± 0.3 Obesity 5,1 ± 0,1 33.5 ± 0.5
Version postprint
* Energy intake without alcohol.
** Sex-specific data weighted for age, occupational categories, area of residence, marital status and educational level, using 2009 national census. Student’s t-test or analysis of variance (ANOVA) as appropriate.
*** Percentage of daily energy intake without alcohol provided by plant proteins.
† Score of adherence to a pro-vegetarian food pattern elaborated by Martínez-González et al. Energy-adjusted estimates of consumption of seven plant and five animal food groups were ranked according to sex-specific quintiles. The quintiles were scored from 1 to 5 and these scores were summed up to obtain an overall score ranging from 12 (lowest adherence) to 60 (highest adherence).
Version postprint
Table 3. Multivariate linear mixed analysis* showing associations between baseline individual
characteristics, changes in percent energy intake** provided by plant proteins and the pro-vegetarian score up to 6 years in French adults participating in the NutriNet-Santé cohort (n = 15,615)***.
Percent energy intake from
plant proteins
†
Pro-vegetarian score‡
β (95% CI) p-value β (95% CI) p-value Time 0.005 (-0.03, 0.04) 0.78 0.23 (0.08, 0.37) 0.002 Sex Men 0.06 (0.01, 0.11) 0.01 -0.07 (-0.26, 0.12) 0.49 Men*time 0.001 (-0.01, 0.01) 0.92 -0.04 (-0.10, 0.01) 0.10 Age class 18-29 years Reference Reference 30-49 years 0.46 (0.39, 0.53) < 0.0001 1.57 (1.28, 1.86) < 0.0001 30-49 years*time -0.01 (-0.03, 0.004) 0.13 -0.04 (-0.13, 0.04) 0.30 50-64 years 0.68 (0.61, 0.75) < 0.0001 2.66 (2.37, 2.94) < 0.0001 50-64 years*time -0.04 (-0.06, -0.02) < 0.0001 -0.09 (-0.17, -0.01) 0.04 ≥ 65 years 0.80 (0.71, 0.88) < 0.0001 3.30 (2.97, 3.64) < 0.0001 ≥ 65 years*time -0.05 (-0.07, -0.03) < 0.0001 -0.13 (-0.22, -0.04) 0.01 Educational level None or primary Reference
Reference
Secondary -0.001 (-0.11, 0.11) 0.99 -0.01 (-0.44, 0.43) 0.98 Secondary*time 0.01 (-0.02, 0.04) 0.44 -0.05 (-0.16, 0.07) 0.43 High School graduate 0.09 (-0.02, 0.19) 0.12 0.47 (0.05, 0.89) 0.03 High School graduate*time 0.003 (-0.02, 0.03) 0.80 -0.07 (-0.18, 0.03) 0.19 Undergraduate 0.12 (0.01, 0.23) 0.03 0.65 (0.22, 1.08) 0.003 Undergraduate*time 0.01 (-0.01, 0.04) 0.38 -0.08 (-0.19, 0.04) 0.18 Postgraduate 0.23 (0.12, 0.34) < 0.0001 1.19 (0.75, 1.62) < 0.0001 Postgraduate*time -0.01 (-0.03, 0.02) 0.64 -0.07 (-0.18, 0.04) 0.22 Household composition Living with a child Reference
Reference
Living alone 0.11 (0.02, 0.21) 0.02 0.05 (-0.34, 0.43) 0.82 Living alone*time 0.0004 (-0.02, 0.02) 0.97 -0.05 (-0.15, 0.05) 0.31 Living with at least one adult, but
without a child 0.03 (-0.03, 0.09) 0.31 0.25 (-0.01, 0.51) 0.05 Living with at least one adult, but
without a child *time -0.002 (-0.02, 0.01) 0.84 -0.07 (-0.14, -0.01) 0.03
Size of urban unit of residence
20,000 – 200,000 inhabitants Reference Reference Rural -0.04 (-0.1, 0.03) 0.25 -0.19 (-0.46, 0.08) 0.16 Rural*time -0.005 (-0.02, 0.01) 0.60 -0.01 (-0.09, 0.06) 0.79 < 20,000 inhabitants -0.02 (-0.09, 0.05) 0.53 -0.15 (-0.44, 0.14) 0.31 < 20,000 inhabitants*time -0.001 (-0.02, 0.02) 0.95 0.05 (-0.03, 0.13) 0.19 > 200,000 inhabitants -0.03 (-0.09, 0.03) 0.34 0.15 (-0.12, 0.41) 0.27 > 200,000 inhabitants*time -0.003 (-0.02, 0.01) 0.69 0.01 (-0.06, 0.08) 0.80
Version postprint
Paris -0.01 (-0.07, 0.06) 0.88 0.07 (-0.22, 0.35) 0.64 Paris*time -0.01 (-0.03, 0.01) 0.37 -0.03 (-0.11, 0.05) 0.53
BMI class
Underweight or normal weight Reference
Reference Overweight -0.28 (-0.33, -0.23) < 0.0001 -1.21 (-1.42, -1.01) < 0.0001 Overweight*time 0.004 (-0.01, 0.02) 0.53 0.01 (-0.05, 0.06) 0.80 Obesity -0.48 (-0.56, -0.41) < 0.0001 -2.31 (-2.63, -1.98) < 0.0001 Obesity*time 0.02 (-0.005, 0.04) 0.14 0.09 (0.004, 0.18) 0.04
* Adjusted for household composition at the last follow-up.
** Energy intake without alcohol.
*** Sex-specific data weighted for age, occupational categories, area of residence, marital status and educational level, using 2009 national census
† Percentage of daily energy intake without alcohol provided by plant proteins.
‡ Score of adherence to a pro-vegetarian food pattern elaborated by Martínez-González et al. Energy-adjusted estimates of consumption of seven plant and five animal food groups were ranked according to sex-specific quintiles. The quintiles were scored from 1 to 5 and these scores were summed up to obtain an overall score ranging from 12 (lowest adherence) to 60 (highest adherence).