Publisher’s version / Version de l'éditeur:
Cement and Concrete Composites, 26, July 5, pp. 481-489, 2004-07-01
READ THESE TERMS AND CONDITIONS CAREFULLY BEFORE USING THIS WEBSITE.
https://nrc-publications.canada.ca/eng/copyright
Vous avez des questions? Nous pouvons vous aider. Pour communiquer directement avec un auteur, consultez la
première page de la revue dans laquelle son article a été publié afin de trouver ses coordonnées. Si vous n’arrivez pas à les repérer, communiquez avec nous à PublicationsArchive-ArchivesPublications@nrc-cnrc.gc.ca.
Questions? Contact the NRC Publications Archive team at
PublicationsArchive-ArchivesPublications@nrc-cnrc.gc.ca. If you wish to email the authors directly, please see the first page of the publication for their contact information.
NRC Publications Archive
Archives des publications du CNRC
This publication could be one of several versions: author’s original, accepted manuscript or the publisher’s version. / La version de cette publication peut être l’une des suivantes : la version prépublication de l’auteur, la version acceptée du manuscrit ou la version de l’éditeur.
For the publisher’s version, please access the DOI link below./ Pour consulter la version de l’éditeur, utilisez le lien DOI ci-dessous.
https://doi.org/10.1016/S0958-9465(03)00079-9
Access and use of this website and the material on it are subject to the Terms and Conditions set forth at
The Early age short-term creep of hardening cement paste: load-induced hydration effects
Tamtsia, B. T.; Beaudoin, J. J.; Marchand, J.
https://publications-cnrc.canada.ca/fra/droits
L’accès à ce site Web et l’utilisation de son contenu sont assujettis aux conditions présentées dans le site
LISEZ CES CONDITIONS ATTENTIVEMENT AVANT D’UTILISER CE SITE WEB.
NRC Publications Record / Notice d'Archives des publications de CNRC: https://nrc-publications.canada.ca/eng/view/object/?id=c258004a-65e1-4326-adfe-0343e0cdce47 https://publications-cnrc.canada.ca/fra/voir/objet/?id=c258004a-65e1-4326-adfe-0343e0cdce47
The Early age short-term creep of hardening cement paste: load-induced hydration effects
Tamtsia, B.T.; Beaudoin, J.J.; Marchand, J.
NRCC-45703
A version of this document is published in / Une version de ce document se trouve dans : Cement & Concrete Composites, v. 26, no. 5, July 2004, pp. 481-489
The early-age short-term creep of hardening cement paste:
Load-induced hydration effects
Basile T. Tamtsiaa, James J. Beaudoina and Jacques Marchandb
a
Institute for Research in Construction, National Research Council of Canada Ottawa, Ontario, Canada, K1A OR6
b
Department de génie civil, Université Laval, Sainte-Foy, Québec, Canada, G1K 7P4
ABSTRACT
Short-term creep and shrinkage strains were monitored at early age on hydrated Portland cement pastes prepared with two different water-cement ratios (0.35 and 0.50). Creep experiments were conducted in an environmentally controlled chamber maintained at (96 ± 2)% relative humidity. The three ages at loading investigated were 18, 24 and 30 hours. The stress- strength ratio applied to the specimens at the age of loading, using a miniature loading system, was 0.30. Cement paste specimens were in the form of “T-shaped” columns with a minimum thickness value (for the web and flanges) of less than 1.2 mm. Load-induced hydration (not normally considered in creep prediction) of normal strength cement paste (w/c=0.50) was found to occur at early times following the loading at 18 hours.
An analytical model was developed in order to predict the creep coefficient of normal and high strength cement pastes from early age data. The model accounts for load-induced hydration effects.
1. Introduction
Creep and shrinkage of Portland cement systems (paste, mortar and concrete) are known to be complex phenomena. However, the operative mechanisms, after almost a century of wide investigation, are not yet clearly understood [1,2]. Creep and shrinkage, however, are generally believed to be very sensitive to the process of curing, the surrounding environment, the specimen size, and especially the composition of the paste or concrete [2-5].
The microstructural features of very young cement paste make its role in the creep process difficult to study by conventional means, particularly if drying takes place during the experiment. The recent knowledge of the microstructure of calcium silicate hydrates (C-S-H) obtained from various techniques (TGA/DTA, IR Spectroscopy, NMR etc.) has led to a better understanding of the distribution of water within the paste and the C-S-H [1-2;6-8]. New approaches for studying creep and shrinkage that minimize the moisture gradients within the specimen may provide practical insights and contribute to the resolution of some uncertainties with respect to deformation mechanisms. In this study creep data were obtained on miniature specimens under environmentally controlled conditions. The effects of load-induced hydration (i.e. hydration attributed uniquely to the application of sustained load and in addition to that which occurs with the normal course of hydration in a stress-free state) on creep prediction were assessed.
2. Experimental Program
2.1 Specimen preparation and characteristics
The hydrated cement paste used for this experimental study was made with type 10 normal Portland cement mixed with de-aired distilled water at two different water cement ratios (0.35 and 0.50). The Portland cement had the following composition (in percent): SiO2 (20.72); Al2O3 (5.87); Fe2O3 (3.07); CaO (62.66); MgO (3.46); SO3 (2.18) and free
lime (0.24). The Bogue composition was as follows: C3S (46.5); C2S (24.6); C3A (10.4)
and C4AF (8.3). The fineness of the cement was 340 m2/kg. Mixing details are provided
elsewhere [9]. The cylinders were slowly rotated while the paste hardened in order to avoid bleeding and to produce a more homogeneous product. Specimens were demoulded after 18, 24 and 30 hours and stored in lime-saturated water at (22 ± 2)°C up to the testing period.
The compressive strength values at 18, 24 and 30 hours were 15, 21 and 24 MPa for normal strength paste (w/c=0.50) and 25.3, 41.7 and 53.0 MPa for the high strength paste (w/c=0.35) respectively. The initial stress-strength ratio for the creep tests performed on specimens at any stage of hydration was 0.30. The samples were fabricated from paste cylinders and machined to obtain a “T-shaped” specimen with flanges and web about 1.2 mm thick with a height of 25.4 mm and a flange width of 5.7 mm. Several specimens could be cut from the same cylinder. A special jig was constructed to facilitate the cutting of the specimens with a precision saw.
2.2 Thermal analysis
Differential Thermogravimetric Analysis (DTGA) was used to characterize the state of water in the samples. A Dupont 951 Thermal Analyzer placed in an environmentally controlled chamber was used for the tests. From thermogravimetric analysis data the degree of hydration of Portland cement paste while hardening was determined for the loaded and unloaded samples at early age. Powers and Brownyard [6], defined the degree of hydration as the ratio of non-evaporable water content of the cement paste at time t to the non-evaporable water content at the complete hydration of the cement paste (at t=∞). For a typical Portland cement paste, the latter is generally about 25% by mass of the cement content while the bound water at time t is determined by the mass loss of the paste heated between 105°C and 1050°C.
Other definitions of bound water have been proposed by Danielsson [10] giving slightly different results. In the present study small variations in the degree of hydration due to different methods of measurement were not considered significant, as it is the relative time dependent changes that are of primary interest.
Additional comment on the degree of hydration measurements is made to clarify the uniqueness of the experiment designed to determine a load-induced hydration effect. As stated previously estimation of degree of hydration was carried out thermogravimetrically. Non-evaporable water content determinations formed the basis for the calculations (details provided in the following section).
The creep frames were designed to test two specimens simultaneously. Several miniature creep samples were cut from the same stock i.e. a cylinder 80 mm long. This provide samples of essentially the same paste material. At the end of a given time interval the
samples were removed from the creep apparatus for thermal analyses. Companion specimens in other load frames were not removed but remained under load until a further specified time had elapsed. Thus the non-evaporable water content determinations were carried out on two specimens each time for a set of time intervals. Several increasing time intervals were selected to enable the construction of ‘load-induced’ degree of hydration versus time curves. Previous work by Zhou and Beaudoin [11] on the hydration of both Portland cement paste and C3S paste under applied hydrostatic stress
also indicated a stress-induced hydration effect. The degree of hydration was determined using two different measuring techniques on a large number of replicate samples. One method utilized the endothermic transition for C3S at about 915 °C to estimate the
amount of untreated C3S [12]. The other used TGA to estimate the amount of
non-evaporable water. Variation in values of non-non-evaporable water for specimens cut from the same cylinder does not exceed 2%.
2.3 Miniature loading system
The “T-shaped” specimens were mounted on a miniature fixed frame equipped with a loading mechanism and load cell. The system consists of a spring with a constant stiffness of 78.8 N/mm, which is connected at the upper end to a load cell with a maximum capacity of 1112 N. The load can be adjusted through a screw linking the spring to the fixed frame. The lower end of the spring transmits the load to two “T-shaped” specimens through the movable specimen holder. The modified Tuckerman optical extensometers used for length change measurements, were then mounted on the flanges of each of the two “T-shaped” specimens and coupled at their sides with appropriate springs. The assembly was then placed in environmentally controlled cells.
The strains could be determined with a sensitivity of 1x10⁻⁶ mm/mm. Duplicate specimens were used for each test condition. Careful precautions to minimize carbonation were taken in all phases of the experiments including the use of glove boxes flushed with nitrogen. The creep frames were housed in perspex cylindrical containers, which were then placed in the glove boxes providing double protection. This was considered extremely important, as appreciable carbonation can significantly affect deformations and microstructure. Further details of the measurement system are provided in reference 9.
3. The Significance of Degree of Hydration and Early Age Creep
The influence of degree of hydration at the time of loading and during the period of sustained load on creep has been reported by many authors [13-19]. The degree of hydration of specimens under sustained load is estimated (by these authors) from measurements obtained on unloaded samples. It is apparent that the published values increase of hydration under load do not refer to load induced hydration (i.e. the increment in degree of hydration due to the application of the load itself) but rather to hydration that proceeds normally. Load-induced hydration referred to in this paper (see following section) results directly from application of the load. The degree of hydration was determined at intervals of time under sustained load. Specimens were unloaded at given time intervals to determine the degree of hydration. Measurements were made on several companion specimens (cut from the same cylinder) loaded for different time periods as loaded specimens were discarded after each non-evaporable water determination following unloading.
Several authors [13, 14] have developed expressions for creep as functions of degree of hydration at loading and the time-dependent degree of hydration under sustained load. It is apparent that these equations would have to be modified using real-time changes in degree of hydration resulting from the load itself. Scatter of creep data (model versus experiment) appears to be satisfactory (visual) but the model values at any value of the argument can vary by up to 75% [13]. De Shutter [13,14] further states that the temperature influence is incorporated in the hydration model. This implies that temperature does not change the nature of C-S-H. Thus is a moot point especially at early ages. De Shutter raises the question as to whether both creep and hydration at very early age are more fundamentally coupled. Evidence in this paper (see results and discussion) for load-induced hydration strongly suggests that the coupling is real.
Timusk and Gosh conclude that the maturing component of creep appears to arise primarily from the hydration process [18]. They observed that creep does not vary linearly with stress-strength ratio if hydration continues to proceed after loading. It is argued that increased hydration only changes the gel-space ratio which in turn determines compressive strength and creep potential. A load-induced hydration effect would suggest that more fundamental changes occur, possibly to the C-S-H itself.
The work of Ulm and Coussy describing strength growth as chemo-plastic hardening in early age concrete is relevant to a concept including load-induced hydration and is groundbreaking [19]. Macroscopic behavior of concrete including hydration kinetics, autogenous shrinkage and strength development is interpreted through analysis of chemo-mechanical, thermo-chemical and chemo-plastic coupling. The analysis accounts for the evolution of plastic properties including cracking and hardening/softening behavior. It
was assumed that the thermodynamic imbalance of the hydration reaction does not depend on the stress applied in order to eliminate creep effects related to hydration in the modeling. This may need re-examination as it would seem incompatible with the observations of load-induced hydration reported in this work.
Consideration of autogenous shrinkage is relevant as menisci effects can place the matrix skeleton in compression; these effects can contribute to creep. In the test environment of the present work (96% RH) these effects would be minimal. Chemical shrinkage and related microdiffusional processes associated with the hydration reaction also contribute to the observed deformation. These contributions are likely to be small for Portland cement paste conditioned at 96% RH. Ulm has modeled concrete creep based on two fundamental mechanisms – dislocation and micro-diffusion – coupled with time-dependent hydration [20]. A dislocation mechanism(described in terms of slipping-sliding of C-S-H sheets) is assigned to long-term creep. Viscoelastic micro-diffusion based deformation are attributed to early-age microstructural effects. Any modification of the C-S-H due to early age load-induced hydration may have an influence on both short and long-term creep.
Helium diffusion measurements (helium inflow versus time) obtained on cement paste subjected to an applied load provide insight as to the consequences of microstructural change on creep [21]. Helium inflow is significantly reduced under the application of load. Density change of C-S-H due to loss of water (up to 7% by mass) is little affected by stress. It was concluded that the decrease in rate and amount of helium inflow is largely due to constriction of the entrances to vacated interlayer spaces and not to their elimination. It was also felt that water in the spaces has a significant role in resisting
deformation due to stress. In fact it was shown by Feldman that these spaces likely increase in volume. Second drying of cement paste results in an increase in the solid volume observed on first drying [22]. An increase in interlayer volume was interpreted as an increase in the number of creep sites. The idea of interlayer creep sites was subsequently supported and advanced by Wittmann [23] and Bazant [24]. The concept of creep-site creation is relevant to early age phenomena as the conditions of formation of C-S-H are apparently different under load as evidenced by the load-induced hydration effect described in this paper and by Zhou and Beaudoin [11].
4. Test Results and Discussion
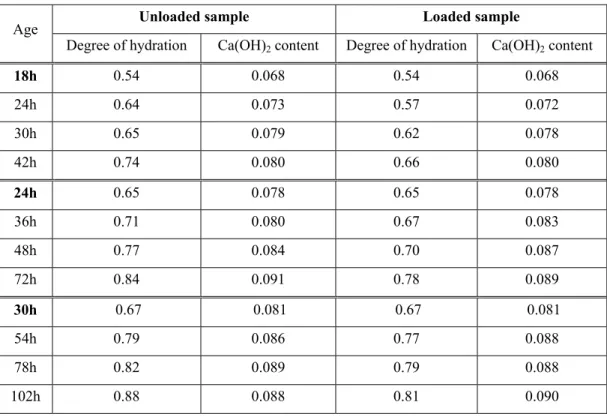
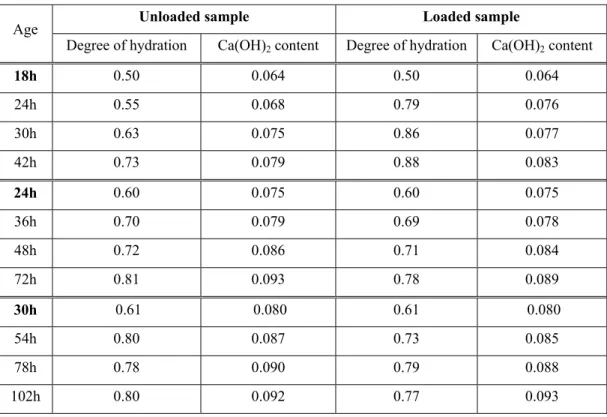
The degrees of hydration as well as the CH content are presented in Tables 1 and 2 for the 0.35 and 0.50 water-cement ratio pastes at different stages of hardening. The results for water-cement ratio = 0.35 presented in Table 1 are not remarkably different for the loaded and unloaded case. However, it appears from Table 2 that the loading of samples at very early age, e.g. 18 hours can increase the hydration (compared to that of unloaded samples) of ordinary hardening cement paste (at w/c=0.50). After 24 hours of hydration or greater, the loading shows a negative effect on the degree of hydration for 0.35 and 0.50 water-cement ratio pastes at various hardening times.
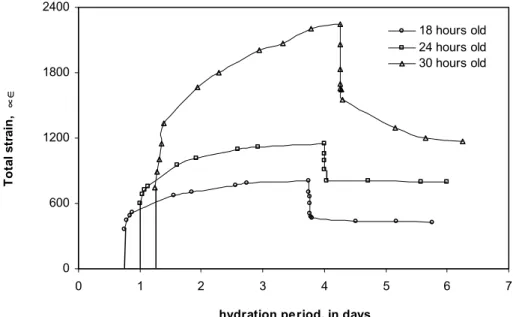
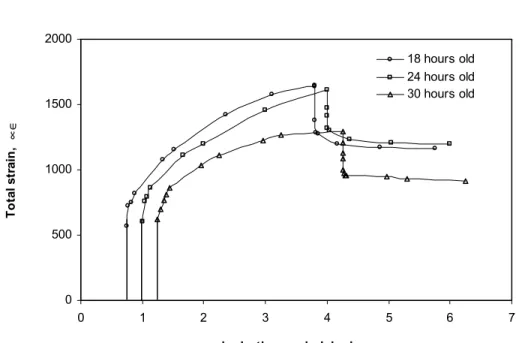
The total strain-time curves for the very young cement paste specimens (w/c=0.35 and 0.50, stress-strength ratio=0.30) under sustained load at 96 ± 2% RH are presented in Figs. 1 and 2. The rate of change of total strain in the first 18 hours seems to be similar for the ordinary cement paste (w/c=0.50) loaded at 18, 24 and 30 hours old. The high strength cement paste (w/c=0.35) shows the rate of change of total strain increasing with
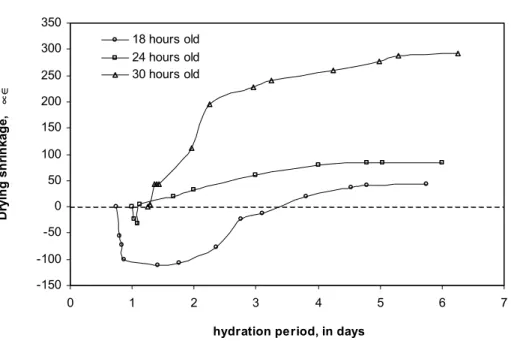
the age of the paste at loading. The total strain after 3 days of loading at age of 18, 24 and 30 hours is 811, 1153, 2248 µ∈ for high strength (w/c=0.35) specimens and 1646, 1614, 1297 µ∈ for normal strength (w/c=0.50) specimens respectively. Strain recovery for the high strength cement paste specimens loaded at 18, 24 and 30 hours old is 384, 356 and 1080 µ∈ respectively while that of normal strength specimens is 484, 416 and 380 µ∈ respectively. The increase in total deformation of the high strength cement paste (particularly the 30 hours old specimens) may be partly due to the larger volume fraction of the hydrated product leading to an increase in creep sites as the hydration progresses. The relatively high shrinkage (rate and magnitude) of the 30 hours old high strength specimens (see Fig. 3) may also contribute to the high value of the total strain. This may be due to menisci effects causing compression on the solid matrix as described by Ulm [20]. Low water-cement ratio pastes are more susceptible to this effect due to possible self-desiccation. Swelling has also been observed by Vernet and Cadoret [25] between 4 to 20 hours. It has been attributed to the precipitation of some coarse crystals during the setting period [25]. This behavior was observed for the w/c=0.50 specimens and particularly for the 18 hours old paste as shown in Fig. 4.
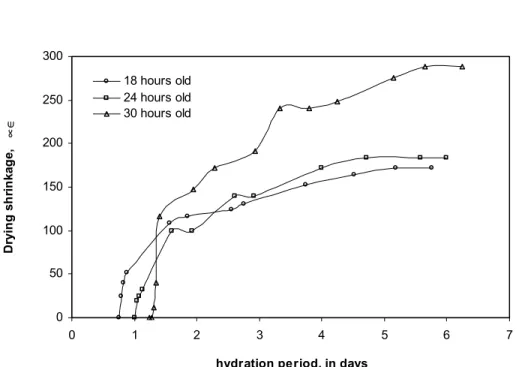
The high and normal strength pastes both exhibit at a very early ages an increase in the shrinkage strain values with time starting from the age at loading. There is an increase in amount of shrinkage with the age of the specimens at loading. After three days the shrinkage strain for the high strength cement paste specimens loaded at 18, 24 and 30 hours old is 152, 176 and 248 µ∈ respectively while that of normal strength specimens is 20, 80 and 260 µ∈ respectively. Substantial evidence has been presented that indicates that the shrinkage of young concrete is higher as the water/cement ratio is lower [26].
The high strength 18 hours old specimens do not show any swelling indicating that it either takes place earlier or it may be less of a factor in the behavior of high strength paste than in normal strength paste.
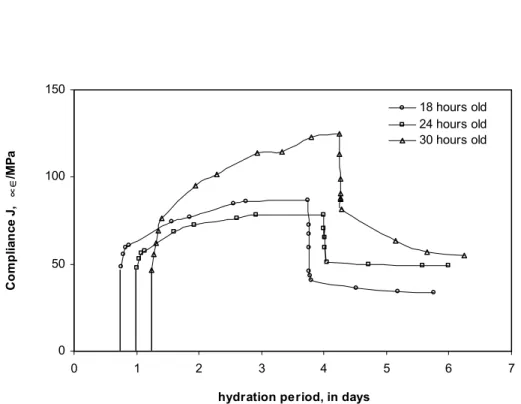
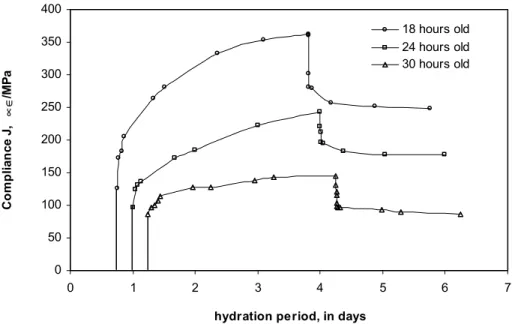
The compliance J of the high strength cement paste is lower at any age of loading compared to that of normal strength specimens (see Figs. 5 and 6). For high strength paste (w/c=0.35) the specimens loaded at 30 hours show a significant compliance (rate and magnitude) with a behavior totally different from the normal strength (w/c=0.50) paste in which the magnitude of creep or compliance decreases with the increase of the age at loading. The compliance recovery of the normal strength paste also decreases with the age at loading (see Fig. 6).
There may be two factors governing the magnitude of the compliance - the degree of hydration and porosity. These factors are controlled by the water-cement ratio. The compliance process may have a greater dependence on the state of hydration (reflecting the contribution of the solid phase) of the hardening Portland cement paste in the case of the w/c=0.35 specimens. The increase of the compliance magnitude at early age seems to be related to the amount of C-S-H. The 18 hours old specimens of normal strength paste (w/c=0.50) and the 30 hours old specimens of high strength paste (w/c=0.35) both undergo a considerable increase in the degree of hydration while under load (Table1). In such specimens, the larger amounts of C-S-H (with respect to the loaded samples) signify the presence of a significant number of creep centers and consequently the development of a significant creep magnitude. This is a less important effect at higher water-cement ratio as porosity is a dominant factor.
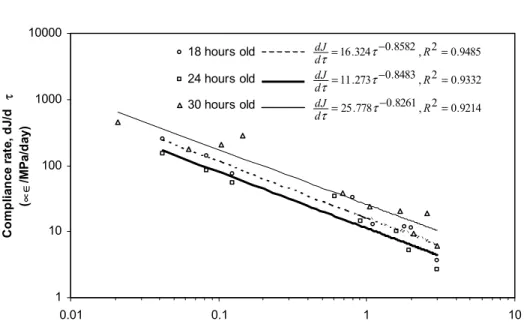
The compliance rate data of normal and high strengths specimens loaded at ages of 18, 24 and 30 hours plotted against the elapsed time under loading is presented in Figs. 7 and 8 respectively. The log-log scale curves obtained indicate a linear trend of the compliance rate similar to that previously presented for well hydrated normal strength hardened cement paste [9]. The parameter λ, which is the coefficient of the power function fitted to the curves in the figures decreases with the increase of the degree of hydration of the normal strength paste. The high strength paste at early age does not show the same relation as the more well hydrated (low strength) paste. This may be due to the greater shrinkage and the corresponding total creep for the 30 hours old specimens.
During the first few days following loading of hardening Portland cement paste, creep may be largely influenced by the capillary porosity. There may also be space for load-induced hydration products to form especially at higher water-cement ratios. This may explain the high magnitude of compliance observed in normal strength paste compared to that of the high strength specimens (see Figs. 5 and 6 and earlier discussion). Further, the fact that both the compliance magnitude and rate of the specimens are influenced by the degree of hydration while under load suggests that the rate-determining mechanism proposed by Wittmann [27], may be effective i.e. the volume growth of C-S-H in the capillaries is related to an increase in the number of creep centers. The diffusion of water, which may occur after loading, may then have a significant effect on very young hardening cement paste and a lesser effect on more mature cement paste.
Analysis of the compliance rate curves obtained for very young and more mature cement pastes suggests that several factors may contribute to the magnitude of short-term creep. These include the water content of the paste or relative humidity and the quantity of
C-S-H formed while under load. Another possibility is that the sliding of C-S-C-S-H sheets may occur at very early ages and significantly contribute to the magnitude of short-term creep. Load-induced hydration effect may result in more poorly-aligned C-S-H sheets formed in confined space. Misalignment may result in a greater number of creep sites. Previous work has confirmed that creep can also occur without the presence of water [9]. This is compatible with a physical process i.e. a sliding mechanism. It is therefore very important to determine the degree of hydration from loaded specimens, as hydration can be induced by the loading itself particularly in a very young normal strength cement paste.
The compliance rates of very young specimens (18, 24 and 30 hours old) and that of a mature 30 years old normal Portland cement paste are plotted in Fig. 9. It can be seen that the overall rate (at early ages of loading) may become coincident with the fitted curve. The first segment is not considered to be due to the diffusion of water within the hardening matrix [28] due to the coincidence of the data within 5 to 10 days. Water diffusion alone is not sufficient to explain the large and significant magnitude of creep observed on very young cement paste specimens [29]. Both the material age (t) and the elapsed time (τ=t-to) under loading seem to be of importance with respect to the
compliance rate of hardening cement paste.
The creep strain (
εc
) is generally defined as the difference between the total time dependent strain (ε
) and shrinkage strain (εsh
). It can be expressed as follows;ε
c=
ε
-
ε
sh(1)
material. The sum of the creep strain (εc) caused by the sustained stress σ and the elastic
strain (εco) can be written as follows;
ε
co+
ε
c= J(t,t
o).
σ
(2)By dividing the equation (2) by σ and re-arranging terms, the compliance can be expressed as follows.
J(t,t
o) = J
o(t
o,t
o)[1+
Φ
(t,t
o)]
(3)Jo is the compliance at the age of loading to, and represents the inverse of the modulus of
elasticity at to. Φ(t,to), defined as the creep coefficient, represents at any time, the
constant by which the elastic strain should be multiplied in order to obtain the corresponding creep strain.
In order to avoid taking into account both t and τ=t-t0 while formulating models for creep
strain of cement paste and/or concrete, it seems advantageous to consider the degree of hydration (αd) of loaded specimens as the main variable. Neville et al. [30,31] have
reported a relation between the strength and stress/strength ratio of concrete at the time of application of load and the creep strain following a given elapsed time under loading. Further Ross [32] noted that the properties of concrete are profoundly affected not only by age of the material but also by temperature during the curing period. It is apparent that time alone is not sufficient for comparison of creep properties.
Mills [33] stated that water penetrating into areas of restricted adsorption in the gel is capable of bearing load and contributing to the stiffness of the concrete. He therefore assumed that strongly adsorbed water is capable of resisting shear stress while that condensed in comparatively coarse capillaries is incapable of making this contribution. The state of water and relative humidity is thus of great importance for creep properties.
Feldman and Sereda [7] modeled the layer structure of the gel particles by two parallel surfaces (C-S-H sheets) and described the effect of moisture content on the modulus of elasticity of cement paste.
On the basis of the literature review and the results obtained on partially saturated and totally dried mature specimens as well as those obtained on wet mature and very young specimens it seems reasonable to conclude that at a given stress/strength level, the compliance will mainly depend on the degree of hydration (αd) evolving under load, the
degree of hydration at loading (αdo) and the relative humidity (rh) in the hardening
cement paste and/or concrete. The proposed mathematical formulations corresponding to these observations are similar to those proposed by De Shutter and Taerwe [16] the exception that the term αd includes both the extent of hydration due to the load itself and
that due to normal hydration in a stress free state.
J(
α
d,
α
do,rh) = J
o(
α
do,rh)[1+
Φ
(
α
d,
α
do,rh)]
(4)
[ ]
(4 ))
,
(
2
)
,
(
)
,
,
(
1 a dorh
k
f
rh
k
rh
d do do dα
α
α
α
=
α
Φ
) 4 ( b do do d df
α
=
α
α
−α
fαd is the fractional increase in degree of hydration while under load and k1 and k2 are
relative humidity (rh) provided that the experiments are all conducted at the same initial stress-strength ratio.
For the present study, the relative humidity was kept constant at (96 ± 2)%. The temperature was also maintained at 22 ± 2 °C as any significant change of these parameters was considered to affect the degree of hydration. Special precaution was therefore taken by continuously monitoring the humidity and temperature in order to avoid any abrupt change during the creep test.
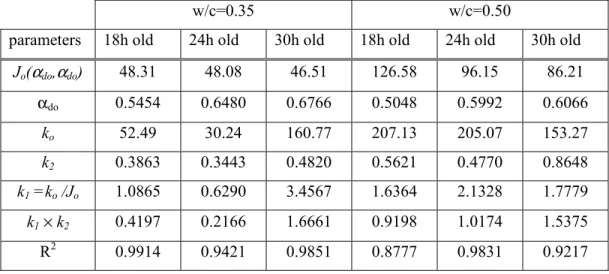
From the results presented in the first part of the paper, experimental creep coefficients were obtained both for normal and high strength paste and plotted against those obtained using the mathematical model previously described. The Fig. 10 shows a good correlation between model creep coefficient and experimental creep coefficient either for normal strength paste or for high strength paste. The parameters k1 and k2 are presented
in Table 3.
4. Conclusions
1- Load-induced hydration of cement paste can occur under certain conditions. The sustained loading of normal strength cement paste (w/c=0.50) loaded after 18 hours hydration seems to increase the degree of hydration (compared to unloaded specimens) during early age creep.
2- It is important to use degree of hydration values determined from specimens that have hydrated while under load in predictive formulation.
3- The compliance rate of hardening cement paste appears to depend on the state of hydration of the material and is a linear function (log-log plot) of time after loading.
4- The compliance or creep coefficient of hardening cement paste can be expressed as a function of the degree of hydration (αd) evolving under load at any time t, the
degree of hydration at loading (αdo) and the relative humidity in the hardening
cement paste.
References
1. X. YUMPING and H. M. JENNINGS, Materials Science of Concrete III, The
Amer. Ceram. Soc. 1992; 37.
2. J. F. YOUNG, in Proceedings of the First Australian Conference on Engineering Materials, Sidney, 1974; 3.
3. A. M. NEVILLE, in “Creep of Concrete: Plain, Reinforced and Prestressed” (North Holland Publishing Company, Amsterdam, 1970) p. 258.
4. W. G. MULLEN, W. L. DOLCH, in Proceedings of the American Society of
Testing Materials, 1964; (64) 1146.
5. F. H. WITTMANN, Reol. Acta., 1970; 9(2) 282.
6. T. C. POWERS and T. L. BROWNYARD, J. of Amer. Conc. Instit. 1967; (43) 933.
7. R. F. FELDMAN and P. J. SEREDA, Mat. and Struct. 1 (6) (1970) 509.
8. R. SIERRA, in Proceedings of the 7th International Congress on the Chemistry of Cement, Paris, France, 1980; (3) 201.
9. B. T. TAMTSIA and J. J. BEAUDOIN, Cem. and Conc. Res. , 2000; 30(9) 1465. 10. U. DANIELSSON, Mat. and Struct., 1874; 7(40) 231.
11. J. ZHOU and J. BEAUDOIN, “Effect of applied hydrostatic stress on the hydration of Portland cement paste and C3S” Advances in Cement Research, in press.
12. V. S. RAMACHANDRAN, “Estimation of tricalcium silicate through polymorphic transformation”, Journal of Thermal Analysis, 1971; (3) 181-190.
13. G. De SHUTTER, “Influence of ongoing hydration on basic creep of hardening concrete”, Creep , Shrinkage and Durability Mechanics of Concrete and other
Quasi-Brittle Materials, Edited by F.-J. Ulm, Z. P. Bazant and F. H. Wittmann,
Elsevier Science Ltd., 2000; 625-630.
14. A. W. GUTSCH, “Creep and relaxation of early-age concrete”, Creep , Shrinkage
and Durability Mechanics of Concrete and other Quasi-Brittle Materials, Edited by
F.-J. Ulm, Z. P. Bazant and F. H. Wittmann, Elsevier Science Ltd., 2000; 619-624. 15. S. M. KHALIL and M. A. WARD, “Effect of degree of hydration upon creep of
mortars containing calcium lignosulphonate”, Magazine of Concrete Research, 1970;70(22) 19-41.
16. G. De SHUTTER and L. TAERWE, “Fictitious degree of hydration method for basic creep of early age concrete”, Materials and Structures, 2000; (33) 370-380. 17. G. De SHUTTER, “Degree of hydration based Kelvin model for basic creep of
early age concrete”, Materials and Structures, 1999; (32) 260-265.
18. J. TIMUSK and R. S. GHOSH, “Maturing creep of Portland cement paste”, ACI
Journal, 1971; 959-963.
19. F.-J. ULM and O. COUSSY, “Strength growth as chemo-plastic hardening in early age concrete”, Journal of Engineering Mechanics, 1996; 12(122) 1123-1132.
20. F.-J. ULM, “Couplages thermomécaniques dans les bétons. Un premier bilan”,
21. R. F. FELDMAN and J. J. BEAUDOIN, “Effect of applied stress on microstructural deformation of hydrated Portland cement paste, characterization and performance prediction of cement and concrete”, Engineering Foundation Conference, Hennike, N. H., USA, 1983; 121-123.
22. R. F. FELDMAN, “Mechanism of creep of hydrated Portland cement paste”,
Cement and Concrete Research, 1972; (2) 521-540.
23. F. H. WITTMANN, “On the action of capillary pressure in fresh concrete”, Cement
and Concrete Research, 1976; (6) 49-56.
24. Z. P. BAZANT, “Solidification theory for concrete creep I. Formulation”, Journal
of Engineering Mechanics, 1989; 8(115) 1691-1703.
25. C. VERNET and G. CADORET, in "Presses de l'école nationale des Ponts et Chaussées" (Paris, 1991) p. 115.
26. F. De LARRARD and P. ACKER (1990), in "Rapports des Laboratoires", édités par le LCPC (Paris, 1990), Série Ouvrages d'Art OA-7.
27. F. H. WITTMANN, in "Creep and Shrinkage in Concrete Structures" (Edited by Z. P. Bazant and F. H. Wittmann, 1982) p. 129.
28. F. J. ULM, F. Le MAOU and C. BOULAY, Revue Française de Génie Civil, 1999; (3-4) 21.
29. Z. P. BAZANT, A. B. HAUGGAARD, S. BAWEJA and F. J. ULM, (1997),
Journal of Engineering Mechanics, 1997; 11(123) 1188.
30. A. M. NEVILLE, “Role of Cement in the creep of Mortar”, ACI Journal, 1959; (65) 963.
32. A. D ROSS, RILEM Bulletin, 1959; 55.
33. R. H. MILLS, in Proceedings of the Fifth International Symposium of Chemistry of Cement, Tokyo, 1969, edited by Cement Association of Japan, Vol. III, p. 74.
Table 1: Degree of hydration and Ca(OH)2 content of hardening cement paste (w/c=0.35)
loaded at 18, 24 and 30 hours at a stress/strength ratio of 0.3.
Unloaded sample Loaded sample Age
Degree of hydration Ca(OH)2 content Degree of hydration Ca(OH)2 content
18h 0.54 0.068 0.54 0.068 24h 0.64 0.073 0.57 0.072 30h 0.65 0.079 0.62 0.078 42h 0.74 0.080 0.66 0.080 24h 0.65 0.078 0.65 0.078 36h 0.71 0.080 0.67 0.083 48h 0.77 0.084 0.70 0.087 72h 0.84 0.091 0.78 0.089 30h 0.67 0.081 0.67 0.081 54h 0.79 0.086 0.77 0.088 78h 0.82 0.089 0.79 0.088 102h 0.88 0.088 0.81 0.090
Table 2: Degree of hydration and Ca(OH)2 content of hardening cement paste (w/c=0.50)
loaded at 18, 24 and 30 hours at a stress/strength ratio of 0.3.
Unloaded sample Loaded sample Age
Degree of hydration Ca(OH)2 content Degree of hydration Ca(OH)2 content
18h 0.50 0.064 0.50 0.064 24h 0.55 0.068 0.79 0.076 30h 0.63 0.075 0.86 0.077 42h 0.73 0.079 0.88 0.083 24h 0.60 0.075 0.60 0.075 36h 0.70 0.079 0.69 0.078 48h 0.72 0.086 0.71 0.084 72h 0.81 0.093 0.78 0.089 30h 0.61 0.080 0.61 0.080 54h 0.80 0.087 0.73 0.085 78h 0.78 0.090 0.79 0.088 102h 0.80 0.092 0.77 0.093
Table 3: Mechanical model parameters
w/c=0.35 w/c=0.50 parameters 18h old 24h old 30h old 18h old 24h old 30h old
Jo(αdo,αdo) 48.31 48.08 46.51 126.58 96.15 86.21 αdo 0.5454 0.6480 0.6766 0.5048 0.5992 0.6066 ko 52.49 30.24 160.77 207.13 205.07 153.27 k2 0.3863 0.3443 0.4820 0.5621 0.4770 0.8648 k1 =ko /Jo 1.0865 0.6290 3.4567 1.6364 2.1328 1.7779 k1× k2 0.4197 0.2166 1.6661 0.9198 1.0174 1.5375 R2 0.9914 0.9421 0.9851 0.8777 0.9831 0.9217
List of Figures
Figure 1: Total strain (creep+shrinkage) of hardened cement paste (w/c=0.35) while
conditioning at 96% RH and loaded at different ages of hydration
Figure 2: Total strain (creep+shrinkage) of hardened cement paste (w/c=0.50) while
conditioning at 96% RH and loaded at different ages of hydration
Figure 3: Shrinkage of hardened cement paste (w/c=0.35) while conditioning at 96% RH at
different ages of hydration
Figure 4: Shrinkage of hardened cement paste (w/c=0.50) while conditioning at 96% RH at
different ages of hydration
Figure 5: Compliance J of hardened cement paste (w/c=0.35) while conditioning at 96% RH
and loaded at different ages of hydration
Figure 6: Compliance J of hardened cement paste (w/c=0.50) while conditioning at 96% RH
and loaded at different ages of hydration
Figure 7: Compliance rate, dJ/dτ, of hardened cement paste (w/c=0.35) while conditioning at 96% RH and loaded at 18, 24 and 30 hours of hydration
Figure 8: Compliance rate, dJ/dτ, of hardened cement paste (w/c=0.50) while conditioning at 96% RH and loaded at 18, 24 and 30 hours of hydration
Figure 9: Compliance rate, dJ/dt, of hardened cement paste (w/c=0.50) while conditioning at
96% RH and loaded at 18, 24, 30 hours and 30 years of hydration
Figure 10: Comparison of model and experimental creep coefficients for high strength (a) and
Authors: Basile T. Tamtsiaa, James J. Beaudoina and Jacques Marchandb 0 600 1200 1800 2400 0 1 2 3 4 5 6 7
hydration period, in days
T o ta l s tr a in , µ∈ 18 hours old 24 hours old 30 hours old
Figure 1: Total strain (creep+shrinkage) of hardened cement paste (w/c=0.35) while conditioning at 96% RH and loaded at different ages of hydration
Authors: Basile T. Tamtsiaa, James J. Beaudoina and Jacques Marchandb 0 500 1000 1500 2000 0 1 2 3 4 5 6 7
hydration period, in days
T o ta l st ra in , µ∈ 18 hours old 24 hours old 30 hours old
Figure 2: Total strain (creep+shrinkage) of hardened cement paste (w/c=0.50) while conditioning at 96% RH and loaded at different ages of hydration
Authors: Basile T. Tamtsiaa, James J. Beaudoina and Jacques Marchandb 0 50 100 150 200 250 300 0 1 2 3 4 5 6 7
hydration period, in days
D ryi n g sh ri n kag e, µ∈ 18 hours old 24 hours old 30 hours old
Figure 3: Shrinkage of hardened cement paste (w/c=0.35) while conditioning at 96% RH at different ages of hydration
Authors: Basile T. Tamtsiaa, James J. Beaudoina and Jacques Marchandb -150 -100 -50 0 50 100 150 200 250 300 350 0 1 2 3 4 5 6 7
hydration period, in days
D ryi n g sh ri n kag e, µ∈ 18 hours old 24 hours old 30 hours old
Figure 4: Shrinkage of hardened cement paste (w/c=0.50) while conditioning at 96% RH at different ages of hydration
Authors: Basile T. Tamtsiaa, James J. Beaudoina and Jacques Marchandb 0 50 100 150 0 1 2 3 4 5 6 7
hydration period, in days
C o m p li an ce J, µ∈ /MP a 18 hours old 24 hours old 30 hours old
Figure 5: Compliance J of hardened cement paste (w/c=0.35) while conditioning at 96% RH and loaded at different ages of hydration
Authors: Basile T. Tamtsiaa, James J. Beaudoina and Jacques Marchandb 0 50 100 150 200 250 300 350 400 0 1 2 3 4 5 6 7
hydration period, in days
C o m p li an ce J, µ∈ /MP a 18 hours old 24 hours old 30 hours old
Figure 6: Compliance J of hardened cement paste (w/c=0.50) while conditioning at 96% RH and loaded at different ages of hydration
Authors: Basile T. Tamtsiaa, James J. Beaudoina and Jacques Marchandb 1 10 100 1000 10000 0.01 0.1 1 10
tim e after loading τ=t-to, in days
C o m p li an ce r a te , d J /d τ (µ∈ /M P a /d ay) 18 hours old 24 hours old 30 hours old 9485 . 0 2 , 8582 . 0 324 . 16 − = = R d dJ τ τ 9332 . 0 2 , 8483 . 0 273 . 11 − = = R d dJ τ τ 9214 . 0 2 , 8261 . 0 778 . 25 − = = R d dJ τ τ
Figure 7: Compliance rate, dJ/dτ, of hardened cement paste (w/c=0.35) while conditioning at
Authors: Basile T. Tamtsiaa, James J. Beaudoina and Jacques Marchandb 1 10 100 1000 10000 0.01 0.1 1 10
tim e after loading τ=t-to, in days
C o m p li an ce r a te , d J /d τ (µ∈ /M P a /d ay) 18 hours old 24 hours old 30 hours old 8806 . 0 2 , 6395 . 0 812 . 51 − = = R d dJ τ τ 8794 . 0 2 , 8335 . 0 456 . 26 − = = R d dJ τ τ 8137 . 0 2 , 6081 . 0 670 . 79 − = = R d dJ τ τ
Figure 8: Compliance rate, dJ/dτ, of hardened cement paste (w/c=0.50) while conditioning at
Authors: Basile T. Tamtsiaa, James J. Beaudoina and Jacques Marchandb 0.01 0.1 1 10 100 1000 10000 0.1 1 10 100 1000 10000 100000
hydration period, in days
C o m p li an ce r a te , d J /d t (µ∈ /MP a /d ay) 18 hours old 24 hours old 30 hours old 30 years old t dt dJ =115 fitting
Figure 9: Compliance rate, dJ/dt, of hardened cement paste (w/c=0.50) while conditioning at 96% RH and loaded at 18, 24, 30 hours and 30 years of hydration
Authors: Basile T. Tamtsiaa, James J. Beaudoina and Jacques Marchandb w /c=0.35 Y = 0.9948 X R2 = 0.9866 0.0 0.5 1.0 1.5 2.0 0 0.5 1 1.5
experimental creep coefficient Φ(αd,αdo,rh)
m o d e l cr ee p co e ffi ci e n t Φ (α d ,α do ,r h ) (a) 2 w /c=0.50 Y = 0.9399 X R2 = 0.9333 0 0.5 1 1.5 2 0 0.5 1 1.5
experimental creep coefficient Φ(αd,αdo,rh)
m o d e l cr ee p co e ffi ci e n t Φ (α d ,α do ,r h ) (b) 2
Figure 10: Comparison of model and experimental creep coefficients for high strength (a) and normal strength (b) cement pastes hydrating while conditioning at 96% RH
Table 1: Degree of hydration and Ca(OH)2 content of hardening cement paste (w/c=0.35)
loaded at 18, 24 and 30 hours at a stress/strength ratio of 0.3.
Unloaded sample Loaded sample Age
Degree of hydration Ca(OH)2 content Degree of hydration Ca(OH)2 content
18h 0.54 0.068 0.54 0.068 24h 0.64 0.073 0.57 0.072 30h 0.65 0.079 0.62 0.078 42h 0.74 0.080 0.66 0.080 24h 0.65 0.078 0.65 0.078 36h 0.71 0.080 0.67 0.083 48h 0.77 0.084 0.70 0.087 72h 0.84 0.091 0.78 0.089 30h 0.67 0.081 0.67 0.081 54h 0.79 0.086 0.77 0.088 78h 0.82 0.089 0.79 0.088 102h 0.88 0.088 0.81 0.090
Table 2: Degree of hydration and Ca(OH)2 content of hardening cement paste (w/c=0.50)
loaded at 18, 24 and 30 hours at a stress/strength ratio of 0.3.
Unloaded sample Loaded sample Age
Degree of hydration Ca(OH)2 content Degree of hydration Ca(OH)2 content
18h 0.50 0.064 0.50 0.064 24h 0.55 0.068 0.79 0.076 30h 0.63 0.075 0.86 0.077 42h 0.73 0.079 0.88 0.083 24h 0.60 0.075 0.60 0.075 36h 0.70 0.079 0.69 0.078 48h 0.72 0.086 0.71 0.084 72h 0.81 0.093 0.78 0.089 30h 0.61 0.080 0.61 0.080 54h 0.80 0.087 0.73 0.085 78h 0.78 0.090 0.79 0.088 102h 0.80 0.092 0.77 0.093
Table 3: Mechanical model parameters
w/c=0.35 w/c=0.50 parameters 18h old 24h old 30h old 18h old 24h old 30h old
Jo(αdo,αdo) 48.31 48.08 46.51 126.58 96.15 86.21 αdo 0.5454 0.6480 0.6766 0.5048 0.5992 0.6066 ko 52.49 30.24 160.77 207.13 205.07 153.27 k2 0.3863 0.3443 0.4820 0.5621 0.4770 0.8648 k1 =ko /Jo 1.0865 0.6290 3.4567 1.6364 2.1328 1.7779 k1× k2 0.4197 0.2166 1.6661 0.9198 1.0174 1.5375 R2 0.9914 0.9421 0.9851 0.8777 0.9831 0.9217