HAL Id: inserm-00431840
https://www.hal.inserm.fr/inserm-00431840
Submitted on 13 Nov 2009HAL is a multi-disciplinary open access archive for the deposit and dissemination of sci-entific research documents, whether they are pub-lished or not. The documents may come from teaching and research institutions in France or abroad, or from public or private research centers.
L’archive ouverte pluridisciplinaire HAL, est destinée au dépôt et à la diffusion de documents scientifiques de niveau recherche, publiés ou non, émanant des établissements d’enseignement et de recherche français ou étrangers, des laboratoires publics ou privés.
Self-rated health before and after retirement in France
(GAZEL): a cohort study.
Hugo Westerlund, Mika Kivimäki, Archana Singh-Manoux, Maria Melchior,
Jane E Ferrie, Jaana Pentti, Markus Jokela, Constanze Leineweber, Marcel
Goldberg, Marie Zins, et al.
To cite this version:
Hugo Westerlund, Mika Kivimäki, Archana Singh-Manoux, Maria Melchior, Jane E Ferrie, et al.. Self-rated health before and after retirement in France (GAZEL): a cohort study.. The Lancet, Elsevier, 2009, 374 (9705), pp.1889-96. �10.1016/S0140-6736(09)61570-1�. �inserm-00431840�
Self-rated health before and after retirement: findings from the French
GAZEL cohort study
Hugo Westerlund,1,2 Mika Kivimäki,2,3 Archana Singh-Manoux,2,4 Maria Melchior,4 Jane E. Ferrie,2 Jaana Pentti,3 Markus Jokela,2,5 Constanze Leineweber,1 Marcel Goldberg,4 Marie Zins,4 Jussi Vahtera.3,6
1Stress Research Institute, Stockholm University, Sweden. 2Department of Epidemiology and Public Health, UCL, UK.
3Finnish Institute of Occupational Health, Helsinki and Turku, Finland. 4INSERM, U687-IFR69, Hôpital Paul Brousse, France.
5Department of Psychology, University of Helsinki, Finland.
6Department of Public Health, University of Turku and Turku University Hospital, Finland.
Funding:
HW and CL are supported by the Swedish Council for Working Life and Social Research (FAS, grants #2004-2021, #2007-1143), JV and MK are supported by the Academy of Finland (grants #117604, #124271, #124322 and #129262),MK is additionally supported by the BUPA Foundation Specialist research grant, JEF is supported by the MRC (Grant number G8802774), ASM is
supported by a EUYRI award from the European Science Foundation.This work was additionally supported by a grant from the ESRC Research Seminar Series Competition 2007/8 (RES-451-26- 0491).
Correspondence to:
Dr. Hugo Westerlund, Stress Research Institute, Stockholm University, SE-106 91 Stockholm, Sweden. Tel: +46 (0)8 5537-8946, or -8926 Fax: +46 (0)8 5537-8900 Mobile: +46 (0)76 814-1011 e-mail: hugo.westerlund@stress.su.se Date: 11 August 2009 Words in abstract: 247
Words in main text: 3,607 incl. table references etc. Number of figures: 3
Number of tables: 2 Number of references: 36
SUMMARY
Background. Despite the need to increase the proportion of the population in work in most Western
countries, few studies have investigated longitudinally how perceived health is influenced by work
and retirement among older workers.
Methods. We examined trajectories of self-rated health in 14,714 employees (79% men) from the
national French gas and electricity company, the GAZEL cohort, for up to 7 years prior, and 7 years
post-retirement, using yearly measurements from 1989 to 2007. Data were analysed using
repeated-measures logistic regression with generalised estimating equations (GEE).
Findings. Overall, suboptimal health increased with age. However, between the year before
retirement and the year after, the estimated prevalence of suboptimal health fell from 19.2% [95%
confidence interval 18.5%-19.9%] to 14.3% [13.7%-14.9%], corresponding to an 8–10 year gain in
health. This retirement-related improvement was found in men and women, across occupational
grades, and was maintained throughout the seven-year post-retirement follow-up period. A poor
work environment and health complaints before retirement were associated with a steeper yearly
increase in the prevalence of suboptimal health while still in work, and a greater retirement-related
improvement. However, those with a combination of high occupational grade, low demands, and
high satisfaction at work showed no such retirement-related improvement.
Interpretation. These findings suggest that the burden of ill-health, in terms of perceived health
problems, is substantially relieved by retirement for all but those with ideal working conditions.
This indicates a need to redesign work for older workers in order to achieve higher labour market
Funding. The Swedish Council for Working Life and Social Research (Sweden), The Academy of
Finland (Finland), INSERM (France), The BUPA Foundation (UK), The Medical Research Council
(UK), The European Science Foundation (EU), and The Economic and Social Research Council
INTRODUCTION
Due to increasingly top-heavy population pyramids, governments in most Western countries are
seeking to increase the proportion of the population in work by pushing up retirement age.(1, 2)
However, reversing the downward trend in de-facto retirement age (2-4) in this way is likely to be
difficult,(5) particularly if older workers experience suboptimal health at work (4) while looking
forward to a relatively healthy ‘third age’ beyond retirement.
Surprisingly little is known about the impact of work and retirement on older workers’ perceptions
of health, a strong predictor of morbidity and mortality,(6-8) as well as of early retirement.(9)
Previous studies have produced conflicting findings, some suggesting that health improves after
retirement (10-13), others that it deteriorates,(14-16) and still others that it remains
unaffected.(17-20) To date, however, there is no published evidence on changes in health measured repeatedly over
an extended period of time covering both several years of employment preceding retirement, and
several years following retirement.
In this prospective study, we used yearly measurements of self-rated health in a large and varied
French occupational cohort to examine trajectories of health from seven years before retirement, to
seven years after. We sought to determine how people’s perceived health is affected when they
retire from work.
METHODS Study population
The GAZEL cohort was established in 1989 and comprises employees of the French national gas
and electricity company: Electricité de France-Gaz de France (EDF-GDF), from which the name of
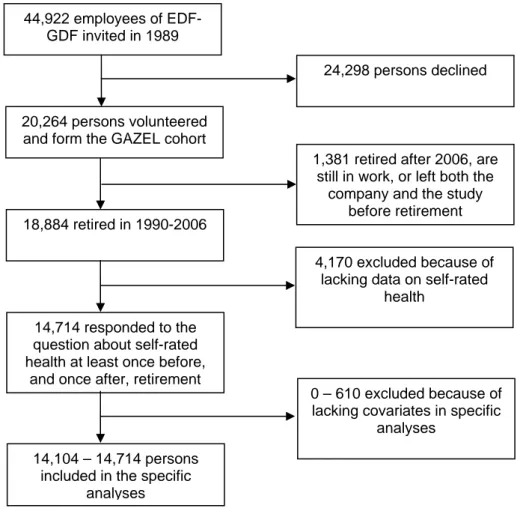
the study is derived.(21) At baseline, 20,624 employees (73% men), aged 35-50, gave consent to
participate (Fig. 1). EDF-GDF employees hold civil servant-like status that entails job security and
and stay with the company until retirement. Information on health, lifestyle, and individual,
familial, social, and occupational characteristics of the GAZEL participants is collected by annual
surveys.
<INSERT FIG. 1 ABOUT HERE>
In this study, we analysed data from GAZEL participants who retired between 1990 and 2006,
inclusive (Fig. 1). Of all 18,884 retirees, we included in the study those who had provided self-rated
health assessments at least once prior to and once after the year in which they retired. Thus, the
cohort consisted of 14,714 employees (11,581 men and 3,133 women), retired at the mean age
(standard deviation) of 54.6 (2.9) years.
Ascertainment of retirement
We obtained data on official retirement date, long-standing illness or disability, and sickness
absence from the company records. Because all retirement pensions are paid by EDF-GDF,
company data on retirement are comprehensive and accurate, and less than 1% of the participants
were lost to follow-up since 1989.(22) Statutory age of retirement is between 55 and 60 years
depending on the type of job; the longer an employee has worked in a blue collar setting, the earlier
she is allowed to retire. Although partial retirement is rare, retirement can occur before the age of
55. For instance, women with at least three children can retire after 15 years of service. Retirement
on health grounds can be granted in the event of long-standing illness or disability.
We defined the year and type of retirement according to the first of the following events: receipt of
an official retirement pension (statutory retirement), long-standing illness or disability, or over 650
days of sickness absence in two consecutive years. In the last case, the first year of permanent
disability, or through prolonged sickness absence was considered early retirement. Age of
retirement was divided into categories of 54 or earlier, 55, and 56 or later.
Self-rated health
Self-rated health was assessed using a standard measure included in the annual questionnaires sent
to all participants January 1989–2007: ‘How would you judge the state of your general health?’ The
participants responded on an 8-point Likert scale (1 = very good….8 = very poor), which was
dichotomised by categorising response scores 1–4 as good health and scores 5–8 as sub-optimal
health, as previously validated.(23) We used all annual measurements in a 15-year time window
ranging from the 7th year preceding retirement to the 7th after retirement.
Other variables
Of the demographic factors, we included sex, year of birth, and marital status (last reported before
retirement) in the analyses. We measured work-related factors as potential modifiers of the effect of
retirement on self-rated health. We hypothesised that larger changes in self-rated health would
follow retirement from an unfavourable occupational position and poor work environment,
compared with retiring from a satisfying work setting. The work-related factors assessed were
occupational grade, psychological and physical job demands, and job satisfaction. Occupational
category immediately prior to retirement was derived from EDF-GDF records and was classified
into three grades: higher (managers), intermediate (technical staff, line managers, and
administrative associate professionals), and lower (clerical and manual workers), based on
categorisations from the French National Institute of Statistics and Economic Studies
(www.insee.fr/en). We measured psychological and physical job demands by the questions ‘Do you
find that your job is psychologically tiring?’ and ‘Do you find that your job is physically
tiring?’,(24) and job satisfaction by ‘All in all, are you satisfied with your work?’(25) Participants
responded on 8-point scales and we calculated the means of these measurements in the three years
We assessed physical illnesses, musculoskeletal problems, mental health problems, and sickness
absence during the last three years of employment to determine whether the trajectories of self-rated
health were dependent on these conditions. We anticipated an improvement in self-related health
after retirement among those with pre-retirement illnesses due to the difficulty in coping with
modern work life with compromised health. A checklist was used to determine the following
physical illnesses – chronic bronchitis or asthma, angina, myocardial infarction, stroke, diabetes, or
cancer – and to assess depression.(26) An affirmative response regarding one or more of these
conditions in any of the three years preceding retirement defined presence of a chronic condition.
Presence of musculoskeletal problems was defined as an affirmative response to any
musculoskeletal illness or complaint (back pain, neck- and shoulder pain, arthritis, rheumatoid
arthritis, and sciatica) in all three years preceding retirement. High sickness absence, obtained from
company records, was defined as more than 21 sick-leave days in the three-year calendar period
preceding retirement (i.e. >7 days per year on average).
Statistical methods
The analysis was based on a 15-year observation window with the year of retirement as year 0 and a
7-year observation period both before (years −7 to −1) and after retirement (years +1 to +7). To
study the associations between potential explanatory variables and suboptimal health in the years −1
and +1, we used logistic regression analyses adjusting, where appropriate, for sex, age of
retirement, occupational grade, type of retirement, and time of data collection (1989-1999 vs.
2000-2007). To examine changes in the likelihood of suboptimal self-rated health, we applied a
repeated-measures logistic regression analysis using the generalised estimating equations (GEE) method with
autoregressive correlation structure.(27) GEE takes into account the intra-individual correlation
between measurements (see webappendix) and is not sensitive to missing measurements.
We calculated the annual odds of suboptimal self-rated health and their 95% confidence intervals
(CI) adjusting for time of data collection, and transformed the odds to prevalence estimates in order
to plot the trajectory of suboptimal health in relation to retirement. To study the slopes in three
distinct time intervals, we used a single GEE model to fit the equation
odds = e a + b1·x – b2 + b3 + c | −7 ≤ x ≤−1
odds = e a – b1 + b2·x + b3 + c | −1 < x ≤ 1
odds = e a – b1 + b2 + b3·x + c | 1 < x ≤ 7
where x is the year in relation to retirement, a=−1,780 [−1.829;−1.731] the intercept, b1=0.056
[0.048;0.065] the first slope, b2=−0.188 [–0.210;–0.164] the second slope, b3=0.039 [0.029;0.049]
the third slope, and c=0.210 [0.185;0.235] a correction factor for time of data collection. To assess
the fit of this model, we used the Quasi-Likelihood under the Independence model Criterion (QIC)
and the related QICu statistic – lower values indicating better fit – (28) to compare this model, with
its 2 inflection points, to two a priori models, one with 0 inflection points (a linear, age-related
trajectory), and one with 1 inflection point at retirement (change in slope). The suggested model
with 2 inflection points has clearly lower values of both QIC (156409.7844) and QICu
(156400.4175) compared with the a priori models with 0 and 1 inflection points (QIC 156707.2266
and 156703.4106 respectively; and QICu 156697.5844 and 156693.8583 respectively), indicating
that the model with 2 inflection points best fits the data.
We explored the effects of potential explanatory or modifying variables on the shape of the
trajectory of self-rated health in relation to retirement by first testing whether the shape of the
trajectory was dependent on the variable of interest by entering the interaction term ‘year *
odds ratios of suboptimal health year −1 compared with −7, year +1 compared with −1, and +7
compared with +1, for different levels of the explanatory variable using contrasts in the regression
models.
In order to provide an illustration of the extent to which work-related factors account for the health
trajectory in relation to retirement, we calculated annual prevalence estimates for suboptimal health
over the 15-year time window for two scenarios involving men who retired at the statutory age of
55 and before the year 2000: one with a low-risk profile of work-related factors (i.e. higher
occupational grade, physical and psychological demands in the lowest tertile, and job satisfaction in
the highest tertile) and the other with a high-risk profile (low grade, high demands, low
satisfaction). We derived these estimates from a single repeated measures logistic regression
analysis that included the interaction term ‘year * explanatory variable’ for each risk factor in the
model.
The analyses were conducted using SAS 9.2 for Windows, SAS Institute Inc., Cary, NC, USA.
Role of the funding source
The study sponsors did not contribute to the study design and had no role in data collection, data
analysis, data interpretation, or writing of the report. The corresponding author had full access to all
the data in the study and had final responsibility for the decision to submit for publication.
RESULTS
Most of the 14,714 respondents were men (79%), married (89%), and, during the observation
period, belonged to higher (33%) or intermediate (55%) employment grades due to upward social
mobility within the company. Of the respondents, 10,564 (72%) retired before 56 years of age, and
29% from musculoskeletal complaints, 15% from physical illness, and 32% had >21 days of
sickness absence.
< INSERT TABLE 1 ABOUT HERE>
Table 1 shows that the odds of suboptimal health both immediately before and immediately after
retirement were higher among married respondents, those who took early retirement, reported high
psychological and physical demands, low job satisfaction, depression, musculoskeletal complaints,
severe medical conditions, and had had high sickness absence. Women had a higher risk of
suboptimal health than men before, but not after, retirement.
<INSERT FIG. 2 ABOUT HERE>
Fig. 2 shows the estimated annual prevalence of suboptimal health in relation to retirement, based
on a total of 174,765 person-measurement observations (79.2% of the theoretical maximum of
220,710 person-measurements that would have been generated if every participant had responded to
all 15 annual surveys in the observation window). The prevalence increased with increasing age
both before and after retirement, broken by a sharp decrease around retirement, a pattern also
evident in a sensitivity analysis using self-rated health as a continuous variable (see Webappendix
Table W1). Thus, we modelled the 15-year trajectory of suboptimal health in three time intervals,
from year −7 to –1, from −1 to +1, and from +1 to +7. This function fits the data well and indicates
that the increase in prevalence of suboptimal health was steeper before retirement (on average 0.8
percentage points per year) than after (0.5 percentage points per year). Retirement marked a sharp
drop in the prevalence of suboptimal health from 19.2 % [18.5–19.9] the year before to 14.3 %
[13.7–14.9] the year after, a decrease of 4.9 percentage points. This means that the prevalence of
suboptimal health returned to levels observed approximately 8 years earlier, and, given the change
The retirement-related improvement in suboptimal health appears to occur over a two-year period
(Fig. 2). This is because the survey is conducted each January, while retirement is spread over the
year.In addition, some employees stop working several months before their official retirement date
due to accumulated periods of vacation not taken during their employment.
To rule out selective sample retention as an explanation for these findings, we fitted a similar
function for those 8,295 participants who responded to the survey 7 years after retirement
(Webappendix, Fig. W1). The trajectory remained unaltered. To further test the robustness of the
findings, we used multiple imputation based on all available data to create five datasets with values
for all missing data on self-rated health for the seven years pre- and post-retirement imputed. We
then fitted a function for each of these datasets (Webappendix Fig. W2), which yielded five
trajectories very similar to the fitted function shown in Fig. 2.
<INSERT TABLE 2 ABOUT HERE>
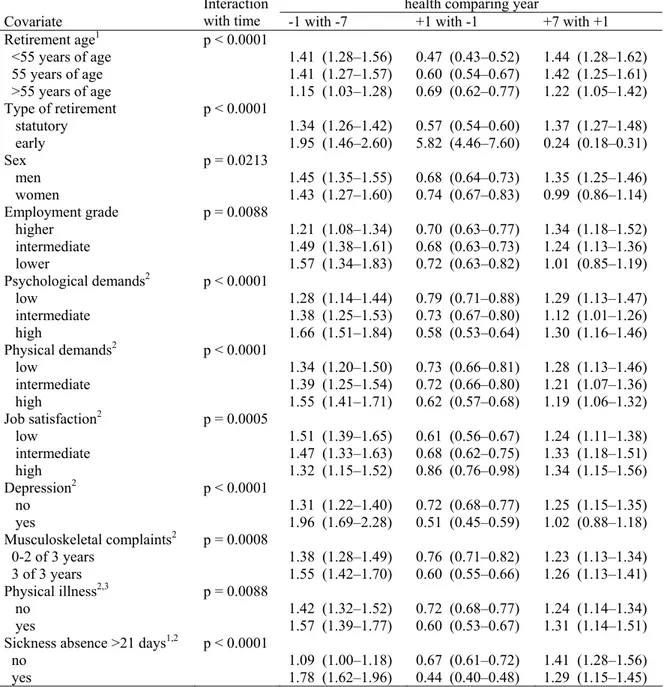
Table 2 shows how potential explanatory and modifying variables affected the shape of the
trajectory of suboptimal health before, around, and after retirement. There was no difference in
trajectories between men and women before or around retirement. After retirement, men who
initially had better health had a relatively pronounced increase in prevalence of suboptimal health
(OR=1.35 [1.25–1.46]) whereas no increase was observed for women (OR=0.99 [0.86–1.14]).
Marital status was not related to the shape of the health trajectory (p=0.17) and was therefore
dropped from the analyses presented in Table 2. Those who retired after the age of 55 had had a less
steep increase in prevalence of suboptimal health before retirement than those who retired at 55 or
earlier. They also benefited less from retirement, and had a smaller increase in suboptimal heath
grounds had a significantly worse trajectory before retirement, and contrary to all other groups their
likelihood of suboptimal health increased sharply around retirement (OR=5.82 [4.46–7.60]); after
retirement, however, they experienced a strong decrease in prevalence of suboptimal health
(OR=0.24 [0.18–0.31]).
As shown in table 2, there was no relative difference in the retirement-related improvement in
health between employment grades, but employees in lower and intermediate grades had a
significantly less favourable trajectory before retirement than those in higher grades. After
retirement the latter pattern was reversed and no additional deterioration was seen among those in
lower grades (OR=1.01 [0.85–1.19]).
High demands, both psychological and physical, were related to larger increase in prevalence of
suboptimal health before retirement and greater benefit around retirement (Table 2). High job
satisfaction was associated with a significantly slower increase in the prevalence of suboptimal
health before retirement and less benefit from retirement, whereas those with low job satisfaction
benefited the most from retirement.
Respondents who suffered from depression in any of the three years preceding retirement had a
significantly worse health trajectory before retirement, benefited more from retirement, and had a
less steep increase in the likelihood of suboptimal health thereafter than those who had not been
depressed. Musculoskeletal symptoms in the three years preceding retirement, presence of one or
more physical illnesses before retirement, as well as sickness absence >21 days during the three
years preceding retirement were all related to worse trajectories in health before retirement and
larger retirement-related improvements (Table 2).
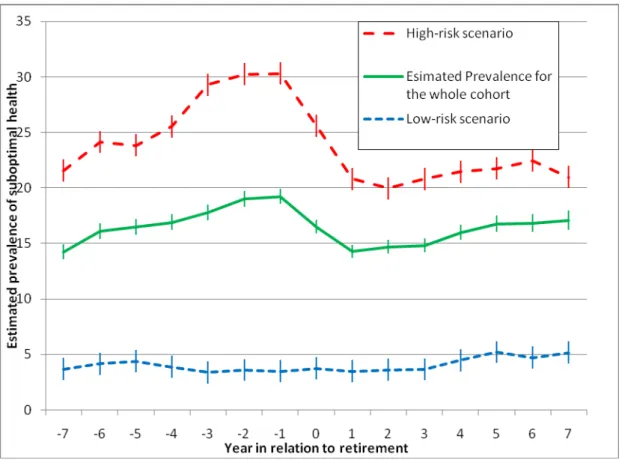
Fig. 3 shows the estimated trajectories for self-rated health for two scenarios, one a low-risk profile
of work-related factors, and one with a high-risk profile. In the low-risk scenario, there is no
retirement-related improvement in health.
DISCUSSION
In a large French occupational cohort, retirement was associated with a substantial decrease in
prevalence of suboptimal health, corresponding to an 8–10 year gain in perceived health. This
pattern was remarkably consistent across occupational grades and sex, and, although the effect was
stronger for those who had had a poor work environment or health problems before retirement, a
significant improvement was observed also among other groups, with the exception of those with
ideal working conditions. In addition, the prevalence of suboptimal health increased at a
significantly faster rate before rather than after retirement. These findings suggest that the burden of
ill-heath in terms of perceived health problems among older workers with poor working conditions
is considerably relieved by retirement.
A major strength of this study is that it is based on repeated yearly measurements over an extended
time period in a stable occupational cohort. Although observational data cannot prove causality and
rule out residual confounding, the findings – that a steady increase in prevalence of suboptimal
health is sharply broken and decreases substantially on retirement, followed by a less steep increase
after retirement – strongly suggests that the improvement is indeed related to retirement. Since most
people in this cohort retired on a statutory basis at 55 or very close to that age, reversed causality is
unlikely, indicating that retirement may actually cause an improvement in perceived health. Our
outcome, self-rated suboptimal health has repeatedly been shown to be associated with
mortality,(6-8) including in this cohort,(29) and is also a valid measure of well-being and morbidity.(26)
employees in lower occupational grades, which means that the absolute benefit was larger in the
lower grades. This may reflect the greater work-related health burden prior to retirement previously
observed among workers in the lower grades.(30-32).
Not surprisingly, high physical and psychological job demands as well as low job satisfaction
during the later years in work were associated with a steeper increase in suboptimal health before
retirement and greater benefit from retirement. However, those with a low-risk profile of
work-related factors showed no such retirement-work-related improvement. This probably indicates that work
puts an extra burden on health when it is highly demanding and not satisfying, but that the effects of
this burden are reversible. Our results also show that marital status did not much influence the
observed association between retirement and sub-optimal health, potentially indicating that the
retirement related improvement was more related to work than to private life.
The data come from employees in a company operating throughout France, both in rural and urban
areas, comprising a wide range of occupations. However, in comparison to many employees in the
Western world (and certainly outside it) the participants retired early and benefited from good social
security. Indeed, adverse effects generated by reduced income are likely to be relatively small in
this cohort. We observed a smaller benefit from retirement among employees who retired after the
age of 55 than among those who retired at 55 or earlier. Working longer could be a marker of better
working conditions, as employees who have worked in blue-collar settings, with more exposure to
occupational hazards and health problems,(33) were allowed to retire earlier.
The substantial improvement in all groups and regardless of confounders (barring the 4% who
retired on health grounds) suggests that the observed pattern may be fairly generalisable to other
settings with relatively generous social security after retirement, indeed to a large proportion of
Our findings are in agreement with observations in other European countries. Improvement in
perceived health after retirement was observed in Sweden;(34) and in the Whitehall II study mental
health functioning deteriorated among those who continued working but improved among retirees
from the higher employment grades.(10) Further research is needed to ascertain the generalisability
of our results outside the GAZEL cohort, as well as to investigate underlying mechanisms, i.e.,
whether improvements in health after retirement are explained by the removal of exposure to
adverse work characteristics, by positive changes in lifestyle, by a change in health ratings as a
result of adjusted expectations(35, 36), or by lower demands on health in retirement.
Policy implications
Our findings should cause concern among policy-makers attempting to convince workers to stay
longer in the workforce. Older workers who experience deteriorating perceived health, and who
may additionally be aware that many of their slightly older friends and former colleagues enjoy
excellent health since they retired, may feel more motivated to retire early than to continue working
beyond statutory retirement age. If our findings apply in settings where social security is less
comprehensive than for the GAZEL participants, financial incentive might not be enough – and
indeed not the most ethical way – to counteract the drift towards an ever earlier retirement age.
Arguably the best option is to redesign working life for older workers in order to make it healthier
and more satisfying, and thus, hopefully, achieve better occupational health, improved quality of
life, increased productivity, and a larger proportion of the population in work.
Contributors
HW and JV designed the original hypothesis and ran all the analyses in close dialogue with MK. JP
provided statistical advice. HW wrote the first draft of the report, apart from the methods section
which was written by JV and HW. All authors interpreted the results, revised the text, and approved
Conflict of interest statement
We declare that we have no conflict of interest.
Acknowledgments
The authors wish to express their thanks to EDF-GDF, especially to the Service Général de
Médecine de Contrôle, and to the ‘Caisse centrale d’action sociale du personnel des industries
électrique et gazière’. We also wish to acknowledge the Risques Postprofessionnels – Cohortes de
l’Unité mixte 687 Inserm – CNAMTS team responsible for the GAZEL data base management. The
GAZEL Cohort Study was funded by EDF-GDF and INSERM, and received grants from the
44,922 employees of EDF-GDF invited in 1989
20,264 persons volunteered and form the GAZEL cohort
18,884 retired in 1990-2006
14,714 responded to the question about self-rated health at least once before,
and once after, retirement
14,104 – 14,714 persons included in the specific
analyses
24,298 persons declined
1,381 retired after 2006, are still in work, or left both the
company and the study before retirement
4,170 excluded because of lacking data on self-rated
health
0 – 610 excluded because of lacking covariates in specific
analyses
Table 1 — Characteristics of the participants and their association with suboptimal self-rated health before and after retirement.
Odds ratios and 95% CIs for suboptimal self-rated health before and after retirement
Covariate Number (%) Before (year -1) After (year +1)
Retirement age1,2,4,5 <55 years of age 5878 (40) 1.22 (1.10–1.36) 0.96 (0.84–1.10) 55 years of age 4686 (32) 1 1 >55 years of age 4150 (28) 1.00 (0.88–1.13) 1.16 (1.00–1.34) Type of retirement1,2,3 statutory 14104 (96) 1 1 early 610 (4) 2.78 (2.28–3.38) 38.1 (29.4–49.3) Sex2,3,4 men 11581 (79) 1 1 women 3133 (21) 1.19 (1.07–1.32) 1.10 (0.97–1.26) Marital status1,2,3,4 not married/cohabitating 1643 (11) 1 1 married or cohabitating 13066 (89) 1.33 (1.16–1.52) 1.43 (1.22–1.68) Employment grade1,3,4 higher 4864 (33) 1 1 intermediate 8020 (55) 1.35 (1.22–1.50) 1.28 (1.131.46) lower 1815 (12) 1.97 (1.70–2.28) 1.84 (1.54–2.20) Psychological demands1,2,3,4,6 low 4848 (35) 1 1 intermediate 5092 (37) 1.86 (1.66–2.09) 1.82 (1.58–2.10) high 3895 (28) 2.99 (2.66–2.26) 2.33 (2.02–2.70) Physical demands1,2,3,4,6 low 5115 (37) 1 1 intermediate 4740 (34) 1.39 (1.24–1.56) 1.43 (1.24–1.64) high 3970 (29) 2.32 (2.07–2.59) 2.10 (1.82–2.41) Job satisfaction1,2,3,4,6 low 4872 (37) 1 1 intermediate 4785 (36) 0.67 (0.60–0.74) 0.74 (0.65–0.85) high 3558 (27) 0.39 (0.35–0.45) 0.55 (0.47–0.64) Depression1,2,3,4,6 no 12385 (89) 1 1 yes 1529 (11) 4.00 (3.54–4.52) 2.56 (2.20–2.98) Musculoskeletal complaints1,2,3,4,6 0-2 of 3 years 9830 (71) 1 1 3 of 3 years 4084 (29) 1.90 (1.74–2.09) 1.61 (1.43–1.80) Physical illness1,2,3,4,6,7 no 11789 (85) 1 1 yes 2125 (15) 2.52 (2.27–2.81) 2.05 (1.80–2.35)
Sickness absence >21 days1,2,3,4,5,6
no 9995 (68) 1 1
yes 4719 (32) 2.95 (2.68–3.25) 2.01 (1.79–2.26)
1Adjusted for sex; 2Adjusted for SES; 3Adjusted for age of retirement; 4Adjusted for type of retirement; 5Among those who retired through statutory pension;
6During the three years before the retirement year (-3, -2, and -1);
Table 2 — Changes in self-rated health around retirement (year 0 = year of retirement). Odds ratios (OR) for suboptimal self-rated health and their 95% confidence intervals (95% CI) comparing different time points are derived from repeated measures logistic regression GEE models also including year and time of data collection as covariates.
Odds ratios (OR) with 95% CI for suboptimal self-rated health comparing year
Covariate
Interaction
with time -1 with -7 +1 with -1 +7 with +1
Retirement age1 p < 0.0001 <55 years of age 1.41 (1.28–1.56) 0.47 (0.43–0.52) 1.44 (1.28–1.62) 55 years of age 1.41 (1.27–1.57) 0.60 (0.54–0.67) 1.42 (1.25–1.61) >55 years of age 1.15 (1.03–1.28) 0.69 (0.62–0.77) 1.22 (1.05–1.42) Type of retirement p < 0.0001 statutory 1.34 (1.26–1.42) 0.57 (0.54–0.60) 1.37 (1.27–1.48) early 1.95 (1.46–2.60) 5.82 (4.46–7.60) 0.24 (0.18–0.31) Sex p = 0.0213 men 1.45 (1.35–1.55) 0.68 (0.64–0.73) 1.35 (1.25–1.46) women 1.43 (1.27–1.60) 0.74 (0.67–0.83) 0.99 (0.86–1.14) Employment grade p = 0.0088 higher 1.21 (1.08–1.34) 0.70 (0.63–0.77) 1.34 (1.18–1.52) intermediate 1.49 (1.38–1.61) 0.68 (0.63–0.73) 1.24 (1.13–1.36) lower 1.57 (1.34–1.83) 0.72 (0.63–0.82) 1.01 (0.85–1.19) Psychological demands2 p < 0.0001 low 1.28 (1.14–1.44) 0.79 (0.71–0.88) 1.29 (1.13–1.47) intermediate 1.38 (1.25–1.53) 0.73 (0.67–0.80) 1.12 (1.01–1.26) high 1.66 (1.51–1.84) 0.58 (0.53–0.64) 1.30 (1.16–1.46) Physical demands2 p < 0.0001 low 1.34 (1.20–1.50) 0.73 (0.66–0.81) 1.28 (1.13–1.46) intermediate 1.39 (1.25–1.54) 0.72 (0.66–0.80) 1.21 (1.07–1.36) high 1.55 (1.41–1.71) 0.62 (0.57–0.68) 1.19 (1.06–1.32) Job satisfaction2 p = 0.0005 low 1.51 (1.39–1.65) 0.61 (0.56–0.67) 1.24 (1.11–1.38) intermediate 1.47 (1.33–1.63) 0.68 (0.62–0.75) 1.33 (1.18–1.51) high 1.32 (1.15–1.52) 0.86 (0.76–0.98) 1.34 (1.15–1.56) Depression2 p < 0.0001 no 1.31 (1.22–1.40) 0.72 (0.68–0.77) 1.25 (1.15–1.35) yes 1.96 (1.69–2.28) 0.51 (0.45–0.59) 1.02 (0.88–1.18) Musculoskeletal complaints2 p = 0.0008 0-2 of 3 years 1.38 (1.28–1.49) 0.76 (0.71–0.82) 1.23 (1.13–1.34) 3 of 3 years 1.55 (1.42–1.70) 0.60 (0.55–0.66) 1.26 (1.13–1.41) Physical illness2,3 p = 0.0088 no 1.42 (1.32–1.52) 0.72 (0.68–0.77) 1.24 (1.14–1.34) yes 1.57 (1.39–1.77) 0.60 (0.53–0.67) 1.31 (1.14–1.51)
Sickness absence >21 days1,2 p < 0.0001
no 1.09 (1.00–1.18) 0.67 (0.61–0.72) 1.41 (1.28–1.56)
yes 1.78 (1.62–1.96) 0.44 (0.40–0.48) 1.29 (1.15–1.45)
1Among those who retired through statutory pension.
2During the three years before the retirement year (-3, -2, and -1).
3Respiratory illnesses, cardiovascular disease, cerebrovascular disease, diabetes, or cancer.
Fig. 3 — Trajectories of prevalence of suboptimal self-rated health in relation to year of retirement for two scenarios involving men who retired at the statutory age of 55 and before the year 2000: one with a low-risk profile of work-related factors (higher occupational grade, low physical and psychological demands, and high job satisfaction), and the other with a high-risk profile (low grade, high demands, low satisfaction).
REFERENCES
1. Visco I. Ageing and pension system reform: implications for financial markets and economic policies.; 2005.
2. Blondal S, Scarpetta S. The retirement decision in OECD countries; 1999.
3. Gruber J, Wise D. Social security and retirement: an international comparison. The American Economic Review. 1998 May, 1998;88(2):158-63.
4. Barnay T. In which ways do unhealthy people older than 50 exit the labour market in France? Eur J Health Econ. 2009.
5. Fatas E, Lacomba J, Lagos F. An experimental test on retirement decisions. Economic Inquiry. 2007;45(3):602-14.
6. DeSalvo KB, Bloser N, Reynolds K, He J, Muntner P. Mortality prediction with a single general self-rated health question. A meta-analysis. J Gen Intern Med. 2006 Mar;21(3):267-75.
7. Idler EL, Benyamini Y. Self-rated health and mortality: a review of twenty-seven community studies. J Health Soc Behav. 1997 Mar;38(1):21-37.
8. Benyamini Y, Idler EL. Community studies reporting association between self-rated health and mortality: Additional studies, 1995 to 1999. Research on Aging. 1999;21(3):392-401.
9. Laine S, Gimeno D, Virtanen M, Oksanen T, Vahtera J, Elovainio M, et al. Job strain as a predictor of disability pension: the Finnish Public Sector Study. J Epidemiol Community Health. 2009 Jan;63(1):24-30.
10. Mein G, Martikainen P, Hemingway H, Stansfeld S, Marmot M. Is retirement good or bad for mental and physical health functioning? Whitehall II longitudinal study of civil servants. J Epidemiol Community Health. 2003 Jan;57(1):46-9.
11. Mojon-Azzi S, Sousa-Poza A, Widmer R. The effect of retirement on health: a panel analysis using data from the Swiss Household Panel. Swiss Med Wkly. 2007 Oct 20;137(41-42):581-5.
12. Drentea P. Retirement and mental health. Journal of aging and health. 2002 May;14(2):167-94.
13. Gall TL, Evans DR, Howard J. The retirement adjustment process: changes in the well-being of male retirees across time. The journals of gerontology. 1997 May;52(3):P110-7.
14. Buxton JW, Singleton N, Melzer D. The mental health of early retirees-- national interview survey in Britain. Soc Psychiatry Psychiatr Epidemiol. 2005 Feb;40(2):99-105.
15. Bosse R, Aldwin CM, Levenson MR, Ekerdt DJ. Mental health differences among retirees and workers: findings from the Normative Aging Study. Psychol Aging. 1987 Dec;2(4):383-9.
16. Alavinia SM, Burdorf A. Unemployment and retirement and ill-health: a cross-sectional analysis across European countries. Int Arch Occup Environ Health. 2008 Oct;82(1):39-45.
17. Butterworth P, Gill SC, Rodgers B, Anstey KJ, Villamil E, Melzer D. Retirement and mental health: analysis of the Australian national survey of mental health and well-being. Soc Sci Med. 2006 Mar;62(5):1179-91.
18. Villamil E, Huppert FA, Melzer D. Low prevalence of depression and anxiety is linked to statutory retirement ages rather than personal work exit: a national survey. Psychol Med. 2006 Jul;36(7):999-1009.
19. van Solinge H. Health change in retirement: A longitudinal study among older workers in the Netherlands. Research on Aging. 2007;29(3):225-56.
20. Ekerdt DJ, Baden L, Bosse R, Dibbs E. The effect of retirement on physical health. Am J Public Health. 1983 Jul;73(7):779-83.
21. Goldberg M, Leclerc A, Bonenfant S, Chastang JF, Schmaus A, Kaniewski N, et al. Cohort profile: the GAZEL Cohort Study. Int J Epidemiol. 2007 Feb;36(1):32-9.
22. Melchior M, Krieger N, Kawachi I, Berkman LF, Niedhammer I, Goldberg M. Work Factors and Occupational Class Disparities in Sickness Absence: Findings From the GAZEL Cohort Study. Am J Public Health. 2005 July 1, 2005;95(7):1206-12.
23. Niedhammer I, Chea M. Psychosocial factors at work and self reported health: comparative results of cross sectional and prospective analyses of the French GAZEL cohort. Occup Environ Med. 2003 Jul;60(7):509-15.
24. Chiron M, Bernard M, Lafont S, Lagarde E. Tiring job and work related injury road crashes in the GAZEL cohort. Accid Anal Prev. 2008 May;40(3):1096-104.
25. Niedhammer I. Psychometric properties of the French version of the Karasek Job Content Questionnaire: a study of the scales of decision latitude, psychological demands, social support, and physical demands in the GAZEL cohort. Int Arch Occup Environ Health. 2002 Mar;75(3):129-44.
26. Goldberg P, Gueguen A, Schmaus A, Nakache JP, Goldberg M. Longitudinal study of associations between perceived health status and self reported diseases in the French Gazel cohort. J Epidemiol Community Health. 2001 Apr;55(4):233-8.
27. Lipsitz SR, Kim K, Zhao L. Analysis of repeated categorical data using generalized estimating equations. Stat Med. 1994 Jun 15;13(11):1149-63.
28. Hardin JW, Hilbe J. Generalized estimating equations. Boca Raton, Fla.: Chapman & Hall/CRC; 2003.
29. Singh-Manoux A, Dugravot A, Shipley MJ, Ferrie JE, Martikainen P, Goldberg M, et al. The association between self-rated health and mortality in different socioeconomic groups in the GAZEL cohort study. Int J Epidemiol. 2007 Dec;36(6):1222-8.
30. Marmot MG, Bosma H, Hemingway H, Brunner E, Stansfeld S. Contribution of job control and other risk factors to social variations in coronary heart disease incidence. Lancet. 1997 Jul
26;350(9073):235-9.
31. Belkic KL, Landsbergis PA, Schnall PL, Baker D. Is job strain a major source of cardiovascular disease risk? Scand J Work Environ Health. 2004 Apr;30(2):85-128.
32. LaMontagne AD, Keegel T, Vallance D, Ostry A, Wolfe R. Job strain - attributable
depression in a sample of working Australians: assessing the contribution to health inequalities. BMC Public Health. 2008;8:181.
33. Melchior M, Krieger N, Kawachi I, Berkman LF, Niedhammer I, Goldberg M. Work factors and occupational class disparities in sickness absence: findings from the GAZEL cohort study. Am J Public Health. 2005 Jul;95(7):1206-12.
34. Vogel J, Theorell T. Social welfare models, labor markets, and health outcomes. In: Heymann J, Hertzman C, Barer ML, R.B. E, editors. Healthier Societies From analysis to action. Oxford: Oxford University Press; 2006. p. 267-95.
35. Groot W. Adaptation and scale of reference bias in self-assessments of quality of life. J Health Econ. 2000 May;19(3):403-20.
36. Krause NM, Jay GM. What do global self-rated health items measure? Med Care. 1994 Sep;32(9):930-42.