Publisher’s version / Version de l'éditeur:
Vous avez des questions? Nous pouvons vous aider. Pour communiquer directement avec un auteur, consultez la première page de la revue dans laquelle son article a été publié afin de trouver ses coordonnées. Si vous n’arrivez pas à les repérer, communiquez avec nous à PublicationsArchive-ArchivesPublications@nrc-cnrc.gc.ca.
Questions? Contact the NRC Publications Archive team at
PublicationsArchive-ArchivesPublications@nrc-cnrc.gc.ca. If you wish to email the authors directly, please see the first page of the publication for their contact information.
https://publications-cnrc.canada.ca/fra/droits
L’accès à ce site Web et l’utilisation de son contenu sont assujettis aux conditions présentées dans le site LISEZ CES CONDITIONS ATTENTIVEMENT AVANT D’UTILISER CE SITE WEB.
Frontiers in Microbiology, 9, 2019-01-17
READ THESE TERMS AND CONDITIONS CAREFULLY BEFORE USING THIS WEBSITE. https://nrc-publications.canada.ca/eng/copyright
NRC Publications Archive Record / Notice des Archives des publications du CNRC :
https://nrc-publications.canada.ca/eng/view/object/?id=86fa4f0b-5f3d-43e0-87c7-1dae1aab8fcf
https://publications-cnrc.canada.ca/fra/voir/objet/?id=86fa4f0b-5f3d-43e0-87c7-1dae1aab8fcf
Archives des publications du CNRC
This publication could be one of several versions: author’s original, accepted manuscript or the publisher’s version. / La version de cette publication peut être l’une des suivantes : la version prépublication de l’auteur, la version acceptée du manuscrit ou la version de l’éditeur.
For the publisher’s version, please access the DOI link below./ Pour consulter la version de l’éditeur, utilisez le lien DOI ci-dessous.
https://doi.org/10.3389/fmicb.2018.03351
Access and use of this website and the material on it are subject to the Terms and Conditions set forth at
Discovery of a new natural product and a deactivation of a quorum
sensing system by culturing a “producer” bacterium with a heat-killed
“inducer” culture
Liang, Libang; Sproule, Amanda; Haltli, Brad; Marchbank, Douglas H.;
Berrué, Fabrice; Overy, David P.; Mcquillan, Kate; Lanteigne, Martin;
Duncan, Noelle; Correa, Hebelin; Kerr, Russell G.
doi: 10.3389/fmicb.2018.03351
Edited by:
Marie-Joelle Virolle, Center for the National Scientific Research (CNRS), France
Reviewed by:
Shumpei Asamizu, The University of Tokyo, Japan Marcy J. Balunas, University of Connecticut, United States *Correspondence: Russell G. Kerr rkerr@upei.ca Specialty section:
This article was submitted to Microbial Physiology and Metabolism, a section of the journal Frontiers in Microbiology
Received: 28 September 2018 Accepted: 31 December 2018 Published: 17 January 2019 Citation:
Liang L, Sproule A, Haltli B, Marchbank DH, Berrué F, Overy DP, McQuillan K, Lanteigne M, Duncan N, Correa H and Kerr RG (2019) Discovery of a New Natural Product and a Deactivation of a Quorum Sensing System by Culturing a “Producer” Bacterium With a Heat-Killed “Inducer” Culture. Front. Microbiol. 9:3351. doi: 10.3389/fmicb.2018.03351
Discovery of a New Natural Product
and a Deactivation of a Quorum
Sensing System by Culturing a
“Producer” Bacterium With a
Heat-Killed “Inducer” Culture
Libang Liang1, Amanda Sproule1, Brad Haltli1,2,3, Douglas H. Marchbank1,3,
Fabrice Berrué1, David P. Overy1,4, Kate McQuillan3, Martin Lanteigne1, Noelle Duncan3,
Hebelin Correa3and Russell G. Kerr1,2,3*
1Department of Chemistry, University of Prince Edward Island, Charlottetown, PE, Canada,2Department of Biomedical
Sciences, Atlantic Veterinary College, University of Prince Edward Island, Charlottetown, PE, Canada,3Nautilus Biosciences
Croda, Charlottetown, PE, Canada,4Department of Pathology and Microbiology, Atlantic Veterinary College, University
of Prince Edward Island, Charlottetown, PE, Canada
Herein we describe a modified bacterial culture methodology as a tool to discover new natural products via supplementing actinomycete fermentation media with autoclaved cultures of “inducer” microbes. Using seven actinomycetes and four inducer microbes, we detected 28 metabolites that were induced in UHPLC-HRESIMS-based analysis of bacterial fermentations. Metabolomic analysis indicated that each inducer elicited a unique response from the actinomycetes and that some chemical responses were specific to each inducer-producer combination. Among these 28 metabolites, hydrazidomycin D, a new hydrazide-containing natural product was isolated from the pair Streptomyces sp. RKBH-B178 and Mycobacterium smegmatis. This result validated the effectiveness of the strategy in discovering new natural products. From the same set of induced metabolites, an in-depth investigation of a fermentation of Streptomyces sp. RKBH-B178 and autoclaved Pseudomonas aeruginosa led to the discovery of a glucuronidated analog of the pseudomonas quinolone signal (PQS). We demonstrated that RKBH-B178 is able to biotransform the P. aeruginosa quorum sensing molecules, 2-heptyl-4-quinolone (HHQ), and PQS to form PQS-GlcA. Further, PQS-GlcA was shown to have poor binding affinity to PqsR, the innate receptor of HHQ and PQS.
Keywords: natural product discovery, biotransformation, induction, quorum sensing, metabolomics
INTRODUCTION
Due to intensive research efforts focused on the discovery of microbial natural products over the past 60–70 years, it has become more challenging to identify novel structural classes of natural products (Watve et al., 2001). The decreased rate of discovery coupled with the increasing incidence of emerging and multi-drug resistant pathogens has made the need for discovering new natural products as pressing as ever (Davies, 2006). An important source of microbial natural products
is filamentous bacteria belonging to the family Actinomycetales (Abdelmohsen et al., 2014, 2015). Among the actinomycetes, the genus Streptomyces is an especially rich source of natural products as 50% of all known antibiotics have been discovered from this taxonomic group (Kieser, 2000). Genomic analysis of streptomycetes and other filamentous members of the Actinomycetales have revealed that these organisms possess the genetic information to produce many more natural products than those are observed in laboratory cultures (Katz and Baltz, 2016). Consequently, there is great promise in unlocking the metabolic potential harbored in microbial genomes.
One approach that has been used extensively to enhance the diversity of metabolites produced by microorganisms is co-cultivation (Bertrand et al., 2014;Marmann et al., 2014). Under standard conditions actinomycetes are grown in an axenic state. While simplifying the fermentation and analysis process, this situation does not mimic the natural habitat of actinomycetes, which in nature are members of highly diverse microbial communities (Duncan et al., 2014). Co-cultivation aims to more closely mimic natural environments by exposing microorganisms to competition and chemical signaling that is absent under axenic conditions. Induction of natural product biosynthesis has been observed in bacteria-bacteria (Onaka et al., 2011; JiYoung and MyoungSug, 2012) and fungi-fungi (Degenkolb et al., 2002;Zhu et al., 2011;Huang et al., 2014; Wang et al., 2014) co-cultures. Interkingdom co-cultures of bacteria and fungi also commonly result in the induction of secondary metabolite biosynthesis in both the fungal (Cueto et al., 2001;Oh et al., 2005, 2007;Ola et al., 2013;Whitt et al., 2014) and bacterial (Yang, 2009;Zuck et al., 2011;Rateb et al., 2013) co-culture constituents.
The dynamics of co-cultures are challenging to characterize and in many cases the mechanisms by which silent gene clusters are activated are unknown. In some cases, direct cellular contact is required to induce production of otherwise silent metabolites (Schroeckh et al., 2009; Onaka et al., 2011). In other cases, direct contact is not required and the elicitor of silent metabolite biosynthesis is an apparently diffusible signal. For example, cell-free supernatants from cultures of Pseudomonas aeruginosa and three bacterial isolates from marine epiphytes enhanced antimicrobial activities of two marine bacteria isolated from the surface of a Halichondria sponge (Burgess et al., 1999). At least some of these diffusible signals are highly heat-stable as Mearns and co-workers showed that dialysates of live and heat-killed bacterial cultures were able to enhance antimicrobial activities of several marine bacteria (Mearns-Spragg et al., 1998). Similarly, Luti and co-workers showed that heat-killed bacterial and fungal cells induced phenazine production in P. aeruginosa (Luti and Yonis, 2013).
Standard co-culture strategies suffer from two significant drawbacks. Firstly, identifying the producer of induced metabolites can be challenging, especially when the metabolite is not detected under axenic culture conditions. Secondly, reproducibility can be difficult to achieve in co-cultures due to variable growth dynamics of the co-culture constituents. To simplify conventional co-culture methodology, we examined the effects of four different heat-killed inducer organisms (Bacillus subtilis, P. aeruginosa, Mycobacterium smegmatis, and Aspergillus
flavus) on secondary metabolite profiles of seven actinomycetes using untargeted ultra-high performance liquid chromatography high-resolution electrospray ionization mass spectrometry (UHPLC-HRESIMS) metabolomic analysis. In this way, the co-culture system was simplified to a biochemical induction with a consistent inducer concentration and composition, instead of a biological induction with multiple fluctuating variables resulting from differences in growth rates and other biological and physical interactions between microbes. Using this methodology, we identified and unambiguously characterized a naturally occurring hydrazide and a new biotransformation of the P. aeruginosa quorum-sensing molecules, pseudomonas quinolone signal (PQS) and 4-hydroxy-2-heptylquinoline (HHQ), generated through a culture of a marine Streptomyces with autoclaved M. smegmatis and P. aeruginosa, respectively. To further evaluate the utility of the methodology, this approach was compared to the traditional OSMAC (One Strain Many Compound) approach, a culture-dependent method for natural product induction via altering culture conditions (Bode et al., 2002).
MATERIALS AND METHODS
General Methods
All commercially available solvents and reagents were used without further purification. Deionized water was purified to 18.2 M·cm on a Milli-Q R Biocel water purification
system (EMD Millipore). Automated reversed-phase medium pressure liquid chromatography (RP-MPLC) was performed on a CombiFlash Rf (Teledyne Isco) equipped with a photodiode array (PDA) detector. Reversed-phase high-performance liquid chromatography (RP-HPLC) was performed on an AccellaTM
chromatography system (Thermo Fisher Scientific) equipped with a PDA and evaporative light scattering detector (ELSD Sedex 80). All 1H, 13C, and 15N NMR spectra were acquired
on a 600 MHz Bruker Avance III NMR spectrometer operating at 600, 150, and 60 MHz, respectively. All chemical shifts were reported in δ units (ppm) and were referenced to the residual solvent signal (CD3OD: δH7.26 ppm and δC77.16 ppm;
DMSO-d6: δH2.50 ppm and δC39.52 ppm, CDCl3: δH7.26 ppm and δC
77.16 ppm; CD3CN: δH1.94 ppm and δN245.6 ppm). Coupling
constants were reported in Hz with the following abbreviations: (s) singlet, (d) doublet, (t) triplet, (q) quartet, (quint) quintet, (m) multiplet. Tandem mass spectra were recorded on a Thermo LTQ Orbitrap Velos mass spectrometer using collision induced dissociation (CID). Optical rotations were recorded on an Autopol III polarimeter (Rudolph Research Analytical). Infrared spectra were acquired by attenuated total reflectance using a SMART iTRTM accessory on a NicoletTM 6700 FTIR spectrometer (Thermo Fisher Scientific). Gas chromatography-mass spectrometry was operated on an Agilent 6890N Network GC system connected to a 5973 Inert Mass Selective Detector using 70 eV ionization voltage (EI).
Bacterial strains used in inducer-producer cultures and HHQ feeding experiments are listed in Table 1 and Supplementary
TABLE 1 | Microorganisms used in inducer-producer culture experiments.
Code Strain (Accession No.) Taxonomy (Blast Hit Accession No.) Identity (%) Source Producers
I MF730-N6 Kitasatospora griseolaMF730-N6 n.a. 1
II NRRL B-16091 Micromonospora aurantiaca n.a 2
III RKAG-348 (KY362381) Streptomyces fulvissimus(NR_103947.1) 99.86 3 IV RKBH-B349 (KY362384) Streptomyces peucetius(NR_024763.1) 99.39 3 V RKND-616 (KY362395) Micromonospora maritima(NR_109311.1) 99.26 3 VI RKBH-B178 (KY362383) Streptomyces drozdowiczii(NR_116093.1) 98.72 3
VII M145 Streptomyces coelicolor n.a 4
Inducers
PA ATCC 142105 Pseudomonas aeruginosa n.a. 5
BS ATCC 60515 Bacillus subtilis n.a. 5
MS ATCC 120515 Mycobacterium smegmatis n.a. 5
AF NRRL 33572 Aspergillus flavus n.a. 2
Sources of strains: (1) Japan International Patent Organism Depositary, (2) ARS culture collection (NRRL), (3) in house collection, (4) John Innes Institute, and (5) American Type Culture Collection. For actinomycetes obtained from our in-house culture collection, taxonomy was derived from the closest 16S rDNA match from a BlastN search of the GenBank 16S rRNA sequence database.
(B. subtilis ATCC 6051, A. flavus NRRL 3357, M. smegmatis ATCC 12051 and P. aeruginosa ATCC 14210), were maintained on Difco ISP2 agar at 30◦C. P. putida KT2440
[pBBR-pqsR-pqsA’-‘lacZ] (Müller and Fetzner, 2013) was maintained at 37◦C on
Luria-Bertani (LB) agar (Sambrook et al., 1989) supplemented with kanamycin (50 µg/mL; Sigma-Aldrich, 60615-5G).
For actinomycete fermentations, a two-stage seed culture process was used to generate inocula. Approximately a 1 cm2
region was scraped from the surface of a well grown agar plate and used to inoculate 7 mL of ISP2 broth in 25 mm × 150 mm culture tube containing 5 4-mm glass beads. The first-stage seed culture was incubated at 30◦C with shaking (200 rpm) for 72 h
after which 1 mL of the first-stage seed was then transferred to 7 mL of fresh ISP2 and cultured for an additional 24 h under the same conditions.
All cell lines were acquired from ATCC; MCF7 breast cancer cells and CCL-81 Vero kidney cells were grown and maintained in 15 mL of Eagle’s minimal essential medium (Sigma-Aldrich, M5650), HCT116 colon cancer cells in McCoy’s 5a Medium Modified (Sigma-Aldrich, M9309-500ML), and HTB26 breast cancer cells in Dulbecco’s Modified Eagle’s Medium/Nutrient Mixture F-12 Ham (Sigma, D6421-500ML) supplemented with 10% fetal bovine serum (VWR, CA95043-976). All cultures were supplemented with 100 µU penicillin and 0.1 mg/mL streptomycin (VWR, CA12001-692) and fermented in T-75 cm2
cell culture flasks at 37◦C in a humidified atmosphere of 5% CO 2.
Cell culture medium was refreshed every 2–3 days and cells were not allowed to exceed 80% confluency.
Bacterial Fermentation and Extraction
“Inducer” organisms were cultured on ISP2 agar (500 mL; static) or in ISP2 broth (500 mL; 200 rpm) for 2–6 days at 30◦C. Incubation periods were 2 days for B. subtilis and
P. aeruginosa, 4 days for A. flavus, and 6 days for M. smegmatis. Different incubation times were chosen due to the different growth rates of the four microorganisms. All cultures were
heat killed by autoclaving at 121◦C for 30 min. To prepare
solid culture medium containing heat-killed inducer cultures, autoclaved cultures (agar or broth), without further filtration, were diluted with four equivalent volumes of freshly prepared ISP2 agar medium. The “no-inducer controls” were prepared by mixing autoclaved ISP2 broth or ISP2 agar with four equivalents of freshly prepared ISP2 agar. Media were distributed in Petri dishes (10 cm dia.).
Actinomycete inocula were prepare using a two-stage seed culture protocol (see above). Liquid cultures (200 µL) of actinomycete “producer” strains were spread on the surface of agar media and the plates were incubated at 30◦C for 6 days.
Duplicate experiments were performed. To extract metabolites from agar cultures, the agar was cut into ∼1 cm2 pieces and
frozen at −80◦C. After thawing the agar was extracted twice with
7 mL EtOAc. Extracts were combined, evaporated in vacuo, and analyzed by UHPLC-HRESIMS.
UHPLC-HRESIMS Analysis
UHPLC-HRESIMS analysis was performed using an ExactiveTM
Orbitrap mass spectrometer (Thermo Fisher Scientific) equipped with an Accela PDA (Thermo Fisher Scientific) and SEDEX Model 80 LT-ELSD detector (Sedere). The UHPLC was equipped with a Core Shell Kinetex C18column (2.1 mm × 50 mm, 1.7 µm,
Phenomenex), which was operated with a mobile phase flow rate of 0.5 mL/min and a linear gradient from H2O:CH3CN (95:5,
0.1% formic acid) at 0.2 min to 100% CH3CN (0.1% formic acid)
at 4.8 min. The mobile phase was held at 100% CH3CN (0.1%
formic acid) for 3.2 min before returning to H2O:CH3CN (95:5,
0.1% formic acid) over 0.5 min and equilibrating the column for 1.5 min. The mass spectrometer was operated in positive mode, monitoring a m/z range from 190 to 2000, using a resolution of 30,000, spray voltage of 2.5 kV, capillary temperature of 300◦C,
tube lens voltage of 145 V, skimmer voltage of 14 V, maximum injection time 50 ms, and microscans of 1. PDA detector was monitoring between 200 and 600 nm.
Untargeted Metabolomics Analysis
Raw HRMS data was processed using MZmine 2 (Pluskal et al., 2010) as previously described, with minor modifications (Forner et al., 2013). Mass detection was performed using a noise level value (intensity) of 1 × 10⁴ counts/s (cps) and chromatogram building utilized a minimum time span of 0.1 min, a minimum peak height of 1E4 and a m/z tolerance of 0.001 m/z or 5 ppm. After chromatograms were built, chromatogram deconvolution was performed using the local minimum search algorithm to remove random signals. Chromatogram deconvolution parameters were as follows: chromatographic threshold – 35%, search minimum in RT range – 0.1 min, minimum relative height – 35%, minimum absolute height – 1E4, minimum ratio of peak top/edge – 1.5. Deconvoluted chromatograms were gap-filled using a m/z tolerance of 0.001 m/z or 5 ppm and deisotoped. Normalization was applied after deisotoping using the linear normalizer method in MZmine 2 using maximum peak intensity as the normalization type, and peak area as the peak measurement type. The normalized data were aligned and exported to CSV format as described previously (Forner et al., 2013).
The distribution of induced mass features between strains and treatments was visualized in a heat map created in R using the “d3heatmap” function. Replicate cultures were treated individually to assess reproducibility. Using the “colors” package, peak areas under 1E4 were colored white while areas between 1E4 and 1E8 were colored with a gradient of black to red, indicating mass intensity from low to high. Cluster analysis was performed with the “dendrogram” package by column (mass features) without further restriction.
Feeding Experiments With Pure
P. aeruginosa
Metabolites
Streptomyces sp. RKBH-B178 inoculum was prepare using a two-stage seed culture protocol (see above). 210 µL of the second-stage seed was added in 7 mL of ISP2 and incubated at 30◦C
and 200 rpm. HHQ (Sigma-Aldrich, SML0747-10MG), PQS (Sigma-Aldrich, 94398-10MG), and rhamnolipids (R90 product, AGAE Technologies; 90% rhamnolipids A and B, 10% minor rhamnolipid congeners) were diluted in CH3OH and added to
RKBH-B178 cultures (0–25 µM) after 48 h of growth. Cultures were incubated for four more days and then extracted twice with 7 mL EtOAc. Extracts were combined, dried under air and dissolved in 3 mL CH3OH supplemented with 20 µg/mL dioctyl
phthalate (Sigma-Aldrich, D201154-5ML) as an internal standard for UHPLC-HRESIMS analysis. The experiment was performed in triplicate.
Hydrazidomycin D Scale-Up, Purification
and Structure Elucidation
M. smegmatis inducer was cultured on ISP2 agar for 6 days and then the culture was autoclaved. Fresh ISP2 agar and autoclaved M. smegmatis agar (mixed at 1:4 ratio) were used to prepare the culture medium upon which Streptomyces sp. RKBH-B178 was fermented in 300 agar plates (d = 15 cm, each plate contained 20 mL medium). After 6 days of incubation, the agar was cut into ∼1 cm2 pieces and stored at −80◦C overnight and
then extracted with about 6 L EtOAc overnight. Purification was first carried out using an automated flash chromatography system (Combiflash Rf, Teledyne ISCO) equipped with a PDA detector monitoring at 250 and 280 nm. The crude extract was prepared for solid load injection by adsorbing it onto C18 and
the separation was performed with a 43 g C18column (RediSep
Rf Gold R) using a mobile phase flow rate of 40 mL/min. The
mobile phase consisted of a linear gradient from CH3OH:H2O
(1:9) to 100% CH3OH over 21 min followed by 100% CH3OH
for 5 min. Hydrazidomycin D was further purified by RP-HPLC using a semi-preparative Gemini C6-Phenyl 110 Å column (250 mm × 10 mm, 5 µm; Phenomenex, 637824-1). An isocratic elution with 14% H2O and 86% CH3OH for 30 min was used.
The eluent was monitored by ELSD and UV at 236 nm while the hydrazidomycin D was collected at 25.6 min.
The location of the double bond position in the C18 alkyl chain of hydrazidomycin D was determined using a modified dimethyl disulfide (DMDS) derivatization (Buser et al., 1983;
Figure 2B). Hydrazidomycin D (250 µg) was dissolved in 2 mL methanolic HCl and refluxed with stirring overnight. The reaction was evaporated in vacuo. The methyl ester product sample was dissolved in 200 µL hexanes. 50 µL of neat DMDS (Sigma-Aldrich, 471569-25ML) was added followed by a 6% iodine solution in diethyl ether (5 µL) and incubated at 40◦C
overnight. The reaction was then diluted with 200 µL of hexanes before quenching with a 100 µL 5% Na2S2O3 solution in
deionized water. The aqueous layer was extracted three times with 200 µL hexanes. The organic extracts were combined and dried under a stream of air. The sample was dissolved in 100 µL hexanes and analyzed by GC-EIMS. An Agilent 6890N Network GC system was operated using a HP-5MS column coated with 5% phenyl methyl siloxane (Agilent, 19091S-433). Helium was used as the carrier gas at a constant flow rate of 1.0 mL/min and the nominal initial pressure was 11.65 psi. The GC oven was programmed with an initial temperature of 120◦C, which was
held for three minutes. The temperature was increased at a rate of 17◦C/min until it reached 280◦C and then the oven was held at
280◦C for 8 minutes. Agilent 5973 inert mass selective detector
was used to monitor mass range from 50 to 400 amu with an electronic multiplier voltage of 1765 V.
Hydrazidomycin D (1): yellow oil; no UV absorbance; IR νmax
3258, 3005, 2955, 2924, 1688, 1665, 1529, 1466, 1390, 1264 cm−1;
for 1H and 13C NMR data see Supplementary Table S2;
HRESIMS m/z [M+H]+ 421.3781 (calcd for C
26H49N2O2,
421.3789).
Production and Characterization of
PQS-GlcA
Streptomyces sp. RKBH-B178 was fermented in 2.95 L (59 × 50 mL) of ISP2 broth containing 25 µM HHQ at 30◦C and
200 rpm for 6 days. The fermentation broth was extracted with EtOAc and fractionated by an automated flash chromatography as described for hydrazidomycin D. PQS-GlcA was further purified by RP-HPLC using the same semi-preparative Gemini column as described previously. An isocratic elution with 55% H2O 0.1% formic acid (solvent A) and 45% CH3CN 0.1% formic
acid (solvent B) over 15 min was used and PQS-GlcA was collected at 8.9 min. At 15 min, the column was cleaned with a linear gradient over 1 min to 100% solvent B, which was held for 10 min. The eluent was monitored by ELSD and UV at 238 and 321 nm.
The configuration of the GlcA moiety in PQS-GlcA was determined using Tanaka’s method (Tanaka et al., 2007; Wang et al., 2012). PQS-GlcA (100 µg) was dissolved in 10 µL tetrahydrofuran (THF) and 40 µL H2O. The acid hydrolysis
was performed by adding 50 µL 2M HCl and incubating overnight at 95 ◦C. The reaction mixture was evaporated
to dryness in vacuo and re-suspended in 50 µL pyridine containing 1 mg/mL D-cysteine methyl ester (D-CME, Sigma-Aldrich, C2174-1G). The mixture was sonicated until the crude product was dissolved and incubated at 60◦C for 1 h. Then
0.5 µL neat o-tolyl isothiocyanate (Sigma-Aldrich, 253723-5G) was added and the reaction was stirred at 60◦C for 1 h. The
reaction mixture was evaporated to dryness in vacuo and the crude product was resuspended in CH3OH at a concentration
of 0.5 mg/mL. Similarly, the corresponding derivatives from commercially available D-GlcA (Sigma-Aldrich, G5269-10G) were prepared using D- and L-CME (Sigma-Aldrich, 410209-5G) to obtain the appropriate standards for UHPLC-HRESIMS analysis; L-GlcA was not commercially available but the retention time of L-GlcA/D-CME was measured using its enantiomer D-GlcA/L-CME.
The crude products (10 µL) were analyzed by UHPLC-HRESIMS using a LTQ Orbitrap Velos mass spectrometer (Thermo Fisher Scientific) in positive mode. The UHPLC was equipped with a C18 Hypersil Gold 175 Å column
(50 mm × 2.1 mm, 1.9 µm, Thermo Fisher Scientific, 25002-052130), which was operated with a mobile phase flow rate of 0.4 mL/min and a linear gradient from H2O:CH3OH (87:13,
0.1% formic acid) at 20.0 min to H2O:CH3OH (70:30, 0.1%
formic acid) at 28.0 min, which was held for 2.0 min before starting a linear gradient to 100% CH3OH (0.1% formic acid)
over 2.0 min. The mobile phase was held at 100% CH3OH (0.1%
formic acid) for 6.0 min before returning to H2O:CH3OH (87:13,
0.1% formic acid) over 4.0 min and equilibrating the column for 2.8 min. Retention times of the reaction products were as follows: D-GlcA/D-CME 25.27 min, D-GlcA/L-CME 26.96 min, PQS-GlcA/D-CME 25.27 min.
PQS-GlcA (6): yellow solid; [α]30D −252 (c 0.04, CH3OH);
UV λmax 228, 321 nm; IR νmax 3278, 2929, 2814, 2188, 2036,
1611, 1517, 1352, 1115 cm−1; for 1H and 13C NMR data see
Supplementary Table S3; HRESIMS m/z [M+H]+ 436.1966
(calcd for C22H30NO8, 436.1966).
β-Galactosidase Assay
The quorum sensing activity of PQS-GlcA was determined using a Pseudomonas putida KT2440-based LacZ reporter strain [pBBR-pqsR-pqsA’-‘lacZ] kindly provided by Dr. Fetzner (Müller and Fetzner, 2013). P. putida was cultured in LB broth (1 mL) supplemented with 50 µg/mL kanamycin and the inoculation was adjusted to an OD600of 0.05. HHQ, PQS, and PQS-GlcA in
CH3OH were added to the cultures at concentrations between
0 and 20 µM. After incubating at 300 rpm for 5 h at 30◦C,
β-galactosidase activity was measured as described previously (Müller and Fetzner, 2013). β-galactosidase activity was expressed as Miller units using the equation
MU=1000×(OD600×V×tA420−1.75×A550) . The
experiment was performed in five replicates. Absorbance was measured using a SpectraMax M5e microplate reader (Molecular Devices). Dose-response curves were plotted using a built-in function log (agonist) vs. response (three parameters) and the EC50values were calculated using Y = Bottom +1+10Top−bottomLogEC50−X to
model non-linear regression in Prism 7.0 (GraphPad Software).
Molecular Docking Simulations
Molecular docking simulations of PQS and PQS-GlcA with PqsR were performed using SwissDock (Grosdidier et al., 2011a,b). The crystal structure 4JVC (Ilangovan et al., 2013) was selected as the protein target. PQS and PQS-GlcA were submitted in MOL2 format as ligands. The computed binding results were viewed in Chimera (Pettersen et al., 2004) using default settings.
Assessing HHQ Biotransformation in 14
Actinomycetes
Fourteen actinomycete isolates (Supplementary Table S4) from our culture collection were cultured in 7 mL of ISP2 broth containing 0, 10, and 100 µM HHQ for 6 days at 30◦C, 200 rpm.
Fermentations (in triplicate) were inoculated with 210 µL of a second stage seed culture and extracted twice with 7 mL of EtOAc. The EtOAc layers were combined and washed with H2O
twice and the organic layer was evaporated to dryness in vacuo. Dried extracts were dissolved in 1 mL of CH3OH and analyzed
by UHPLC-HRESIMS as described above.
Antimicrobial Assay Against
M. smegmatis
Hydrazidomycin D, rifampin (Sigma-Aldrich, R7382-1G), and isoniazid (Sigma-Aldrich, 13377-5G) were filter-sterilized separately and diluted to concentrations from 2.5 to 320 µg/mL in 20% DMSO. M. smegmatis was cultured on Difco Middlebrook 7H10 agar (Fisher Scientific, DF0627-17-4) for 4 days. The growth on the plate was swabbed to a seed tube containing 4.5 mL of autoclaved H2O and 10 4-mm glass beads, which
was subsequently vortexed for 2 min and allowed to stand for 20 min. The suspended cells were used to adjust another seed tube of autoclaved H2O to the 0.5 McFarland Standard.
125 µL of the adjusted seed was added to 25 mL of Mueller-Hinton II (Cation-Adjusted) broth (Fisher Scientific, B11438) as inoculum. In a 96-well plate, each well was added 20 µL of the tested compounds, 100 µL of the inoculum, as well as another 80 µL of fresh Mueller-Hinton II (Cation-Adjusted) broth. Rifampin and isoniazid were used as antibiotic controls. Vehicle controls were prepared by 20% DMSO with Mueller-Hinton II (Cation-Adjusted) broth and media controls were only Mueller-Hinton II (Cation-Adjusted) broth. The experiment was performed in triplicate. After 6 days of stationary incubation at 30◦C, growth or inhibition in each well was visualized
Cytotoxicity Assays
The assay protocol was adopted fromOvery et al. (2014). At 80% confluency, MCF7 breast cancer cells, HTB26 breast cancer cells, and HCT116 colon cancer cells were diluted and plated into 96-well cell culture plates at 5,000 cells/96-well, while CCL-81 Vero kidney cells were plated at 10,000 cells/well in 90 µL of respective culture media as described in General Methods. The plates were pre-incubated for 24 h before treatment with hydrazidomycin D (in 10 µL sterilize DMSO) at six final concentrations ranging from 32 to 1 µg/mL in triplicate. All cell lines were incubated at 37◦C in a humidified atmosphere of 5% CO
2for 72 h. Each plate
contained four uninoculated positive controls, four untreated negative controls, and one column containing a concentration range of zinc pyrithione or doxorubicin. Alamar blue was added 72 h after hydrazidomycin D addition to cell cultures (except 24 h for CCL-81 Vero kidney cells), and fluorescence was monitored using a Thermo Scientific Varioskan Flash plate reader at 560/12
excitation, 590 nm emission at time zero and 4 h after Alamar blue addition. The percentage of cell viability were calculated by subtracting the time zero emission measurement from the final reading and the IC50value was determined by the lowest tested
concentration reaching 50% cell inhibition.
Metabolomic Comparison Between
Addition of Heat-Killed Inducer and
OSMAC Approaches
Streptomyces sp. RKBH-B178 was cultivated in 18 nutritionally diverse media composed of a range of carbon sources (simple and complex), nitrogen sources (inorganic, amino acid, and complex nitrogen sources), phosphate levels and osmolarity as well as ISP2 supplemented with M. smegmatis cell-free broth (CFB) or M. smegmatis cells. The recipes of these media for the OSMAC approach are listed in Supplementary Table S5.
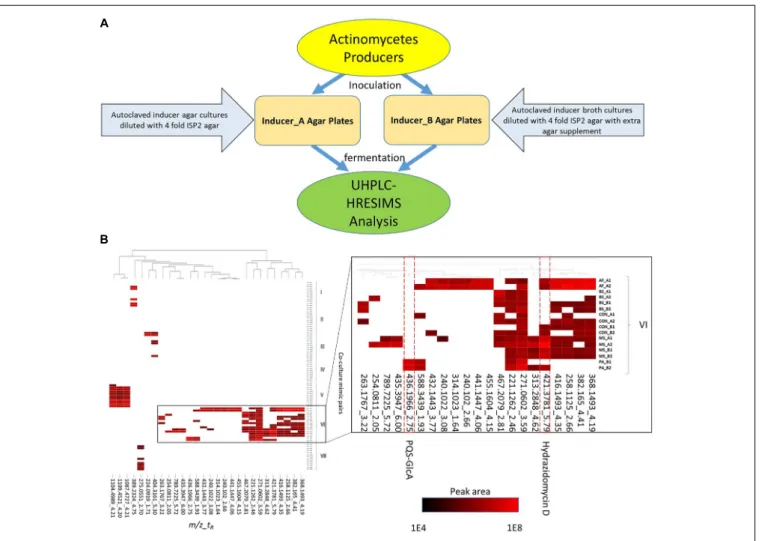
FIGURE 1 | Inducer-producer culture strategy and metabolomic analysis. (A) Inducer-producer culture strategy overview. (B) UHPLC-HRESIMS based untargeted metabolomic analysis. 28 mass features are selected in the heatmap based on induction, upregulation, and peak area abundance. The vertical axis indicates actinomycete and inducer-producer pairings. Four inducer organisms include: PA, P. aeruginosa; BS, B. subtilis; MS, M. smegmatis; and AF, A. flavus. Preparation of the inducer organisms in ISP2 agar or broth is indicated by (A) or (B), respectively. The control experiments (CON) were prepared by adding twice-autoclaved ISP2 media to the mono-cultures of the producers. The two experimental replicates are indicated by 1 or 2. The horizontal axis indicates induced mass features (detected ions defined by a m/z and tRwindow) from UHPLC-HRESIMS analysis. The mass features are presented in a m/z_tRformat and are clustered across different culture
To prepare the M. smegmatis culture, it was first cultured in ISP2 broth at 30◦C and 200 rpm until confluent growth
was observed. 25 mL of the seed culture was used to inoculate 2.8 L Fernbach flasks containing 500 mL of ISP2 broth. After 6 days at 30◦C and 200 rpm, the M. smegmatis culture was
autoclaved, and centrifuged at 10,000 x g for 10 min. The cells and CFB were separated and 1 mL of packed cells and CFB were diluted in 6 mL of fresh ISP2 to make the M. smegmatis CFB and cell media, respectively. All fermentations were conducted in 7 mL of medium in 25 mm × 150 mm tubes. Fermentations were inoculated with 3% (v/v) of a second stage seed culture and incubated at 30◦C and 200 rpm for 6 days. The
cultures were extracted by adding 7 mL EtOAc and shaking at 250 rpm for 1 h. The organic layer (5 mL) was removed and dried in vacuo. All samples were then resuspended in 3 mL CH3OH containing 10 µg/mL dioctyl phthalate as an internal
standard and analyzed by UHPLC-HRESIMS. Xcalibur Software (Thermo Fisher Scientific) was used to integrate peak area of hydrazidomycin D across all the raw LCMS data files.
RESULTS
Metabolomics Analysis of Cultures
Treated With Heat-Killed Inducer
To evaluate the utility of the new culture strategy to modulate the secondary metabolism of actinomycetes, we utilized four phylogenetically distinct microbes as heat-killed “inducers” (B. subtilis, A. flavus, M. smegmatis, and P. aeruginosa) and evaluated their effect against seven actinomycete “producers” belonging to three different genera (Streptomyces, Kitasatospora, and Micromonospora) (Table 1). Inducers were chosen based on previous reports of interspecies induction of secondary metabolites in streptomycetes (Shank and Kolter, 2009; Onaka et al., 2011; Reen et al., 2011; Verheecke et al., 2015). Actinomycetes were cultured on agar supplemented with heat-killed inducer organisms (20% v/v) and extracts derived from these cultures were analyzed by UHPLC-HRESIMS to identify metabolites whose production was induced in response to exposure to heat-killed inducer organisms (Figure 1A).
In total, 890 mass features were identified after processing of the UHPLC-HRESIMS raw data with a mass intensity threshold of 1E4. After removing mass features detected in media blanks and monocultures of inducers, 659 mass features remained. These mass features represented metabolites produced by the actinomycetes in standard conditions and those produced in response to the presence of autoclaved inducers. The relative increase in production of these metabolites was examined by comparing mass features’ peak areas between the standard and treated cultures. In this analysis, 20 mass features showed a more than five-fold increase (up-regulated) in at least one inducer-producer pair. In parallel, another 17 induced mass features were highlighted because they were absent in the standard conditions (induced) and their peak areas were higher than 1E5 in at least one inducer-producer pair. To reduce redundancy in the 37 mass features, the [M+Na]+ and [M+NH
4]+ adducts
were deleted if their corresponding [M+H]+ adducts were
detected. The final dataset contained 28 mass features of interest including up-regulated mass features and induced mass features (Supplementary Table S1).
To visualize patterns of metabolite induction, a heat map showing the distribution of the 28 mass features of interest across strains and treatments was constructed (Figure 1B). Cluster analysis of the induced metabolite profiles revealed clustering based primarily on actinomycete strain and type of inducer treatment, indicating that each actinomycete exhibited a unique response to the inducers (Figure 1B). Strain VI (Streptomyces sp. RKBH-B178) exhibited the highest response in the cultures with 21 mass features of interest. Strains III (Streptomyces sp. RKAG-348) and VI showed metabolic responses to agar-derived A. flavus, whereas the other producer strains had poor or no growth. Strain VI also had a unique response to broth-derived P. aeruginosa, while all other actinomycetes had poor or no growth. This inhibition was presumably due to the production of growth inhibitory substances by the inducer strains. Known toxins such as aflatoxins from A. flavus and pyocyanin from P. aeruginosa were detected by UHPLC-HRESIMS in broth and agar extracts at various levels (data not shown). Strain VI exhibited resistance to these inhibitors that otherwise restricted the growth of the other producer strains, although the mechanism of this resistance was not investigated.
To validate this approach and determine if this strategy was an effective method of altering, and ultimately enriching, actinomycete secondary metabolomes, we attempted to identify the induced metabolites shown in Figure 1B by comparison of observed m/z values (exact masses) to those contained in a commercial database AntiBase (Laatsch H. Antibase: The Natural Compound Identifier. Wiley-VCH, 2017 version). Subsequent isolation and spectroscopic analysis led to the identification of a new hydrazide and a new biotransformation product of quorum sensing molecules of P. aeruginosa.
Identification of a New Hydrazide From
the Cultivation of Streptomyces sp.
RKBH-B178 With Heat-Killed
M. smegmatis
Strain VI (Streptomyces sp. RKBH-B178) was observed to produce the highest number of mass features. In these fermentations we observed a unique mass feature (421.3781_5.79), which was up-regulated by agar-derived A. flavus and agar- and broth-derived M. smegmatis. The highest production was achieved when treated with agar-derived M. smegmatis (Figure 1B), resulting in an 18.7-fold increase in peak area over control. No natural product with a m/z value within 5 ppm was found in AntiBase, suggesting this metabolite was putatively new. To purify the metabolite, a 6 L scale-up fermentation was performed using the heat killed inducer addition with agar-derived M. smegmatis. The crude extract was then subjected to automated flash chromatography and HPLC purification to afford 1 hydrazidomycin D (0.5 mg), which was named based on structural similarities to hydrazidomycins (Ueberschaar et al., 2011).
FIGURE 2 | Structural characterization of hydrazidomycin D (1). (A) Hydrazidomycin D key COSY,1H-13C HMBC, and1H-15N HMBC (H→C) correlations.
(B) Overall scheme of DMDS derivatization to determine the position of the double bond in the C18 alkyl chain.
The molecular formula of 1 was established on the basis of HRESIMS analysis (m/z 421.3781 [M+H]+) to be C
26H48N2O2
(Supplementary Figure S3A), indicating four degrees of unsaturation. The IR spectrum suggested the presence of two carbonyl groups with stretches at 1665 and 1688 cm−1. The 1H NMR spectrum indicated the presence of a double bond
comprised of olefinic resonances H-19 (δH 7.01) and H-20 (δH
4.94). The large vicinal coupling constant (J = 14.1 Hz) across the 119,20double bond allowed the E configuration to be assigned. The structure of the linear six-carbon alkyl chain was then confirmed by COSY correlations between H-21 (δH1.99) and
H-20 (δH 4.94) /H-22 (δH 1.28) and HMBC correlations between
H-24 (δH 0.85) and C-22 (δC 31.6)/C-23 (δC 21.5) (Figure 2A
and Supplementary Figure S1). The1H-15N HMBC spectrum showed correlations between H-19 and both Nα(δ
N134.6) and
Nβ (δ
N 151.2), suggesting the presence of a hydrazide moiety.
A1H-15N HMBC correlation between H-20 and Nβconfirmed
a covalent bond between C-19 (δC 123.9) and Nβ (Figure 2A
and Supplementary Figures S2A,C). An acetate moiety was also deduced from methyl proton H-26 (δH1.97) and a HMBC
correlation between H-26 and C-25 (δC168.1). The incorporation
of this acetate moiety at Nα was established from the 1H-15N
HMBC correlation between H-26 and Nα. The1H-15N HSQC
spectrum confirmed the attachment of hydrazide proton H-Nα
(δH8.41) to Nα(Figure 2A and Supplementary Figures S2A,B).
An additional 1H-13C HMBC correlation between H-Nα and
C-25 and a 1H-15N HMBC correlation between H-Nα and
Nβ confirmed the assignment of the acetylhydrazide moiety
(Figure 2A and Supplementary Figures S2A,C).
Meanwhile, an unsaturated fatty acid moiety was established based on the presence of methylene protons H-2 (δH
2.31/2.09) /H-3 (δH 1.45), methyl proton H-18 (δH 1.26),
and olefinic protons H-11/H-12 (δH5.32). The apparent lack of
methine protons and carbon signals suggested a linear fatty acid chain with no branching, while the proposed molecular formula indicated a chain length of 18 carbons. Methylene protons H-2 and H-3 exhibited HMBC correlations to carbonyl C-1 (δC171.6). The connectivity between C-1 and Nβcould not be
unambiguously assigned on the basis of two-dimensional NMR, owing to the apparent lack of a 1H-15N correlation between
H-2 and Nβ and1H-13C correlations between H-Nα/H-19 and
C-1. However, the lack of other positions on the acetylhydrazide moiety for the attachment of the fatty acid moiety indicates the connectivity must be between C-1 and Nβ. Structurally similar
natural products geralcin B (Le Goff et al., 2012), geralcin C, and geralcin E (Le Goff et al., 2013) were reported without these same correlations, indicating the correlation might not be able to observed using conventional NMR techniques. The configuration of the 111,12double bond was assigned on the basis
of the chemical shifts of allylic carbon resonances C-10/C-13 (δC
27.4 in CDCl3, Supplementary Figure S1F), indicating the Z
configuration (van Boom et al., 1977). The proposed structure of hydrazidomycin D (Figure 2A) was further corroborated by tandem mass spectrometry with the observation of a fragment ion with m/z of 157.1331, consistent with fragmentation across the amide moiety of C-1 and Nβ(Supplementary Figure S3B).
The position of the 111,12 double bond in the 18-carbon
alkyl chain was unambiguously determined by GC-EIMS analysis of the DMDS derivative of its fatty acid methyl ester (3). The parent ion with a m/z of 390.2 [M+]+underwent fragmentation
to generate daughter ions with m/z values of 245.1 (4) and 145.1 (5). This observation is consistent with fragmentation across the C-11/C-12 bond, which is between the two thiomethyl groups (Supplementary Figure S3C), revealing the position of the double bond and indicating the presence of a cis-vaccenic acid moiety in hydrazidomycin D. Pure hydrazidomycin D showed an
IC50value of 16 µg/mL against MCF7 breast cancer cells and was
not active against CCL-81 Vero kidney cells, HTB26 breast cancer cells, HCT116 colon cancer cells. Further, it was inactive against the inducer M. smegmatis up to 32 µg/mL.
Identification of a New Metabolite From
the Cultivation of Streptomyces sp.
RKBH-B178 With Heat-Killed
P. aeruginosa
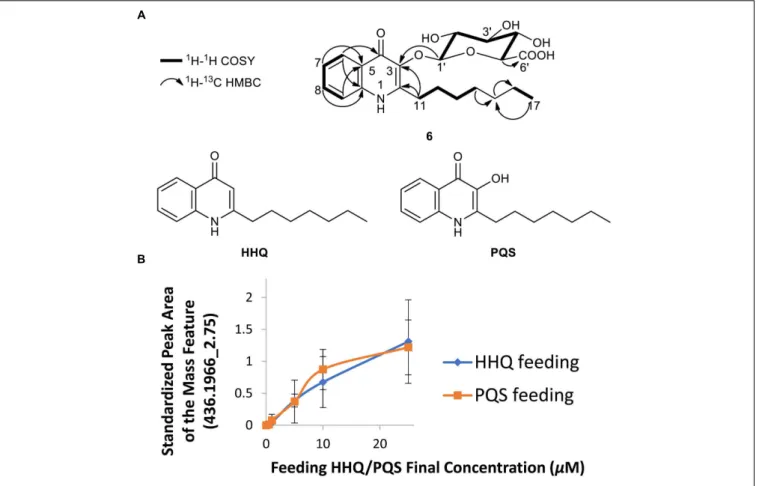
We also chose to explore the P. aeruginosa-Streptomyces sp. RKBH-B178 inducer-producer pair, where we observed a unique mass feature (436.1966_2.75) with a peak area of 1E4 in the UHPLC-HRESIMS dataset in both replicates (Figure 1). No natural products with a m/z value within 5 ppm were found in AntiBase 2017, suggesting this metabolite (6) was putatively new. To investigate potential triggers for the biosynthesis of 6, we analyzed extracts of autoclaved P. aeruginosa by UHPLC-HRESIMS and identified the major metabolites as HHQ, PQS, rhamnolipids and possible analogs of HHQ and rhamnolipids (Supplementary Figures S4A,B). Therefore, we tested the ability of commercially available HHQ, PQS and rhamnolipids to induce the production of metabolite 6 in Streptomyces sp. RKBH-B178. The target metabolite was only observed when RKBH-B178 was treated with various concentrations of HHQ and PQS (Figure 3B), suggesting HHQ and PQS from the P. aeruginosa cultures were responsible for the production of the target compound. Addition of rhamnolipids was not effective in inducing this metabolite.
Extraction of a scale-up fermentation (2.95 L) of RKBH-B178 treated with 25 µM HHQ afforded 409 mg of crude extract, which was fractionated by automated flash chromatography and subsequently purified by RP-HPLC, providing 0.4 mg of pure compound 6. UHPLC-HRESIMS analysis of compound 6 supported a molecular formula of C22H29NO8 (m/z 436.1966
[M+H]+), indicating eight degrees of unsaturation. The NMR
data (Supplementary Table S3 and Supplementary Figure S5) revealed the presence of four aromatic protons, H-6 (δH 8.26),
H-7 (δH 7.37), H-8 (δH 7.67), and H-9 (δH 7.62), which were
assigned by interpretation of COSY correlations and key HMBC correlations H-6/C-10 (δC140.0), H-9/C-5 (δC126.2), H-7/C-5
and H-8/C-10 (Figure 3A). The HMBC correlation between H-6 and C-4 (δC 174.0) allowed one of the two carbonyl resonances
to be unambiguously assigned to the C-4 position. The presence of a seven-carbon alkyl chain was identified using COSY and HMBC correlations suggesting structural similarity to HHQ and PQS (Figure 3A). The HMBC correlations H-11 (δH 3.22,
2.99)/C-2 (δC 151.6), and H-11/C-3 (δC 139.1) allowed the two
remaining aromatic carbon resonances to be assigned, indicating the presence of a quinolone ring with the alkyl chain attached to the C-2 position. The spectroscopic data is in agreement with that previously reported for both HHQ and PQS (Reen et al., 2012).
The characteristic anomeric carbon resonance C-1′(δ C107.6)
and the HMBC correlation between anomeric proton H-1′
[4.68 (d, J = 7.8 Hz)] and C-3 revealed the presence of a carbohydrate moiety attached to the C-3 position of the
quinolone ring. The glycosidic spin system H-1′through to
H-5′ was assigned by interpretation of COSY correlations. The
remaining carbonyl signal was assigned to the C-6′ position
on the basis of an HMBC correlation H-5′ (δ
H 3.57)/C-6′
(δC 177.2) and is consistent with the proposed molecular
formula. Further, coupling constants exhibited by H-1′and
H-4′ [δ
H 3.53 (t, J = 9.3 Hz)] showed their axial relationship
with neighboring protons suggesting the presence of a β-glucuronic acid moiety. The configuration of the carbohydrate substituent was determined using Tanaka’s method (Tanaka et al., 2007; Wang et al., 2012), which confirmed that the sugar was D-glucuronic acid (Supplementary Figure S5F). Furthermore, tandem mass spectrometry (Supplementary Figure S6) revealed fragmentation between the glucuronic acid (GlcA) moiety and the aglycone, further corroborating the proposed structure of 6 as glucuronidated PQS (PQS-GlcA).
Inactivation of HHQ/PQS by
Glucuronidation
Since HHQ/PQS are important quorum sensing molecules of the opportunistic pathogen P. aeruginosa, we further investigated the impact of the biotransformation on HHQ/PQS quorum sensing activities. Analysis of the PqsRCBD- NHQ (2-nonyl-4-hydroxyquinoline) complex crystal structure showed that the bicyclic ring of NHQ fits into the deep “B pocket” of PqsRCBD
defined by the residues Leu207, Leu208 and Ile236, while the alkyl side chain of NHQ fits into the “A pocket” with Tyr258 pinning the alkyl chain against Ile186, Val170, Leu189 and Ile236 (Ilangovan et al., 2013). Ilangovan et al. suggested that the binding of HHQ and PQS should orient in a similar way to NHQ due to structural similarities of these quinolone analogs. Modeling of PQS and PQS-GlcA in the PqsRCBDactive site (PDB
- 4JVC) (Ilangovan et al., 2013) revealed computed clusters of PqsRCBD-PQS (cluster 2) and PqsRCBD-PQS-GlcA (cluster 29)
in which the ligands adopted a similar orientation as NHQ in PqsRCBD(Figures 4A,B). As shown in the ribbon diagram,
PQS-GlcA is unable to orient its alkyl chain in the same fashion as PQS. From the hydrophobicity surface representation, the additional stearic bulk of glucuronic acid prevents the bicyclic ring from fully inserting into the “B pocket.” The “FullFitness” values from SwissDock, by averaging 30% of the total energy of the system and the solvation energy of PQS and PQS-GlcA were calculated to be -1161.66 and -1086.10 kcal/mol, respectively, suggesting the PQS-GlcA would have a lower affinity for PqsR. These modeling experiments suggest that PQS glucuronidation would hinder binding of PQS-GlcA to PqsR and may therefore adversely affect the PQS/HHQ quorum sensing system in P. aeruginosa.
To experimentally determine the effect of PQS glucuronidation on binding activity with its innate receptor PqsR, we compared the ability of PQS, HHQ, and PQS-GlcA to activate PqsR controlled gene expression using a previously developed reporter strain, Pseudomonas putida KT2440 [pBBR-pqsR-pqsA’-‘lacZ] (Müller and Fetzner, 2013). In this strain pqsR was constitutively expressed under the control of the lac promoter while the pqsA promoter and a portion of pqsA (−245 to +195 region) was fused in frame to a 5′-truncated
FIGURE 3 | Biotransformation of two quorum sensing molecules of P. aeruginosa. (A) Chemical structures of quinolones PQS-GlcA (6), HHQ, and PQS. Key COSY and HMBC (H→C) correlations for PQS-GlcA are shown. (B) Induction of the metabolite m/z 436.1966 [M+H]+, t
R2.75 min from Streptomyces sp. RKBH-B178
treated with different concentrations of HHQ and PQS, experiments conducted in triplicate. The peak area was calculated from integration of UHPLC-HRESIMS data. Peak areas were standardized using an internal standard (20 µg/mL dioctyl phthalate) added post-extraction to each sample.
lacZ reporter gene. Binding of PQS and HHQ to PqsR facilitates activation of the pqsA promoter and expression of β-galactosidase (LacZ).
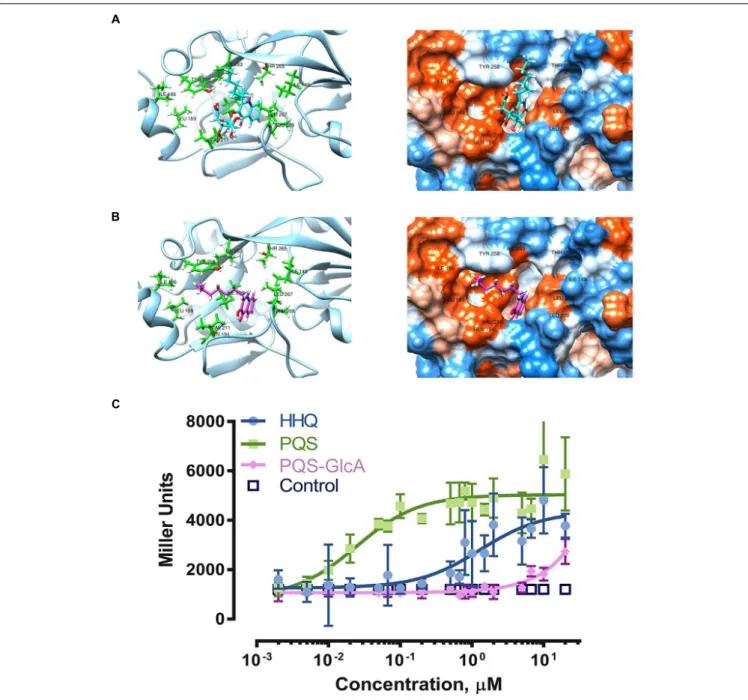
Our results clearly show potent activation of PqsR controlled gene expression by PQS and HHQ (Figure 4C). The EC50 of
PQS was 0.025 µM with 95% confidence interval (CI95) between
0.013 and 0.047 µM, which was 53-fold more potent than HHQ (EC50 1.329 µM, CI95 0.710 – 2.56 µM). These results were
similar to those previously reported using this reporter system (Müller and Fetzner, 2013), although the EC50 of PQS was
six-fold lower in our assay. Overall these results are consistent with previous assessments of PQS and HHQ quorum sensing activity, which have shown that HHQ is less active than PQS (Wade et al., 2005;Xiao et al., 2006). In comparison, PQS-GlcA exhibited minimal quorum sensing activity with an extrapolated EC50 of 1600 ± 8 µM. These results clearly demonstrate that
glycosylation of PQS abolishes its PqsR binding activity.
To assess the generality of the transformation of HHQ to PQS-GlcA by actinomycetes, we cultured 14 additional taxonomically diverse actinomycete strains (Supplementary Table S4) in the presence of HHQ. Interestingly, although oxidation of HHQ was detected in different species, none of these additional 14
actinomycetes biotransformed HHQ to PQS-GlcA (data not shown).
Metabolomic Comparison of Cultures
Treated With Heat-Killed Inducer and
OSMAC Approaches
Streptomyces sp. RKBH-B178 was chosen as the model producer and cultivated in 18 nutritionally diverse media composed of a range of carbon sources (simple and complex), nitrogen sources (inorganic, amino acid, and complex nitrogen sources), phosphate levels and osmolarity as well as ISP2 supplemented with M. smegmatis cell-free broth (CFB) or centrifuged M. smegmatis cells. Hydrazidomycin D was only produced in M. smegmatis cell-supplemented ISP2 medium, not in any other medium.
DISCUSSION
The new bacterial fermentation strategy coupled with metabolomic analysis employed in this study efficiently identified metabolites elicited through exposure of actinomycetes to
FIGURE 4 | Biotransformation and its effects on PQS-PqsR quorum sensing. Molecular docking of PQS-GlcA (A) and PQS (B) with PqsRCBD. Images on the left are
ribbon representations and images on the right are hydrophobicity surface representations. Visualization was in Chimera (Pettersen et al., 2004). (C) Experimental comparison of quorum sensing activities of HHQ, PQS, and PQS-GlcA using the reporter strain Pseudomonas putida KT2440 [pBBR-pqsR-pqsA’-‘lacZ] (Müller and Fetzner, 2013). The results are expressed as mean ± SD (N = 5).
autoclaved cultures of three bacteria and one fungus. A benefit of this approach is that induced metabolites can readily be ascribed to the “producer” actinomycetes, as metabolites originating from “inducers” are electronically filtered out of the dataset. The autoclaved culture as a whole was used in our experiments, whereas previous modified co-culture strategies used only inducer cells by employing an extra step of centrifugation (Luti and Mavituna, 2011;Luti and Yonis, 2013;Wang et al., 2013) or dialysis (Mearns-Spragg et al., 1998). While autoclaving may lead to degradation of some metabolites and cellular components, the
autoclaved inducers were still able to induce metabolic changes in the actinomycetes tested. While we did not exhaustively characterize the effect of autoclaving on all inducer preparations, no major differences were observed between UHPLC-HRESIMS profiles of P. aeruginosa and M. smegmatis extracts pre- and post-autoclaving (Supplementary Figure S4). Using autoclaved inducers rather than filtered or dialyzed culture broths also preserves large cellular components (e.g., cell wall fragments), which may play an important role in triggering metabolic shifts (König et al., 2013; Schroeckh et al., 2009). Since large
quantities of heat-killed inducer can be prepared and stored frozen for several months, inter-experiment variation can be reduced. Furthermore, the use of multiple inducer strains is an effective strategy to increase the diversity of metabolites produced by actinomycetes as we observed distinct patterns of metabolite production in response to different inducer strains. Overall, this fermentation strategy appears to be an effective and reproducible approach to modulating actinomycete secondary metabolism.
A comparison of inducer-producer fermentations with the traditional OSMAC approach using 18 different media was undertaken, and it was determined that only treatment with M. smegmatis resulted in production of 1. The OSMAC approach in this case was ineffective in inducing this new metabolite. Further, M. smegmatis cells and CFB were added separately to Streptomyces sp. RKBH-B178 in ISP2. Only cultures treated with centrifuged M. smegmatis cells were found to produce hydrazidomycin D indicating the apparent requirement for an interaction with a cell surface component and providing evidence that our new strategy of bacterial culture can be an effective route to natural product discovery.
The example of the increased production of hydrazidomycin D (1) demonstrated how the combination of the new culture strategy and high-throughput UHPLC-HRESIMS-based metabolomics enabled expansion of microbial chemical space for natural product discovery. Although 1 was produced in trace amounts under standard cultivation conditions, treatment of Streptomyces sp. RKBH-B178 with autoclaved agar-derived M. smegmatis increased the yield of 1 by 18.7 fold. This level of up-regulation was essential for the isolation and characterization of 1.
Natural products containing N-N single bonds are rare in nature, and therefore, their biosynthesis and biological functions remain unclear. A recent study suggested three enzymes responsible for hydrazine biosynthesis and the encoding genes were commonly found in bacteria (Matsuda et al., 2018). Compounds structurally similar to hydrazidomycin D with nitrogen-nitrogen bonds have been shown to exhibit
antimicrobial and anticancer activities (Supplementary
Table S5). For example, hydrazidomycin A and B had average IC50values of 0.857 and 10.7 µM, respectively against 42 human
tumor cells (Ueberschaar et al., 2011). Geralcin B has a reported IC50 value of 5 µM against MDA231 breast cancer cells (Le Goff et al., 2012), while geralcin C had an IC50value of 0.8 µM
against KB and HCT116 cancer cells (Le Goff et al., 2013). Elaiomycin B and C were weakly active against S. lentus with IC50value of 100 µM for both compounds, but moderate active
against acetylcholinesterase (IC50 value of 1.0 and 2.0 µM,
respectively) and phosphodiesterase (IC50 value of 6.5 and
8.5 µM, respectively) (Helaly et al., 2011; Kim et al., 2011). Hydrazidomycin D, however, was weakly active against MCF7 breast cancer cells (IC50value of 16 µg/mL), and was not active
against CCL81 Vero kidney cells, HTB26 breast cancer cells, or HCT116 colon cancer cells up to 32 µg/mL. We also tested hydrazidomycin D for antimicrobial activity against its inducer M. smegmatis, but it was inactive, suggesting the increased production by hydrazidomycin D is not likely an antagonistic competitive strategy.
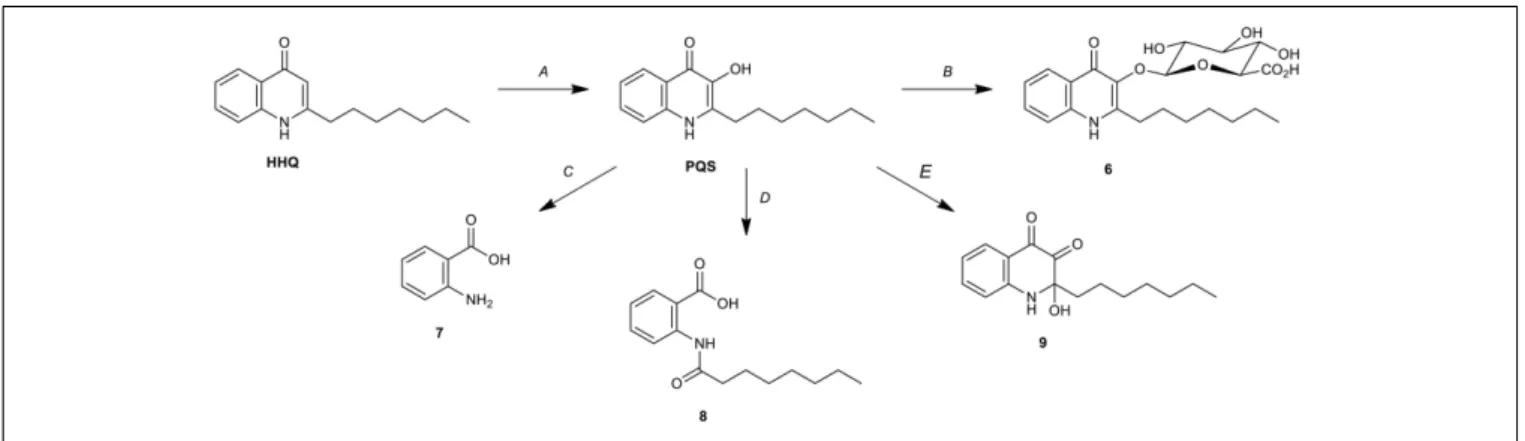
The discovery of PQS-GlcA (6) represents an unprecedented biotransformation of HHQ/PQS by Streptomyces sp. RKBH-B178. Thus, RKBH-B178 is likely to perform a two-step biotransformation to produce PQS-GlcA. Using HHQ as the substrate, the biotransformation requires an oxidation at C-3 of the quinolone ring, followed by glucuronidation of the resulting hydroxyl (Figures 5A,B). There are only three known microbial biotransformation mechanisms which deactivate HHQ/PQS. Rhodococcus sp. BG43 degrades PQS and HHQ to anthranilate (7) (Figure 5C; Muller et al., 2014). In this biotransformation, HHQ is first oxidized to PQS before further modification, which is consistent with the first step of our proposed biotransformation of PQS-GlcA. In a second example, 1-H-3-hydroxy-4-oxoquinaldine-2,4-dioxygenase (Hod), whose natural substrate is 3-hydroxy-2-methyl-4(1H)-quinolone, was shown to oxidize PQS, which is structurally similar to the natural substrate of Hod (Pustelny et al., 2009). Addition of Hod to cultures of P. aeruginosa reduced
FIGURE 5 | Microbial biotransformations of HHQ/PQS. (A) Oxidation of HHQ by P. aeruginosa (PqsH) (Gallagher et al., 2002), Rhodococcus sp. BG43 and Streptomycessp. RKBH-B178. (B) Glucuronidation of PQS by Streptomyces sp. RKBH-B178. (C) Degradation of PQS to anthranilic acid (7) by Rhodococcus sp. BG43 (Muller et al., 2014). (D) Degradation of PQS to N-octanoylanthranilic acid (8) by Arthrobacter nitroguajacolicus strain Rü61a (Hod) (Pustelny et al., 2009). (E) Oxidation of PQS to HHQD (9) by Achromobacter xylosoxidans Q19 (Soh et al., 2015).
the expression of pqsA and related virulent factors, suggesting the oxidized product (8) had only weak quorum sensing activity (Figure 5D; Pustelny et al., 2009). Thirdly, PQS is oxidized to 2-heptyl-2-hydroxy-1,2-dihydroquinoline-3,4-dione (HHQD, 9) by Achromobacter xylosoxidans (Figure 5E;Soh et al., 2015). To the best of our knowledge, biotransformation of HHQ/PQS to PQS-GlcA is just the fourth example of a biotransformation of HHQ/PQS, and the first reported glycosylation of PQS.
Glucuronidation is one of the mechanisms bacteria use to deactivate antibiotics (Wright, 2005), and has been reported in S. lividans (Cundliffe, 1992) and Nocardia species (Morisaki et al., 1993). Of the 14 actinomycetes tested (Supplementary Table S4) for the ability to perform this modification, only RKBH-B178 possessed this trait, suggesting glucuronidation of HHQ/PQS is not common among actinomycetes, although, a larger number of strains would need to be tested to more fully evaluate the distribution. Under the cultivation conditions utilized in this study RKBH-B178 generated 0.4 mg (0.9 µmol) of PQS-GlcA from 2.95 L of culture supplemented with 17.9 mg (73.6 µmol) of HHQ, representing a 1.2% conversion level. This low conversion level may be due to suboptimal culture conditions, resulting in low expression levels of the GlcA transferase or low concentrations of reaction substrates. Alternatively, the low conversion level may indicate that these quinolones are not the natural substrates of the glucuronidating enzyme. Analysis of the RKBH-B178 genome and characterization of glycosyltransferases encoded therein will be required to biochemically characterize the HHQ-glucuronidating enzyme possessed by this strain.
Pseudomonas aeruginosa is a ubiquitous environmental bacterium and opportunistic pathogen (Winstanley et al., 2016). The group behavior of P. aeruginosa is coordinated via a complex quorum sensing network consisting of four components: the las (Gambello and Iglewski, 1991; Jones et al., 1993; Pearson et al., 1994), rhl (Ochsner and Reiser, 1995; Pearson et al., 1995), pqs (Pesci et al., 1999;Cao et al., 2001;Gallagher et al., 2002), and iqs (Lee et al., 2013) systems. The pqs system is an important component of Pseudomonas aeruginosa quorum sensing, contributing to the regulation of biofilm formation and production of virulence factors such as pyocyanin, elastase, rhamnolipids and PA-IL lectin (Diggle et al., 2006). The receptor for PQS is PqsR, a LysR-type transcription regulator that also controls expression of the PQS biosynthetic operon (pqsABCDE) by directly binding to its promoter (Cao et al., 2001). We have demonstrated that Streptomyces sp. RKBH-B178 is able to biotransform HHQ and PQS to a glycosylated derivative that is unable to bind to PqsR and drive gene expression from the PQS operon promoter. It is tempting to speculate that Streptomyces sp. RKBH-B178 uses this biotransformation mechanism to compete with P. aeruginosa or other species utilizing a pqs-based quorum sensing system. Further studies of the interactions between Streptomyces RKBH-B178 and gram-negative bacteria utilizing HHQ/PQS quorum sensing and identification of the glucuronidating enzyme would be needed to elucidate the competitive advantage afforded by biotransformation of HHQ/PQS.
In conclusion, the bacterial culture strategy presented herein is a promising tool to identify chemical signaling between microbes and for natural product discovery. Our screening using seven producers and four inducers demonstrated induction of a range of putatively novel natural products. The strategy enables preparation of large quantities of autoclaved inducer culture stocks which can be used in both small-scale screening and for large-scale production of the target natural product. As two examples of the efficacy of the described bacterial culture approach, this report describes the discovery of a new natural product, hydrazidomycin D, and the identification of the new HHQ/PQS biotransformation product PQS-GlcA representing a new deactivation mechanism of this quorum sensing system.
AUTHOR CONTRIBUTIONS
LL, AS, BH, FB, DM, DO, and RK designed the experiments. LL performed the metabolomics studies. HC operated the UHPLC-HRESIMS instrumentation. LL, AS, and DM performed the purification and structure elucidation. LL and BH performed the molecular docking and beta-glucosidase assays. ND performed the screening of HHQ for general effects in 14 Streptomyces. KM performed the cytotoxicity assays. LL, and ML performed antimicrobial assays. LL, BH, DM, and RK contributed to the final version of the manuscript.
FUNDING
This research was supported through Natural Sciences and Engineering Council of Canada (NSERC), the Canada Research Chair Program, the Atlantic Canada Opportunities Agency, Canada Foundation for Innovation, Nautilus Biosciences Croda, and the Jeanne and Jean-Louis Lévesque Foundation to RK, Innovation PEI Graduate Student Scholarship to LL. Instruments used were supported by the Canada Foundation for Innovation, and University of Prince Edward Island.
ACKNOWLEDGMENTS
We would like to thank Dr. Susanne Fetzner (University of Muenster) for providing the bio-reporter strain to test quorum sensing activities. We would also like to thank Dr. Chris Kirby and Maike Fischer (Agriculture and Agri-Food Canada) for providing NMR services, as well as Dr. Steven Locke (National Research Council Canada) for GC-EIMS services.
SUPPLEMENTARY MATERIAL
The Supplementary Material for this article can be found online at: https://www.frontiersin.org/articles/10.3389/fmicb. 2018.03351/full#supplementary-material
REFERENCES
Abdelmohsen, U. R., Bayer, K., and Hentschel, U. (2014). Diversity, abundance and natural products of marine sponge-associated actinomycetes. Nat. Prod. Rep. 31, 381–399. doi: 10.1039/c3np70111e
Abdelmohsen, U. R., Grkovic, T., Balasubramanian, S., Kamel, M. S., Quinn, R. J., and Hentschel, U. (2015). Elicitation of secondary metabolism in actinomycetes. Biotechnol. Adv. 33, 798–811. doi: 10.1016/j.biotechadv.2015. 06.003
Bertrand, S., Bohni, N., Schnee, S., Schumpp, O., Gindro, K., and Wolfender, J. (2014). Metabolite induction via microorganism co-culture: a potential way to enhance chemical diversity for drug discovery. Biotechnol. Adv. 32, 1180–1204. doi: 10.1016/j.biotechadv.2014.03.001
Bode, H. B., Bethe, B., Hofs, R., and Zeeck, A. (2002). Big effects from small changes: possible ways to explore nature’s chemical diversity. Chembiochem 3, 619–627. doi: 10.1002/1439-7633(20020703)3:7<619::AID-CBIC619> 3.0.CO;2-9
Burgess, J. G., Jordan, E. M., Bregu, M., Mearns-Spragg, A., and Boyd, K. G. (1999). Microbial antagonism: a neglected avenue of natural products research. J. Biotechnol. 70, 27–32. doi: 10.1016/S0168-1656(99)00054-1
Buser, H. R., Arn, H., Guerin, P., and Rauscher, S. (1983). Determination of double bond position in mono-unsaturated acetates by mass spectrometry of dimethyl disulfide adducts. Anal. Chem. 55, 818–822. doi: 10.1021/ac00257a003 Cao, H., Krishnan, G., Goumnerov, B., Tsongalis, J., Tompkins, R., and Rahme,
L. G. (2001). A quorum sensing-associated virulence gene of Pseudomonas aeruginosa encodes a LysR-like transcription regulator with a unique self-regulatory mechanism. Proc. Natl. Acad. Sci. U.S.A. 98, 14613–14618. doi: 10.1073/pnas.251465298
Cueto, M., Jensen, P. R., Kauffman, C., Fenical, W., Lobkovsky, E., and Clardy, J. (2001). Pestalone, a new antibiotic produced by a marine fungus in response to bacterial challenge. J. Nat. Prod. 64, 1444–1446. doi: 10.1021/np0102713 Cundliffe, E. (1992). Glycosylation of macrolide antibiotics in extracts of
Streptomyces lividans. Antimicrob. Agents Chemother. 36, 348–352. doi: 10.1128/AAC.36.2.348
Davies, J. (2006). Where have all the antibiotics gone? Can. J. Infect. Dis. Med. Microbiol. 17, 287–290. doi: 10.1155/2006/707296
Degenkolb, T., Heinze, S., Schlegel, B., Strobel, G., and Grafe, U. (2002). Formation of new lipoaminopeptides, acremostatins A, B, and C, by Co-cultivation of acremonium sp. Tbp-5 and Mycogone rosea DSM 12973. Biosci. Biotechnol. Biochem. 66, 883–886. doi: 10.1271/bbb.66.883
Diggle, S. P., Cornelis, P., Williams, P., and Cámara, M. (2006). REVIEW: 4-Quinolone signaling in Pseudomonas aeruginosa: old molecules, new perspectives. Int. J. Med. Microbiol. 296, 83–91. doi: 10.1016/j.ijmm.2006.01.038 Duncan, K., Haltli, B., Gill, K. A., and Kerr, R. G. (2014). Bioprospecting from marine sediments of New Brunswick, Canada: exploring the relationship between total bacterial diversity and actinobacteria diversity. Mar. Drugs 12, 899–925. doi: 10.3390/md12020899
Forner, D., Berrué, F., Correa, H., Duncan, K., and Kerr, R. G. (2013). Chemical dereplication of marine actinomycetes by liquid chromatography– high resolution mass spectrometry profiling and statistical analysis. Anal. Chim. Acta 805, 70–79. doi: 10.1016/j.aca.2013.10.029
Gallagher, L. A., McKnight, S. L., Kuznetsova, M. S., Pesci, E. C., and Manoil, C. (2002). Functions required for extracellular quinolone signaling by Pseudomonas aeruginosa. J. Bacteriol. 184, 6472–6480. doi: 10.1128/JB.184.23. 6472-6480.2002
Gambello, M. J., and Iglewski, B. H. (1991). Cloning and characterization of the Pseudomonas aeruginosa lasR gene, a transcriptional activator of elastase expression. J. Bacteriol. 173, 3000–3009. doi: 10.1128/jb.173.9.3000-3009.1991
Grosdidier, A., Zoete, V., and Michielin, O. (2011a). Fast docking using the CHARMM force field with EADock DSS. J. Comput. Chem. 32, 2149–2159. doi: 10.1002/jcc.21797
Grosdidier, A., Zoete, V., and Michielin, O. (2011b). SwissDock, a protein-small molecule docking web service based on EADock DSS. Nucleic Acids Res. 39, W270–W277. doi: 10.1093/nar/gkr366
Helaly, S. E., Pesic, A., Fiedler, H., and Süssmuth, R. D. (2011). Elaiomycins B and C: alkylhydrazide antibiotics from Streptomyces sp. BK 190. Org. Lett. 13, 1052–1055. doi: 10.1021/ol1031014
Huang, S., Ding, W., Li, C., and Cox, D. G. (2014). Two new cyclopeptides from the co-culture broth of two marine mangrove fungi and their antifungal activity. Pharmacogn. Mag. 10, 410–414. doi: 10.4103/0973-1296.141781
Ilangovan, A., Fletcher, M., Rampioni, G., Pustelny, C., Rumbaugh, K., Heeb, S., et al. (2013). Structural basis for native agonist and synthetic inhibitor recognition by the Pseudomonas aeruginosa quorum sensing regulator PqsR (MvfR). PLoS Pathog. 9:e1003508. doi: 10.1371/journal.ppat.1003508 JiYoung, C., and MyoungSug, K. (2012). Induction of antifouling diterpene
production by Streptomyces cinnabarinus PK209 in co-culture with marine-derived Alteromonas sp. KNS-16. Biosci. Biotechnol. Biochem. 76, 1849–1854. doi: 10.1271/bbb.120221
Jones, S., Yu, B., Bainton, N. J., Birdsall, M., Bycroft, B. W., Chhabra, S. R., et al. (1993). The lux autoinducer regulates the production of exoenzyme virulence determinants in Erwinia carotovora and Pseudomonas aeruginosa. EMBO J. 12, 2477–2482. doi: 10.1002/j.1460-2075.1993.tb05902.x
Katz, L., and Baltz, R. H. (2016). Natural product discovery: past, present, and future. J. Ind. Microbiol. Biotechnol. 43, 155–176. doi: 10.1007/s10295-015-1723-5
Kieser, T. (2000). Practical Streptomyces Genetics. Colney Ln: John Innes Foundation.
Kim, B., Willbold, S., Kulik, A., Helaly, S. E., Zinecker, H., Wiese, J., et al. (2011). Elaiomycins B and C, novel alkylhydrazides produced by Streptomyces sp. BK 190. J. Antibiot. 64, 595–597. doi: 10.1038/ja.2011.53
König, C. C., Scherlach, K., Schroeckh, V., Horn, F., Nietzsche, S., Brakhage, A. A., et al. (2013). Bacterium induces cryptic meroterpenoid pathway in the pathogenic fungus Aspergillus fumigatus. Chembiochem 14, 938–942. doi: 10.1002/cbic.201300070
Le Goff, G., Martin, M., Iorga, B. I., Adelin, E., Servy, C., Cortial, S., et al. (2013). isolation and characterization of unusual hydrazides from Streptomyces sp. Impact of the cultivation support and extraction procedure. J. Nat. Prod. 76, 142–149. doi: 10.1021/np300527p
Le Goff, G., Martin, M., Servy, C., Cortial, S., Lopes, P., Bialecki, A., et al. (2012). Isolation and characterization of α, β-Unsaturated γ-Lactono-Hydrazides from Streptomyces sp. J. Nat. Prod. 75, 915–919. doi: 10.1021/np300026p
Lee, J., Wu, J., Deng, Y., Wang, J., Wang, C., Wang, J., et al. (2013). A cell-cell communication signal integrates quorum sensing and stress response. Nat. Chem. Biol. 9, 339–343. doi: 10.1038/nchembio.1225
Luti, K. J. K., and Mavituna, F. (2011). Elicitation of Streptomyces coelicolor with dead cells of Bacillus subtilis and Staphylococcus aureus in a bioreactor increases production of undecylprodigiosin. Appl. Microbiol. Biotechnol. 90, 461–466. doi: 10.1007/s00253-010-3032-2
Luti, K. J. K., and Yonis, R. W. (2013). Elicitation of Pseudomonas aeruginosa with live and dead microbial cells enhances phenazine production. Rom. Biotechnol. Lett. 18, 8769–8778.
Marmann, A., Aly, A. H., Lin, W., Wang, B., and Proksch, P. (2014). Co-cultivation–a powerful emerging tool for enhancing the chemical diversity of microorganisms. Mar. Drugs 12, 1043–1065. doi: 10.3390/md12021043 Matsuda, K., Tomita, T., Shin-ya, K., Wakimoto, T., Kuzuyama, T., and
Nishiyama, M. (2018). Discovery of unprecedented hydrazine-forming machinery in bacteria. J. Am. Chem. Soc. 140, 9083–9086. doi: 10.1021/jacs. 8b05354
Mearns-Spragg, A., Bregu, M., Boyd, K. G., and Burgess, J. G. (1998). Cross-species induction and enhancement of antimicrobial activity produced by epibiotic bacteria from marine algae and invertebrates, after exposure to terrestrial bacteria. Lett. Appl. Microbiol. 27, 142–146. doi: 10.1046/j.1472-765X.1998. 00416.x
Morisaki, N., Iwasaki, S., Yazawa, K., MikamiI, Y., and Maeda, A. (1993). Inactivated products of rifampicin by pathogenic Nocardia spp.: structures of glycosylated and phosphorylated metaholites of rifampicin and 3-formylrifamycin SV. J. Antibiot. 46, 1605–1610. doi: 10.7164/antibiotics.46. 1605
Muller, C., Birmes, F. S., Niewerth, H., and Fetzner, S. (2014). Conversion of the Pseudomonas aeruginosa quinolone signal and related alkylhydroxyquinolines by Rhodococcus sp. Strain BG43. Appl. Environ. Microbiol. 80, 7266–7274. doi: 10.1128/AEM.02342-14
Müller, C., and Fetzner, S. (2013). A Pseudomonas putida bioreporter for the detection of enzymes active on 2-alkyl-4 (1H)-quinolone signalling molecules. Appl. Microbiol. Biotechnol. 97, 751–760. doi: 10.1007/s00253-012-4236-4