HAL Id: hal-03120974
https://hal.archives-ouvertes.fr/hal-03120974
Submitted on 26 Jan 2021
HAL is a multi-disciplinary open access
archive for the deposit and dissemination of
sci-entific research documents, whether they are
pub-lished or not. The documents may come from
teaching and research institutions in France or
abroad, or from public or private research centers.
L’archive ouverte pluridisciplinaire HAL, est
destinée au dépôt et à la diffusion de documents
scientifiques de niveau recherche, publiés ou non,
émanant des établissements d’enseignement et de
recherche français ou étrangers, des laboratoires
publics ou privés.
Remote sensing of aerosols over land surfaces from
POLDER-ADEOS-1 polarized measurements
J. Deuzé, F. Bréon, C. Devaux, P. Goloub, M. Herman, B. Lafrance, F.
Maignan, A. Marchand, F. Nadal, G. Perry, et al.
To cite this version:
J. Deuzé, F. Bréon, C. Devaux, P. Goloub, M. Herman, et al.. Remote sensing of aerosols over
land surfaces from POLDER-ADEOS-1 polarized measurements. Journal of Geophysical Research:
Atmospheres, American Geophysical Union, 2001, 106 (D5), pp.4913-4926. �10.1029/2000JD900364�.
�hal-03120974�
JOURNAL OF GEOPHYSICAL RESEARCH, VOL. 106, NO. D5, PAGES 4913-4926, MARCH 16, 2001
Remote sensing of aerosols over land surfaces from
POLDER-ADEOS-1 polarized measurements
J. L. Deuz6, • F. M. Br•on, 2 C. Devaux,
• P. Goloub,
• M. Herman, • B. Lafrance,
3
F. Maignan,
2 A. Marchand,
• F. Nadal,
2 G. Perry,
• and D. Tanr• •
Abstract. The polarization measurements achieved by the POLDER instrument on ADEOS-! are used for the remote sensing of aerosols over land surfaces. The key advantage of using polarized observations is their ability to systematically correct for the
ground
contribution,
whereas
the classical
approach
using
natural
light
fails.
The
estimation of land surface polarizing properties from POLDER has been examined in a
previous
paper.
Here
we consider
how
the
optical
thickness
30
and
,•ngstr6m
exponent
a
of aerosols are derived from the polarized light backscattered by the particles. The inversion scheme is detailed, and illustrative results are presented. Maps of the retrieved
optical
thickness
allow
for detection
of large
aerosol
features,
and in the case
of small
aerosols, the $0 and a retrievals are consistent with correlative ground-basedmeasurements. However, because polarized light stems mainly from small particles, the results are biased for aerosol distributions containing coarser modes of particles. To overcome this limitation, an aerosol index defined as the product AI = •0a is proposed. Theoretical analysis and comparison with ground-based measurements suggest that AI is
approximately
the same
when using •0, and a is related
to the entire aerosol
size
distribution or derived from the polarized light originating from the small polarizingparticles
alone.
This invariance
is specially
assessed
by testing
the continuity
of AI across
coastlines, given the unbiased properties of aerosol retrieval over ocean. Although
reducing the information concerning the aerosols, this single parameter allows a link
between the POLDER aerosol surveys over land and ocean. POLDER aerosol index
global maps enable the monitoring of major aerosol sources over continental areas.
1. Introduction
Recognition of the climatic influence of aerosols [Hansen and Lacis, 1990; Charlson et al., 1992] has led to large efforts for improving their global monitoring by satellite. Over the ocean, where the aerosol remote sensing is tractable from measurements at near-infrared wavelengths, aerosol surveys using satellite imagery have been conducted from decades [Fraser, !976; Quentzel and Koepke, 1984; Rao et al., 1989; Nakafirna and Higurashi, 1998]. Presently, aerosol maps are derived routinely from NOAA/AVHRR data [Stowe et al., 1992; Husar et al., 1997], and improved characterization of the aerosols is or should be derived from new remote sensing instruments like OCTS (Ocean Color Temperature Scanner)
[Nakajirna et al., 1999]; SeaWiFS (Sea-viewing Wide Field-of-
view Sensor) [Gordon and Wang, !994], POLDER (Polariza- tion and Directionality of Earth's Reflectances) [Deuz• et al.,
1999], MISR (Multiangle Imaging Spectroradiometer) [Kahn
et at., 1998], or MODIS (Moderate-Resolution Imaging Spec- troradiometer) [Tanrd et al., 1997].
By contrast, the aerosol remote sensing over land surfaces,
q. aboratoire d'Optique Atmosph6rique, Universit6 de Lille, Ville- neuve d'Ascq, France.
:Laboratoire des Sciences du Climat et de l'Environnement, Gif sur Yvette, France.
3Centre
National
d'Etudes
Spatiales,
Toulouse,
France.
Copyright 2001 by the American Geophysical Union.
Paper number 2000JD900364.
0! 48-0227/01/2000JD900364509.00
where the main aerosol sources are located, is much less ad-
vanced because of the difficulty in discriminating the aerosol contribution from the ground in top of the atmosphere (TOA) measurements. This problem has been approached in several different ways, for example, from the reflectance of dark tar- gets [Kaufman and Sendra, 1988], the adjacency effect of the aerosols [Kaufman and Joseph, 1982; Tanr• et al., 1988], or their effect on the apparent temperature of desertic areas [Legrand et ai., 1988]. Recently, first monitoring of UV- absorbing aerosols, both over land and ocean, has been achieved by using the ultraviolet measurements of TOMS/ Nimbus 7 [Herman et al., 1997; Torres et al., I998]. Here again, the new generation of remote sensing instruments should im- prove the characterization of the aerosols from dark dense vegetation reflectance [Kaufman et al., 1997a, 1997b], mul- tiangle imagery [Marton&ik, 1997] or polarization measure- ments [Herman et al., 1997]. Here we examine the capacity of directional polarization measurements, using the 8 month data acquired by POLDER aboard ADEOS-1. The remote sensing of aerosols is based on the polarized light that they backscatter and the expectation that any correction in TOA measurements of the polarized light reflected by surfaces should be more tractable than the correction of the total reflected light.
The wide field-of-view imaging spectroradiometer POLDER, on ADEOS-1 from November !996 to the end of ADEOS on June 1997, offered multispectral, multidirectional,
and polarized measurements of the Earth's reflectances. The
wide field-of-view optics and the matrix array detector of POLDER provide bidimensional pictures of the Earth's sur- face which allow daily observations with a resolution of 6 km x 4913
4914 DEUZE ET AL.: AEROSOLS OVER LAND WITH POLDER 0,4 ' i ! i i 'l ' ' ' •' -'-+-- Hapex ./ '"., : Maidives : " •',•%".• ... LaCrau : ß - •,=850 nm , , ] [ [ I [ i I 0,3 0,2 0,1 o -0,1 -- 0 45 90 135 180 scattering angle (ø)
Figure 1. In situ measurements of the polarized phase func- tions qa(©) for different kinds of aerosols as a function of the scattering angle ©; q,,(©) is derived from ground-based mea- surements of the polarized skylight at wavelength X = 865 nm [Vermeulen et al., 2000]. Results are shown for desertic dusts (Hapex campaign, Maidives), aerosols from the Indian conti-
nent (Indoex campaign), and urban-industrial aerosols (La
Crau campaign).
7 km, from 13 different viewing geometries during the same orbit. A rotating filter wheel provides radiance measurements in nine channels ranging from 443 to 910 nm. Moreover, the
channels centered at 443, 670, and 865 nm are equipped with
polaroids, therefore permitting measurements of the polariza- tion [Deschamps et al., 1994].
The aerosol retrieval from these measurements is detailed in
section 2. The polarized light scattered by the aerosols is firstly estimated by correcting the molecular and surface influences, which requires modeling of the POLDER measurements and surface bidirectional polarization distribution function (BPDF). By processing multitemporal series of POLDER data, NadaI and Brgon [1999] have developed BPDF models of
the land surfaces which have been entered in the inversion
scheme in order to derive the aerosol contribution. Presently, the 443 nm data are not used. At this wavelength the molecular contribution dominates largely the measurements, so because of the uncertainty in the calibration factor of the blue channel, there is very little accuracy in the remaining aerosol contribu- tion to use in an aerosol inversion scheme. Finally, comparison of the aerosol polarization measurements in the 670 and 865 nm channels along with calculations for a set of aerosol models provides the optical thickness of the particles $o at Xo = 865 nm
and
their
,•ngstr6m
exponent
c•
between
wavelengths
Xo
= 865
nm and X• = 670 nm such that 8• = $o(X•/Xo)-% where 81 is the optical thickness at
The applicability of the method is examined in section 3, and examples of level 2 aerosol products, a and 8o, over land are shown. Some large aerosol features are recognizable in daily maps of the retrieved optical thickness. Section 4 presents comparisons of the POLDER results with correlative ground- based measurements. The retrieved parameters a and 8o are significant in the case of small aerosols, such as in biomass burning events, but are generally biased. Because polarized light is mainly sensitive to scattering by small particles and cannot detect coarser modes of aerosols, a and 8 o are probably related to the smaller mode of particles, leading to an overes-
timation
of the .&ngstr6m
exponent
and
an underestimation
of
the optical thickness in the case of bimodal size distribution of the particles. l[n a first approach it is proposed, in section 5, to combine the parameters a and 3o into a simple aerosol index,
AI = a8o, which should be approximately the same when
calculated
either
with
the biased
parameters
derived
from
po.
larization or with those corresponding to the whole size distil. bution. This aerosol index makes it possible to link the two different aerosol surveys performed by POLDER over lan, d and over the ocean, and global maps of AI provide a new monitoring opportunity of major aerosol sources over conti. nental areas, including desertic particles.
2. Aerosol Retrieval From Polarized Light
2.1. Scheme of Aerosol Retrieval
The principle
of the method
has
been
discussed
previously
[Herman et al., 1997]. Ground-based measurements suggestthat the polarized light reflected by ground targets is small and stable enough to allow for correction in TOA measurements, and we assume that these surface BPDFs have been deter. mined. Then, the POLDER data can provide the polarized light scattered by the aerosols at several wavelengths X, and for
several scattering angles ©, this is about 8,•q,,(©), where 8• is the optical thickness of the aerosols and q,•(©) is their polar.
ized phase function; that is,
q.(O) =p.(O)P.(o),
where p,(©) is the phase function and P,•(©) is the polariza- tion ratio for single scattering of the aerosols. The derivation of 8,•qa(©) from the measurements is detailed in section 2.2. We examine here how the aerosol retrieval may be achieved from
$aq,(O), instead of 8op,•(©), used in the classical approach
of total radiance measurements.
The inversion seems more delicate because the polarized
phase function q,(©) is more versatile than the normalized phase function p,•(©). Ground-based measurements, how- ever, suggest that at near-infrared wavelengths (X = 850 nm to X = 1650 nm), q,(O) is reasonably defined for many terrestrial
aerosols [Vermeulen et al., 2000]. Figure 1 shows examples 01
q, (©) functions measured from the ground for different kinds
of aerosols. Most aerosols exhibit rather stable polarized phase
functions, except desertic particles whose polarization is typi- cally 5-10 times lower. POLDER measurements now taken
over the ocean will enable estimations of q, (©) for a broader class of terrestrial aerosols. The present scheme is based on
monomodal aerosol models whose polarization exhibits similar
behavior to that of the data set in Figure 1. Lognormal size distributions have been retained (see section 2.3), with a fixed
value for the standard deviation rr, and several values of the modal radius ?, and refractive index m, of the aerosols. Figure
2 shows examples of the resulting polarized phase functions, for m = 1.40. They are in reasonable agreement with the
observations.
To select the best model from the measurements, one may
look at the directional behavior of q,•(©) within the different viewing directions of POLDER, or/and to the spectral behav- ior of $,q, (©) in the three polarized channels. The interval of scattering angles varies from a few degrees to more than 8fF
depending on the target latitude and localization within the
POLDER
swath
[Br•on
et al., 1997].
As explained
previously,
the present results are obtained by using only the 670 and 865 nm data. In these conditions, Figures 3 and 4 show that re- trieval of the aerosol model is rather delicate.For a few
models,
Figure
3 shows
how
q•(©)/•(100
ø)
DEUZE ET AL: AEROSOLS OVER LAND WITH POLDER 4915
exponent
(or particle
mean
dimension)
at Xo
- 865
nm.
Except
for large particles, which exhibit characteristic polarization fea-tures in backscattering directions, the expected directional ef- fects are quite small. Practically, for a larger than 1.35, the
q,(©) functions in Figure 3 differ only by a multiplicative
factor.
On the other hand, for the same aerosol models, Figure 4 shows how the polarized light varies as a function of the ob- servation wavelength. The spectral dependance of the polar- ized light is estimated here by
X(X) = &,,(X)q•(X, ©0)/&•(X0)q,(X0, ©0), (2)
with Oo = 100 ø and Xo = 850 nm. The spectral information is much more reliable than the directional one, although restrict- ing to channels at 670 and 865 nm limits the sensitivity of the
method.
2.2. Modeling of the Measurements
We consider cloud-free POLDER pixels, selected according to the cloud-screening algorithm of Br•on and Colzy [1999].
Preliminary correction of the influences of the gaseous absorp-
tion [HagoNe et al., 1999; Vesperini et al., 1999] and of the stratospheric aerosol contribution [Lafrance and Herman, 1998] is performed. To reduce the noise level, the aerosol algorithm is applied to 3 x 3 POLDER pixels (i.e., about 20 km x 20 km areas). Moreover, viewing directions correspond- ing to specular reflection within 3 ø are eliminated in order to avoid contamination by the Sun glint from subpixel water sur- faces (e.g., lakes, bogs).
The partially polarized light at TOA is assumed to be lin- early polarized, and the three measurements performed in a POLDER-polarized channel are converted [Hagolle et al., 1996] into the Stokes parameters (Io, Qo, Uo) with
Io = L, Qo = Lp cos (200), U0 = Lp sin (2½0), (3)
where L and Lp are the normalized radiance and polarized
radiance;
that is, L(Lp) = m-L*(L})/E where
E is the solar
irradiance
at TOA and L*(L•) is the radiance
(polarized
radiance). Here the Stokes parameters are referred to axes linked to the meridian plane, which contains the viewing di- rection; hence in (3), q•o is the angle between the polarization direction and the meridian plane (-,r/2 < q•0 < +r r/2). The accuracy of the polarization measurements has been controlled
by using observations of the Sun glint over the ocean [Toubbd
014, , , , i .... i ,i, 0,3
'• 0,2
.• 0,1
0
0 45 9o 135 180 scattering angle (ø)Figure
2. Examples
of the polarized
phase
functions
qa(©)
at X = 865 nm for the monomodal models used in the inversionscheme,
according
to the corresponding
modal
radius
• or the
corresponding
•gstr6m exponent
a. The assumed
refractive
index of the particles is m = 1.40.• (z=1.70 = (z=1.35 --o-- (z=1.00 = (z=0.60
I.I ill III. II. I.
8 o
'o
(D -2I •
(z=1.70
.N I : (Z=I .35I
.oo
m=l .40
'• -3I ' (z=0.60
-4 ... I,• I • I , I ,, 3 . t" I ] I ' I [ I ' 'l ' ! a [ [ !' '[ a.•
2
C
• 1 e 0 • -1• -3
-4•
• • I;
90 120 150 180Scattering angle (o)
Figure 3. (a) Directional dependence of the polarized light. Behavior of q,•(©)/q,,(100 ø) as a function of © for mono- modal models with refractive index m = 1.33. Large particles exhibit characteristic polarization features but for small parti- cles (a > 1.35) no information on • and m (see Figures 3b and 3c), hence on q,•(©), can be derived from the angular depen- dence of polarized light. (b) Same as Figure 3a but for particle refractive index m = 1.40. (c) Same as Figure 3a but for particle refractive index m = 1.50.
et al., !999] and is estimated at approximately _+2% polariza- tion [HagoNe et al., 1999].
Given the uncertainties, the measurements are modeled in a
simplified way by considering only the polarized light corre- sponding to single scattering by aerosols, single scattering by molecules, and direct reflection on the surface. Because pri- mary scattering largely dominates the polarized light, this ap- proximation is sufficient to take into account most of the po- larized light in channels centered at 670 and 865 nm, where molecular scattering is small, and for aerosol optical thickness smaller than about 0.25 iBrdon et al., 1997; Lafrance, 1997]. Single scattering by molecules or disordered particles gives polarized light perpendicular or parallel to the scattering plane, which contains the solar and viewing directions. Simi- larly, BPDFs are modeled by assuming that the polarized light comes from specular reflection on surface elements, whose normal bisects the solar and viewing directions. The resulting polarization therefore is perpendicular to the scattering plane
4916 DEUZE ET AL.: AEROSOLS OVER LAND WITH POLDER 2,5 1,5 0,5 1,5 0,5 o 2,5 1,5 1 0,5
(a)
I
I = (•=1.35 I I-O--=1.OOl I = ,! iiii ii ii i ill | i i i i i , i i i i i i i i i i i b •(•=1.70, i','"', i , I• •"'i i , , , , i , , , , i i , , ,,, ... ,,,,
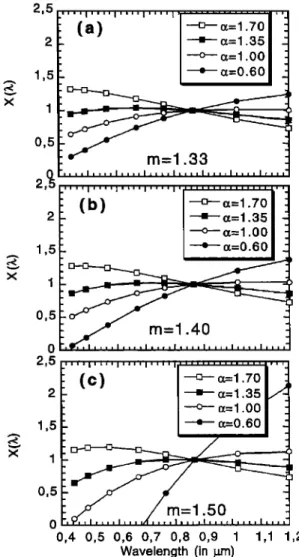
= (z=1.35 --o-- (z=1.00 I = I -] o 0,4 0,5 0,6 0,7 0,8 0,9 1 1,1 1,2 Wavelength (in l•m)
Figure 4. (a) Spectral dependence of the polarized light. Be-
havior
of (•5,,q,,)x/(•5,•q,,)xo
as a function
of X for the mono-
modal models of Figure 3a. The scattering angle is fixed (© = 100 ø) and Xo = 850 nm. The spectral behavior of polarized light is linked mainly to the behavior of •_x/•5,, x and allows the . , 0
retrieval
of the
particle
dimension
or •r•gstr6m
exponent.
(b)
Same as Figure 4a but for particle refractive index rn = !.40. (c) Same as Figure 4a but for particle refractive index m =
1.50.
also. Thus by considering the Stokes parameters with reference to axes perpendicular and parallel to the scattering plane (i.e., with • - 0 or •r/2 for the angle between the polarization direction and the normal to the scattering plane), each polar-
ized term reduces into its • parameter, • = L•, cos (2•b) -- __L•,, with
Qa =/•,q,(O)l(4 cos 0•,), (4a) Qm = &r•(z)q,•(©)/(4 COS 0•), (4b)
Qg = L•(D.), (4c) where O•,(Os) is the zenith viewing (solar) angle, and D. is the
Sun incident angle on the surface element (i.e., (z- - 0)/2); the molecular polarized phase function qm(O) is positive, while the aerosol-polarized phase function qa(O) may be positive or
negative for polarization direction, respectively, perpendicular or parallel to the scattering plane; the BPDF modeling gives
L•, positive;
note
that
the
molecular
optical
thickness
8m(Z)
is
scaled according to the altitude of the target. Finally, the po-
larized radiance at TOA, referred to this way, is written as
Qcal
= Qm
+ e-M•m(Qa
+ e-Ml•"Qg),
(5)
where M is the air mass factor, and the exponential transmis. sion terms account for the screening effects of the upper mo- lecular layer and aerosol layer on the polarized light from lower layers;/• accounts for the large forward scattering of the aerosols, a property that reduces their screening effect on the polarized light from the ground [Br•on et al., 1995; Lafrance, 1997]. Far typical surface BPDFs and aerosol models, simula- tions of the TOA-polarized radiance have been performed with vertical mixing of the molecules and aerosols. The aerosol and molecular densities were given exponential profiles with scale heights of 2 and 8 km, respectively. The results show that with • •- 0.50, (5) is accurate within about 0.0001 at 865 nm and 0.0002 at 670 nm for aerosol optical thickness smaller than 0.25 and viewing angles smaller than 60 ø [Lafrance, 1997]. The accuracy of (5) decreases for larger aerosol optical thicknesses.
On the other hand, given (Q o, Uo) and the observation geometry, the angle •m• between the observed polarization direction and the normal to the scattering plane is evaluated. Of course, because of the multiple scattering, scattering/ reflection processes, and measurement errors, ½trn• • is not exactly zero or •r/2. Numerical simulations, however, show that for the 865 and 670 nm wavelengths, q•n• should depart significantly from zero or •'/2 only when the polarized light is nearly null. To be consistent with the simplified modeling,
given /',mess = ,•/,Q•) + U• and 1/Jmeas , the measured Stokes
parameters with reference to the scattering plane are approx- imated into the forrn
Qmeas-
• x/Q•
meas
q-
s• •rneas
rneas
= q-1
= -1 for
for
ICmeas
< 45ø
> 45
ø' (6)
Finally, given Lea and the known molecular term, the aerosol
parameters are derived from
8mqrn
( 8aqa
Q
meas
= 4 cos
0-•---•
+ e-M•Sm
•
4 cos 0•q-
e
. (7)
2.3. Aerosol Inversion
Crude modelings only of surface BPDFs were known before the POLDER launch [Vanderbilt et al., 1990; Rondeaux and Herman, 1991; Br•on et al., 1995]. From a preliminary analysis
of time series measurements of the polarized radiance in the 865 nm POLDER channel, Nadal and Br•on [1999] have de-
veloped improved BPDF models with L•, in the form L• = a0 cos 0•{1 - exp [/30Rp(12)/(cos 0• + cos 0•,)]}, (8)
where
Rp(I•) is the Fresnel
reflection
coefficient
for polarized
light, calculated for a refractive index of m = 1.50; ao and/30
are empirical coefficients adjusted for the different classes of
land surface according to the main International Geosphere-
Biosphere Programme (IGBP) biotypes and the normalized difference vegetation index (NDVI) [Nadal and Brdon, 1999],
Equation
(8) gives
values
of L•, similar
to those
of the
expected
polarized radiance scattered by the aerosols, which explai•
why remote sensing of aerosols in polarized light should be
feasible. We assume that the polarized light reflected by sur-
faces is independent on the wavelength [Vanderbilt et at., 1990; Rondeaux and Herman, 1991; Brdon et al., 1995], and so the
DEUZE ET AL.: AEROSOLS OVER LAND WITH POLDER 49 i7
The aerosol modeling consists of tabulations of the qa(X,
0) functions
and
scattering
coefficient
Sa
(X) of the
aerosols
at
670 and 865 nm. We consider spherical nonabsorbing particles with monomodal size distributions in the form
dN(r)
d!nr-•exp -•
1 [ 1
(lnr-ln•)2]
cr
.
(9)
Following Shettle and Fenn [1979], a value of 0.864 is used for o'. Three values of the aerosol real refractive index are consid-
ered, m = 1.33, 1.40, and 1.50, because of possible different behaviors of q,(O) in backscattering directions depending on
m (see Figure 3). For each value of m, 12 values of • are
adjusted
to provide
•ngstr6m
exponents
ranging
from
0.30
to
2.50.
Given the 2N (two wavelengths, N-viewing directions) mea- surements, for each aerosol model the error *1,
ß
/=
Z Z [Qcal(
h.,
Oj)- Qmeas(•.,
Oj)]
2, (10)
•.0,M j
is minimized by adjusting $o- The retrieved aerosol parameters
are
the •mgstr6m
exponent
rr and
optical
thickness
$o
corre-
sponding to the model which gives the smallest residual errorft. Examination of the measurements shows that we never observe the large polarization features corresponding to the rainbow of large particles, in Figures 2 and 3, which could provide valuable information on the particle refractive index. Therefore the refractive index corresponding to the selected model is not expected to be significant and will not be exam-
ined.
3. Results
3.1. Preliminary Qualitative Results
The ability to control the land surface contribution from satellite is a key point of the method. A qualitative illustration of this problem is shown in Plate 1. For each ground pixel of a large geographic area, pictures A and B display the maximum and minimum values of the polarized radiance measured in the 865 nm channel times cos 0•,, in the viewing direction corre- sponding to a constant scattering angle, t9 = 120 ø, over a 30 day period. The measurements are corrected from the molec- ular term according to (4b). By selecting a constant ©, thus a
constant 12, variations of the surface BPDF should be mini-
mized. The 120 ø scattering angle provides a good repetition of the measurements at the considered latitudes and is far enough from the cloud rainbow direction (about 140 ø) [Goloub et al., 1994] to prevent contamination of the polarized light by resid- ual liquid clouds.
The noiseless behaviors of the pictures give confidence in the results, and the mean levels are consistent with the ex- pected orders of magnitude. In picture A, with $a • 4 cos
O•Lp/qa(120 ø) and q,•(120 ø) = 0.06 to 0.12 according to
Figure
1, the
maximum
values
cos
O•J•p
•- 0.0175
correspond
to a rS, • 0.35 to 0.70. In picture B, minimum values ranging
from
cos
0d-.v
•- 0.002 to 0.006
are consistent
with
previous
ground-based measurements of vegetation and bare soil polar-
izations [Vanderbilt et al., 1990; Rondeaux and Herman, 1991; Br•on et al., 1995], and show that !and surface polarization is
generally no larger than aerosol polarization. Moreover, the smoothness of the rninimum picture confirms that land surface
polarization
exhibits
lower
spatial
variability
than
land
surface
reflectance, hence making the correction of the measurements easier.
On the other hand, comparison of pictures A and B shows that very clear conditions probably never prevail over polluted areas like China or the Ganga basin, therefore preventing the estimation of the surface polarization by a simple minimum technique. The applicability of the method clearly needs some general modeling of the land surface BPDF according to the land surface geotype, as achieved by Nadal and Brgon [1999].
Another qualitative example is provided by (Plate 1, bottom) composites of POLDER pictures acquired over occidental South Africa on June 4 and 23, 1997, at the very beginning and at the height of the biomass burning activity, respectively, as confirmed by the ATSR-2 fire products [Goloub and Arino, 2000].
The viewing direction selected for each pixel corresponds again to a constant scattering angle (here 19 = 110ø). More-
over, the two orbits differ from a few POLDER subcycles
(about 4 days), so the viewing geometries and thus the surface contribution should be nearly the same in the two pictures. For each day, images B and P display in true color the radiances and polarized radiances measured in the three channels. Be- cause of the importance of the molecular polarization at 443
nm, the molecular contribution has been subtracted from the
polarization data. Clearly, from June 4 to 23, the large increase of the extended plume of biomass burning aerosols is more discernible in the polarized radiance picture than in the radi- ance one. Note that the yellow color of the polarized picture is quite a persistent feature, which shows that most aerosols scatter less polarized light at short wavelengths.
3.2. Level 2 Aerosol Products
Let us first illustrate the algorithm functioning on typical measurements. Figure 5 shows the case of a pixel in the Ganga valley, near New Delhi. Rather than level 1 data (Qo, Uo), Figure 5 displays the polarization angle and polarized radiance
(qJ,
Lp) as a function
of the scattering
angle.
Figure
5a con-
firms that the polarization direction, as expected, is nearly orthogonal to the scattering plane except in backscattering directions where the polarized light becomes very small. In these directions the aerosol single-scattering contribution van- ishes and multiple-scattering processes result in more involved polarization behavior. In the present case, the aerosols exhibit probably negative polarization (parallel to the scattering plane) in a small angular range near © = 170 ø, but analysis of such effects is out the scope of our simplified modeling. Fig- ures 5b and 5c show the polarized radiances. Different labels
{/.meas ¾,Q• 2 r- 2
indicate
the raw measurements
,-v
=
'
Uo), the
molecular contribution (I.m ,_p = Q,,), the measurements cor-
rected
from
the molecular
effect
((L• TM - L.;')e•'•), the
surface
contribution
(Lpa),
and the retrieved
signal
(IQ•l),
respectively. The retrieved optical thickness here is •o = 0.44,with a = 1.38. Over this highly polluted pixel the aerosol contribution is well above the molecular and ground contribu- tions, and the inversion scheme allows a correct fit of the
measurements.
Examples of global results derived in this way are shown in Plate 2 as maps of the retrieved aerosol optical thickness (pic-
tures
iA and
MA) and
•ngstr6m
exponent
(pictures
iB and
MB). Pictures iA to iC (Plate 3) are for measurements over the whole Indian subcontinent on November 14, 1996 (two con- secutive orbits), and pictures MA to MC are for measurements over Mexico on May 27, 1997. For comparison, the results
4918 DEUZE ET AL.: AEROSOLS OVER LAND WITH POLDER
c' .4n
f
•
ø •, X=865nm
Meas. I
'%3
o
- - -•- % t=865nm
Aer.+Surf.
•
a. .... 865nm•
•, 0,03 o; 0,025 • 0,02 .... • 0,015 • 001 N ': 0 005 o a_ 0 -0,005 0,035 •,, 0,03 • 0,025 ,.. N O ß Meas.( b )
-- +
- - Uol.
- __o __ Aer.+Surf. .- , --•--Surf. ,'N. Retr.:
nm
. - . 0,02 0,015 0,01 0,005 0 -0,005 80 100 120 140 160 180 Scattering angle (ø)Figure 5, POLDER observations over a pixel in the Ganga basin, near New Delhi. (a) Measurements and calculations of the angle between the polarization direction and the perpen- dicular to the scattering plane, •, as a function of the scattering angie corresponding to the viewing direction. Solid circles and open circles: measurements at 670 and 865 nm, respectively.
Solid and dashed curves: calculations at 670 and 865 nm, re-
spectively. The polarized vibration is perpendicular to the scat-
tering plane, except in backward directions where multiple scattering and/or changes in the aerosol polarization direction
make the polarization behavior more complex. (b) As Figure 5a but for polarized light at wavelength X = 865 nm. Measure-
ments (solid circles) compare well with calculations for the
retrieved aerosol model (solid line). The surface and molecular contributions are indicated. (c) As Figure 5b but for wave- length X = 670 nm.
obtained over the ocean in a very different way [Deuz• et al.,
1999]
are reported
also.
As these
last
results
are derived
from
more confident radiance data and compare well with correla-
tive ground-based
measurements
[Goloub
e! al., 1999],
com-
parison
allows
an indirect
validation
of the land
products.
The global distribution of the aerosol optical thickness over land is not unrealistic. In pictures iA to iC (Plate 3), for ex-
ample,
the known
pollution
prevailing
within
the Ganga
basin
contrasts with lower loading over the main Indian continent,
and the orders of magnitude of/50 and a are reasonable. In
pictures
MA to MC the
large
aerosol
loading
of small
particles
with large
•ngstr6m
exponents
is consistent
with biomass
burning activity in this region in May. However, while the results obtained over land and over the ocean are rather con. sistent in pictures MA to MC, they differ markedly in picturesiA to iC. Such a discrepancy between the results of the two
processing lines over coastlines is a common feature of similar comparisons. The exception is when the results over the ocean
indicate
very
small
particles
with
a high
,3mgstr6m
exponent.
Generally, the inversion scheme over land underestimates the
optical
thickness,
while
it overestimates
the
•mgstr6m
exp0.
nent, which suggests some systematic bias in the aerosol prod.
ucts over lands.
4. Comparison With Ground-Based
MeasurementsThe reliability of the results has been assessed more directly from comparison with direct measurements of •5 o and a achieved by ground-based Sun photometers. Data obtained during the POLDER overpass, with clear-sky conditions ac- cording to the POLDER cloud mask, have been selected in the data bank of AERONET (Aerosol Robotic Network) [Holben et al., 1998] or provided independently by T. Nakajima, R.
Santer, and V. Souffiet. Table 1 lists the stations where these
correlative measurements were performed. Note that a lot of the data concerns desertic sites.
The methodology of the comparison is explained by Goloub et al. [1999]. Filtering of the Sun photometer data was per- formed in order to select measurements (1) simultaneous to the satellite overpass within half an hour, (2) corresponding to stable atmospheric conditions, (3) specially controlled to pre- vent undetected subpixel clouds, and (4) with a large enough aerosol content; only observations with •5o > 0.05 were re- tained. The POLDER results are averaged over a 100 x 100 km 2 area around the ground station (average of 5 x 5 boxes of 3 x 3 pixels each).
The comparison between the POLDER and the Sun pho- tometer results is shown in Figures 6a and 6b, respectively, for a and •o. Both results are extremely noisy, as seen also in Plate 2 when comparing the very different qualities of the products over the land and over the ocean. This is not too surprising.
The uncertainty on the surface contribution, typically/XL• =
0.001 to 0.002 according to Nadal and Brdon [1999] is notice- able compared with the aerosol contribution, generally about
L•, -• 0.010.
However,
the outstanding
feature
in Figures
6a
and 6b is the systematic bias in the a and $o retrievals, which confirms the previous results over coastlines. In most cases theretrieved
•ngstr6m
exponent
is overestimated,
while
cotrela-
tively,
the aerosol
optical
thickness
is underestimated.
For all
measurements, Figure 6c shows how the optical thickness ratio •VOLD•R/•SU•PI•. varies as a function of a. The linear fit is o • oindicated. The aerosol optical thickness derived from
POLDER is largely
underestimated
for large aerosols
and
tends
progressively
toward
consistent
figures
for very small
aerosols, as outlined previously.
5. Discussion: Aerosol Index
5.1. Biases of Results and Bimodality of Aerosols
Let us focus
on the polarized
light scattered
in side-
scattering directions, in the range 80 ø < © < !20 ø wherepolarization
is large
(see
Figure
5). Polarization
features
like
the rainbow should deserve a specific study. In side-scatteringDEUZE ET AL.: AEROSOLS OVER LAND WITH POLDER 4919
Maximum Minimum
cos
0Lp=0.00
cos
O,,Lp=O
02
June 04-R June 04-P
June 23-R June 23-P
Plate 1. (top) (maximum and minimum): For each ground pixel of the area, the images displa) the maxi-
mum
and
minimum
xaluc,
lcspcctivcly,
of co.,,
O,Lp
observed
over
a I month
period
x•ith
cloudless
conditions.
To minimize variations in surface reflection and aerosol-polarized phase function, the data correspond to a
viewing direction providing a constant scattering angle ({0 = 120ø). Qualitativel), the image• are expected to display the land surface and the laroest aerosol contributions in polarized li,,ht Minimum image confirms that
the land surface contribution does not exhibit large spatial xariabilit), and comparison ,• ith maximum image shows that the aerosol contribution ma3 bc well above the surface contribution. (bottom) True color com-
posites (443 nm, blue; 670 nm, green; 865 nm, red) of POLDER pictures over occidental South Africa, on June 4, 1997 and June 23, 1997, for radiance (R) and polarized radiance (P); polarized radiances arc corrected lbr molecular scattering. The large plume of biomass burning aerosol.,,, x•hich appears on June 23, is more
db, cernible in polarized light.
directions it is well knov•n that the polarizing efficiency of scattering increa.,,es when the particle dimension decreases
[ttamtn and Trm'i•, 1974], so polarization mca.,,urcmcnt.,, allow detection of only the smaller particles '•ithin the aerosol size
distribution. Therefore the. bia• in the optical thickness re-
tricxal indicates that the implicit relationship bemeen large rampolarizing and small polarizing particles entailed bv our aerosol modeling is x•rong. l•o simple po•ibilitie• can bc examined in a first approach. An ob•iou.,, explanation i• that SOlriO p:trticlc.,,, because they are nonspherical, proxide less
4920 DEU7E ET AL.' AEROSOLS OVER I_AND WITH POLDER
India, Nov. 14, 1996
8 o=0.5 as=O.O
a=2.0 at• 0=0.0
IA-Optical thickness
IB-Jtngstr6m
exponent
a8o
=0.5
IC-Aerosol indexMexico, May 27, 1997
60=0.0
6o=0.5 oc
=0.0
a=2.0
'
ß
•:
-• .:"- .
. . i>'},•,
,.
.
A • , ' , U•' .'q".,• F x'-"-"
'
'-
!%',
•-Optic• •ic•ess
•-•ngs=6m exponent
a60 =0.0
ß
a8o=0.5
MC-Aerosol index
Plate 2. (,top) (IA to IC)' Aerosol parameters derived from POLDER. Comparison between the results over land derived from polarized light (present paper), x•ith the more confident results over ocean derived mainly from total light [Deuz• et al., 2000]. The observed area is over India; POLDER orbits 316l and 3162, on November 14, 1996. For each cloud-free pixel, image iA displays the retrieved optical thickness 8o, image iB,
the retrieved
•ngstrOm
exponent
a, and
image
iC, the product
8.a. The color
codes
are indicated,
increasing
values from blue to red. For these urban-industrial aerosols the results over land and over ocean contrast over
coastlines, indicating overestimation of a and underestimation of 80 over land. Image iC indicates compen- sation of the biases in the aerosol indexAl = 8oc•. (bottom) (MA to MC): Same legend but for an area over Mexico; POLDER orbits 8012 and 8013 on May 27, 1997. For these small biomass burning aerosols the results are reasonably consistent on either sides of the coastlines, indicating that POLDER results over land are
consistent.
polarized light than expected according to Mic theory, which should explain the underestimation of the optical thickness. Another simple possibility is that by assuming monomodal size distribution wc underestimate the number of largc/nonpolar-
izing
particles
linked
to the small/polarizino
ones.
This
defect
may
appear
for pronounced
bimodality
of the size
distribution,
and
ground-based
obserwttions
have
shown
that many'
aerosols
exhibit significant bilnodality [Shettle and Fenn, 1979: Naka- jima et al., 1996; Remcr and Kaufinan, 1998].
Let us consider the POLDER observations over the ocean.
which proxide both the total and the polarized light scattered
by the aerosols. As explained by Dettz( • et al. [2(}00], thoe
observations are al.,,o analvzcd with monomodal acrosul mod-
DEUZE ET AL.: AEROSOLS OVER LAND WITH POLDER 4t•21
November 1996
,
May 1997
AI - 0.00 AI = 0.50
Plate 3. One month average values of the aerosol indexAl = •o•:•. (top) November 1996, (bottom) lXIay 1997. While the POLDER aerosol-processing lines oxer land and ocean lead to 8(, and c• results, which max differ largely though coastlines, the aerosol index exhibits good continuib' and allows for detecting large
pollution sources (Indian continent, China), areas of biomass burning acti'•ity (Madagascar and South Africa
in Noxember, Mexico in May), and Saharan aerosols.
and 865 nm channels. These theoretical monomodal model•
enable a tit of the radiance and lead to values of 8 o and a'
consistent with ground-based obserxations [Goloub et al., 1999], but they tend to underestimate the polarized light me,t-
Table 1. List of the Stations Where Correlative Aerosol
Measurements Used for POLDER Validation Have Been
Performed, With Number of Observations Available
According to Different Filterings
Number of Site Name Location Filtered Data Europe France Aire Adour 43.T'N, 0.2øE 24 Europe France Lille 50.5 •N, 3øE 5 Europe France •x, imcreux 50.7øN, 1.6 E 30
A.qa Japan Niigata 38øN, 139•E 21
M'rica Senegal Dakar 14.4 • N, 16.9•W 40 M'rica Burkina Fas.,,o Bidibahn 14øN ', 0.5øW 27 M'ric,.t Burkina Fasso Bondoukoui 11.8øN, 3.75%V 39 \lrica Niger Banizoumbou 3.5 N, 2.6'E 57
sured in side-scattering directions [Deuz• • et al., 2000]. This trend is inconsistent with the h_xpothcsis of nonpolarizing par- ticles but is ve D, understandable in the presence of bimodal
size distribution of the aero.,,ols. Let us consider according to
Remer and txaufinan [1998] a size distribution consisting of a small accumulation mode and a large coarse mode. Mie calculations show that the coarse mode oi•cs negligible po- larized light in the range 80 ø < •0 < 120". •,hile its contri- bution in the total light is noticeable. Then, as shown qual- itatively in Figure 7a and confirmed b> numerical simulations [Deuzt• et al., 2000], because the monomodal
model has to take into account the contribution of the
coarse mode in the total radiance, its adjustment is at the expense of the small particles, which leads to underestima- tion of the polarized light. Conversely, it can be seen that in the present algorithm, vYhere the monomodal model only accounts for polarized light, it adju.,,ts on the accumulation mode as show n qualitativeb in Fig. 7b, at the expense of the large particles and their cor•tribution in 8()aild or, thus lead- ing to l,.trgcr • and smaller
4922 DEUZE ET AL.: AEROSOLS OVER LAND WITH POLDER !,5 ! 0,5
• ' Iß
• [ = ' I = ' ] 't I • = 1'
! ß i ß ß _ ß ß ß ß ß 004' ß ßP
i ß
0 e_ß
ß
ß
d•
ß
*'
* ß*;'*-' *l ß
ß ß
' . ;. . ; . ß . -.ß
.. . ß
.-'.. ;
ß ß ß ß ß .Aerosol
exponent, (zAngstrom
J
i i i 0,5 I 1,5 2 Sunphotometer measurement 0,1 ß
ß
,.' (b)
ß 1% I ... d' ß oß q ß ßß Aerosol optical thickness, 150,01
o
0,01 0,! I I 0 Sunphotometer measurement C3. ß ß ß ß .=:
1l.._
..
. ....
o •jIF_.i•i.-'•;_.3,-• •.• .• .. ß -J ß ß O 0,01 .... t .... t .... t .... 0 0,5 1 1,5 2Angstrom exponent (Sunphotometer)
Figare
6. (a) Comparison
of the
aerosol
•mgstr6m
exponent
derived from POLDER with that derived from Sun photome- ter measurements. Polarized light systematically leads to an overestimation of a. (b) As Figure 6a, but for the aerosol optical thickness at 865 nm. Polarized light systematically leads
to an underestimation
of/50.
(c) The
I•LLIU 0 0 /0 0 UJ.the aerosol optical thicknesses derived from ?OLDER and
Sun
photometers
is reported
as a function
of the •gstr6m
exponent of the particles. The solid line corresponds to linear regression. The POLDER results tend toward consistent val-
ues
for small
particles
with
a large
•ngstr6m
exponent.
5.2. Aerosol Index
The discussion suggests that 8o and a derived from polar-
ization are characteristics of the small mode of aerosols and
correspond to the aerosol global properties only when the size distribution reduces to this mode. A more precise assessment
of the physical significance of/50 and a requires further analysis
of the POLDER data, but the previous analysis may be sup- ported indirectly by examination of the reduced parameter
AI = a/50, (11)
which, moreover, could provide a convenient aerosol indicate. Let (a.•, /SA) and (ac, /5c) represent the parameters
accumulation
and coarse
modes
of a bimodal
model,
respec:.
tively. According to the previous considerations, let us
crudely that the coarse mode corresponds to ac • 0 and give•
negligible
polarized
light,
so our inversion
leads
to (a•,
As
the
.Xmgstr6m
ex•onents
are
der_ived
fromm
nearby
ch.ann&
Xß
and X•, with 8x• 8x0(1
+ aAX/X),
the Angstr6m
expone•'m
of the bimoda! model is approximately
a = 8A
+ 8c
8
'
sowithac = 0,
AI = /sa = 8•a•. (!3}
As shown
in the Appendix,
the previous
crude
derivatio.n
•
be supported
by a more
refined
analysis.
Therefore
(13)s,ug.
gests that simple comparison of AI values based on the aerosol parameters with AI estimates derived only from
larization measurements allows us to check the "bimo,d•"ex.
planarion of the observed biases in/50 and a. If this explanafim is correct, the aerosol index AI should provide partial •.arae.
terization of the whole aerosol size distribution from
related only to the small polarizing particles.
5.3. Validation-Aerosol Survey Over Lands and Oc•
The/50 and a parameters reported in Figures 6a and 6b Myß been combined according to (11) in order to compare aero• indices derived from direct Sun photometer measureme•:g with those derived from the correlative POLDER data. Fi:•e
8 shows that the results are reasonably consistent and that systematic biases in/50 and a are reduced in the resulting A!.
1 0 ''''l"'''l''''l''''l''''i''''l''''l''''
0,1
I /-% • -- o- -Mon. Ocean
a. /
•
Sim.
%
//
,, I•, 1,1,,,, I,,,,I,,,,I,,,,,,
I•h ,, I,,,,'-4 -3 -2 -1 0 I 2 3 4
In(r)
Figure
7. (a) To fit the
radiance
from
bimodal
aeros:ols,'•
menßmodal
model
of the
ocean
processing
line
has
to
account
the
coarse
mode
of aerosols,
at the
expense
of
a
small
polarizing
particles.
(b) Inversely,
to fit the
radiance,
the
menßmodal
model
of
the
!and
surface
line has mainly to take into account the accumulation
DEUZE ET AL.: AEROSOLS OVER LAND X•, ITH POLDER 4923 0,6 0,,5 øo ø ß ee e ß ß ß ß e e •e• ß ..•,t. ß
::i'q"' ..
f
o,• !:- •'" .•-," "•'
ß
eeee•t•,m,•e
ß ß ß
f
'--
0 • . -0,1 ,,,[,,,,I,,,,[,,,,I,,,,]•,,, -0,1 0 0,• 0,2 0,3 0,4 0,õ 0,• Sunphotometer measurementFigure 8. Comparison of the aerosol index AI derived from
POLDER with that derived from Sun photometer measure- ments. The biases in 8o and c• derived from POLDER (see Figures 6a and 6b) are reduced in,41 = t•8 o.
The same transformation has been applied to the aerosol
parameters 8 o and r• reported in images iA, iB and M A, MB of
Plate 2. and the resulting aerosol indices are reported in im- ages iC and MC of the plate. The sxstematic discrepancies betv, een the POEDER aerosol results of the two independent processing lines disappear largely when expressed in terms of
aerosol index.
Therefore these comparisons support the possibility. of com- bining the present POLDER aerosol results over land in a single aerosol indicator, AI. which despite a reduction in the
information about the particle.,,. is related to the entire aerosol distribution.
It is worthwhile to examine the behavior of AI for the par- ticular ca.,e of desertic particles. These aerosols are known to consist partly of nonspherical and slightly polarizing particles. so the ability of polarization measurements to detect this im- portant component is questionable. The result• of Figure 8 have been dispatched in Figures 9a and 10a according to the
•ngstrOm
exponent
of the particles.
Figures
9a and 10a
cor-
respond. respectix ely. to • > 0.50 and • < 0.50 according to the ground-based values as shox•n by the histograms of the
.•ngstrOm
exponent
in Figures
9b and 10b.
Most
values
of c•
<
0.50 correspond to the three African stations of AERONET
and are most likely associated v, ith large dust events.
Strikingly, Figure 10a shows that the aerosol index is sensi- ti'•e to desertic particles, with a large number of exent• exhib- iting significant values of.t/. larger than 0.05 to 0.10. Despite the systematic bias in Figure 10a between the POLDER and the Sun photometer results. which ma) be indicatb, e of the inadequacy of Mie theo•, for such particles. the aerosol index derived from polarized light allows qualitative detection of
desertic particles.
Finally, Plate 3 shov•.• global maps of the aerosol index derived from the two aerosol-processing lines. oxer land and ocean, respectixely. The results are axerage ,,alues of.4I o,,er
one month. for November 1096 and lXlav 1997. The consistencx
betv, een the two kinds of results is impressive. *lore extensive and in depth analysis of these results should be dcxclopcd in another paper, but Plate 3 shoves that AI detects some large and well-known aerosol sources over land such as the Indian
0,4 Aerosol index _ 0,3 0,2 0,1 0 0 ß ß ß ee ß ß ß ß ß ß e e ß ß e e ee I ß
ß
'
'
0,1 0,2 0,3 0,4 0,5 Sunphotometer measurement 15 10 0 t 0 0,5 1 1,5Angstrom exponent (Sunphotometer)
Figure 9. (a) As Figure 8, but the comparison between the
POLDER and the Sun photometerA1 is shox•n for the case of
rather small particles; a > 0.50 according to the ground-based
•,,.tlucs.
(b) tlisto,,ram
of the ,,?-Xngstr6m
exponent
(from
ground-ba..,ed measurement.,,) for observations reportcd in Fig-
ure 9a. 0,6 0,5 0,4 0,3 0,2 0,1 ' ee ß ß . ß . ß ß
I
ß Aerosol index 0 '11 ' ' I , , , , I q . ,..' ... ,.• .,, ... III, -0,1 0 0,1 0,2 0,3 0,4 0,5 Sunphotometer measurement 6O 5O 4O 3O 2O 0 0 100,5 1
•,5
2
•,5
Angstrom exponent (Sunphotometer)
Figure 10. (a) As Figure 8, but the comparison between the POLDER and the Sun photometerAl i.,, shovm for the ca.,,ß of
large particles; c• < 0 q0 accordinß, to the oround-bascd values. Most result• are from AERONET .stations in Africa and cor-
respond to Saharan dusts. (b) llistogram of thc AngstrOm
exponent (lrom ground-ba.,,ed measurements) for observations