Publisher’s version / Version de l'éditeur:
Journal of Indian Water Works Association, 35, Oct/Dec. 4, pp. 1-23, 2003-10-01
READ THESE TERMS AND CONDITIONS CAREFULLY BEFORE USING THIS WEBSITE.
https://nrc-publications.canada.ca/eng/copyright
Vous avez des questions? Nous pouvons vous aider. Pour communiquer directement avec un auteur, consultez la
première page de la revue dans laquelle son article a été publié afin de trouver ses coordonnées. Si vous n’arrivez pas à les repérer, communiquez avec nous à [email protected].
Questions? Contact the NRC Publications Archive team at
[email protected]. If you wish to email the authors directly, please see the first page of the publication for their contact information.
NRC Publications Archive
Archives des publications du CNRC
This publication could be one of several versions: author’s original, accepted manuscript or the publisher’s version. / La version de cette publication peut être l’une des suivantes : la version prépublication de l’auteur, la version acceptée du manuscrit ou la version de l’éditeur.
Access and use of this website and the material on it are subject to the Terms and Conditions set forth at
Forensics of water quality failure in distribution systems - a conceptual framework
Sadiq, R.; Kleiner, Y.; Rajani, B. B.
https://publications-cnrc.canada.ca/fra/droits
L’accès à ce site Web et l’utilisation de son contenu sont assujettis aux conditions présentées dans le site
LISEZ CES CONDITIONS ATTENTIVEMENT AVANT D’UTILISER CE SITE WEB.
NRC Publications Record / Notice d'Archives des publications de CNRC:
https://nrc-publications.canada.ca/eng/view/object/?id=9f2551b3-d1f6-4444-8705-5a73c0f795cf https://publications-cnrc.canada.ca/fra/voir/objet/?id=9f2551b3-d1f6-4444-8705-5a73c0f795cf
Forensics of water quality failure in distribution systems – a conceptual framework
Sadiq, R.; Kleiner, Y.; Rajani, B.
NRCC-46742
A version of this document is published in / Une version de ce document se trouve dans : Journal of Indian Water Works Association, v. 35, no. 4, Oct-Dec. 2003, pp. 1-23
Forensics of water quality failure in distribution systems –
a conceptual framework
Rehan Sadiq*, Yehuda Kleiner and Balvant Rajani
Institute for Research in Construction, National Research Council Canada, Ottawa, Ontario K1A 0R6, Canada
Precise causes of water quality failures are often difficult to pinpoint. The complexity of the distribution system (many kilometers of pipes of different materials and ages), occurrences of physical/chemical/biological processes and the lack or absence of timely data make forensic analyses of water quality failure events very challenging. Water quality failure in the distribution system can occur through several pathways. These include intrusion of contaminants through failed or compromised pipes and cross-connections, regrowth of microbes in pipes and
distribution storage tanks, leaching of chemicals or corrosion products from system components (pipes, tanks, liners), water treatment failure, deliberate contamination by terrorists and
permeation of organic compounds through various plastic components of the system. Various indicators of water quality failure (symptoms) such as changes in the turbidity, odour, taste and colour, waterborne illnesses ranging from minor to serious, etc. can provide clues as to the causes of the failure in much the same way as symptoms of human health are used to diagnose causes and propose treatment.
A framework is proposed using fuzzy-based techniques and a knowledgebase on water quality. This framework is capable of backtracking symptoms to determine the candidate
categories of contaminants, sources and/or pathways that cause a given water quality failure and rank them according to their respective likelihoods (or memberships). The usability of the framework is demonstrated with the help of a hypothetical case study.
Key words: forensics, fuzzy sets, knowledgebase, water distribution, and water quality failure. *Corresponding author: [email protected]
1 INTRODUCTION
1.1 WATER QUALITY FAILURE IN THE DISTRIBUTION SYSTEM
A typical modern water supply system comprises the water source (aquifer or surface water source including the catchment basin), treatment plants, transmission mains, and the distribution system which includes pipes and distribution tanks. While water quality can be compromised at any component, failure at the distribution level can be extremely critical because it is closest to the point of delivery and, with the exception of a rare filtering device at the
consumer level, there are virtually no safety barriers before consumption. Water quality failures, that compromise either the safety or the aesthetics of water in distribution networks, can
generally be classified into the following major categories (Kleiner, 1998):
• Intrusion of contaminants into the distribution system through system components whose integrity was compromised or through misuse or cross-connection or intentional introduction of harmful substances in the water distribution system;
• Regrowth of microorganisms in the distribution network;
• Microbial (and/or chemical) breakthroughs and by-products and residual chemicals from the water treatment plant;
• Leaching of chemicals and corrosion products from system components into the water; and
• Permeation of organic compounds from the soil through system components into the water supplies.
Intrusion of contaminants into the water distribution system can occur through storage tanks (animals, dust carrying bacteria, infiltration) and pipes. Intrusion of contaminants through water mains may occur during maintenance and repair events, through broken pipes and gaskets, and cross-connections (Geldreich, 1990). Whenever the water pressure in a pipe is very low or negative, the risk of contamination through backflow or through leaky pipes increases. This can happen when the pipe is de-pressurized for repair or when the pipe is used for fire extinguishing or during transient pressures. Low or negative pressures, coupled with unprotected
cross-connections and/or contaminated soils, and/or leaky sewers in the pipe vicinity create a high risk of contaminant intrusion especially if the pipe is deteriorated with cracks and pinholes.
Biofilm is a deposit consisting of microorganisms, microbial products and detritus at the surface of pipes or tanks. Biological regrowth may occur when injured bacteria enter from the treatment plant into the distribution system. Under favorable conditions, such as nutrient supply (e.g., organic carbon) in the water and long residence time, these bacteria can attach themselves to surfaces, rejuvenate and grow in storage tanks and on rough inner surfaces of water mains. The regrowth of organisms in the distribution system results in an increased chlorine demand, which has two adverse effects: (a) a reduction in the level of free available chlorine may hinder the system’s ability to contend with local occurrences of contamination (US EPA, 1999), and (b) an increased level of disinfection to satisfy the chlorine demand of biofilm results in higher concentrations of disinfection by-products (DBPs).
Disinfection is used to inactivate or kill pathogens. Chlorine has been highly successful in reducing the incidences of waterborne infections in human beings, but harmful DBPs are formed in the presence of natural organic matter (NOM) and bromide (from the source water) during chlorination. Other commonly used disinfectants are chloramines (combined chlorine), chlorine di-oxide and ozone. Ozone reacts with NOM and produces aldehydes, ketones and inorganic by-products. Ozone and chlorine di-oxide in the presence of bromide ion produce bromate and chlorate (and chlorite), respectively, which may have adverse effects on human health (US EPA, 1999).
Red water is one common water quality failure, which is a loss of aesthetics rather than a hazard to human health. Internal corrosion of metallic pipes and plumbing devices increases the concentration of metal compounds in the water. Different metals go through different corrosion processes, but in general low pH water, high dissolved oxygen, high temperature, and high levels of dissolved solids increase corrosion rates. Heavy metals such as lead and cadmium may leach into the water from pipes, causing significant health effects. Secondary metals such as copper (from home plumbing), iron (distribution pipes) and zinc (galvanized pipes) may leach into water and cause taste, odour and colour problems in addition to minor health related risks (Kleiner, 1998).
Permeation is a phenomenon in which contaminants (notably hydrocarbons) migrate through the pipe (plastic) wall. Three stages are observed in permeation phenomenon: (a) organic chemicals present in the soil partition between the soil and plastic wall, (b) the chemicals defuse through the pipe wall, and (c) the chemicals partition between the pipe wall and the water inside the pipe (Kleiner, 1998). In general, the risk of contamination through permeation is relatively small as compared to other mechanisms. Figure 1 depicts a conceptual map of various factors that may play a role in the water quality arena. This map is by no means complete and
comprehensive, but serves to demonstrate the complexity of the mechanisms.
Diagnostic or forensic analysis of contamination risk in water distribution systems is a difficult task due to the following:
• Water distribution system may comprise (depending on the size of the water utility) thousands of kilometers of pipes of different ages and materials;
• Operational and environmental conditions under which these pipes function, may vary significantly depending on the location of the pipes within the system;
• Since the pipes are not visible, it is relatively difficult and expensive to collect data on their performance and deterioration, and therefore indeed little field data are available;
• Some factors and processes affecting pipe performance are not completely understood; and
• It is often difficult to determine or validate an exact cause for water contamination or waterborne disease outbreak because such episodes are often investigated after the
occurrence has ended. For these reasons, high uncertainties are inherent in any risk measure that may be assigned to the distribution system.
1.2 WATER QUALITY DEFINITIONS AND MONITORING
Water quality is generally defined by a collection of upper and lower limits on selected possible contaminants in water (Maier, 1999). Water quality indicators (parameters or classes) can be classified into three broad categories: physical, chemical and biological contaminants. Within each class, a number of quality variables are considered. The acceptability of water quality for its intended use depends on the magnitude of these indicators (Swamee and Tyagi,
2000) and is often governed by regulations. A water quality failure (WQF) event is often defined as an exceedence of one or more water quality indicators from specific regulations, or in the absence of regulations, exceedence of guidelines or self-imposed, customer-driven limits.
As stated earlier, the physical, chemical and biological processes occurring in water distribution pipes are numerous and complex. A wealth of literature is available, describing the overall water quality represented by an aggregate index using various statistical and
mathematical techniques. Swamee and Tyagi (2000) have discussed in detail the pros and cons of different techniques and approaches available for evaluating the overall index of water quality. Sinha et al. (1994) combined pH, chloride concentration, turbidity, residual chlorine,
conductivity and MPN (Most probable number – a bacterial counting technique) into a single water quality index (0-100) through a weighting technique to represent an overall water quality at various nodes in the distribution system. Sadiq et al. (2003a) suggested a framework for the analysis of aggregative risk associated with water quality failure in the distribution system.
To monitor the quality of water in the distribution system, physical, chemical and biological parameters are recorded from routine grab sampling, followed by an analysis in the laboratory or using portable kits in the field. Sensor technology exists that enables capturing some parameters through online monitoring rather than grab samples. This technology is
continually evolving to encompass more types of water quality indicators. Some common water quality indicators used for water distribution are alkalinity, dissolved oxygen, fluoride, nitrates, phosphate, residual disinfectant, specific organic compounds, temperature and turbidity
(Hunsinger and Zioglio, 2002).
Regular monitoring programs help to identify a WQF if water quality indicators exceed regulatory regimes. Diagnostic/forensic techniques are used to relate the symptoms of WQF event to the causes (class of water quality indicators). The identification of such a breach is akin to identifying symptoms of a specific disease in the medical diagnosis. Pattern recognition techniques (an automatic recognition, description, classification and grouping of patterns) have been used extensively in variety of engineering and medical applications.
The fuzzy-based pattern recognition system typically involves data acquisition and pre-processing (knowledgebase), data representation and reporting, and decision-making
(identification of patterns). Fuzzy set theory (Zadeh, 1965) has been used for imprecise, incomplete and subjective knowledge for qualitative diagnostic modelling. Klir and Yuan (1995), Yao and Yao (2001) and Kiseliova and Peters (2001) used a decision-making technique for medical diagnosis using fuzzy sets and the compositional rule of inference. Chao and Cheng (1998) used fuzzy pattern recognition model for diagnosing cracks in reinforced concrete structures. Fuzzy-based pattern recognition techniques have been applied for character
recognition (Chatterjii, 1982), texture classification (Hajnal and Koczy, 1982) and for earthquake modelling (Watada et al., 1984).
2 WATER QUALITY FORENSICS
2.1 FUZZY SETS AND FUZZY RELATIONS
Fuzzy logic is the science of reasoning, thinking and inference that recognizes and uses the real world phenomenon that every thing is matter of degree. Fuzzy-based techniques are generalized form of interval analysis, which address uncertain and/or imprecise information. Zadeh (1965) introduced this concept, in which fuzzy sets are assigned to variables to represent uncertainties. A fuzzy set describes the relationship between an uncertain quantity x and a membership function µ, which ranges between 0 and 1. A fuzzy set is an extension of the
traditional set theory (in which x is either a member of set A or not) in that an x can be a member of set A with a certain degree of membership µ (Sadiq et al., 2003b).
Fuzzy sets are distinguished from the probability concept in the type of uncertainty they describe. Probability is a way of handling and expressing randomness accounts for the likelihood that something is true or will happen. The concept centres around an all-or-none event, a binary concept- where the event can be defined as an entity having a particular characteristic, i.e., either it has that characteristic or not. Fuzzy sets on the other hand assess how much the entity is compatible with the definition of the characteristic.
The purpose of aggregation in fuzzy set theory is to meaningfully summarize and simplify a body of data. Familiar examples of aggregation techniques include arithmetic averages, geometric averages, harmonic averages, maximum and minimum values (Ayyub, 2001). Triangular norms (t-norm) and conorms (t-conorm) are generally used to define
aggregation operators. Ramik and Vlach (2001) and Sentz and Ferson (2002) provide a detailed description of the aggregation operators and fuzzy compositional rules used in this paper.
2.2 WATER QUALITY FAILURE INDICATORS (EFFECTS) AND CAUSES OF FAILURE – A
RELATIONAL MATRIX
Let set P represent an array of water quality failure (WQF) indicators containing n elements (e.g., odour, colour, taste etc.)
P = [P1 P2... Pi… Pn]1 × n; i = 1, 2,..., n (1)
(2)
(3)
(4) Each WQF indicator Pi may be observed at various levels (symptoms), e.g., colour of water can be brownish, yellowish or greenish in case of a WQF failure, therefore each Pi can take on any of mi elements
Pi = [Pi1 Pi2 ... Pij … Pimi] 1 × mi; j = 1, 2,..., mi
A symptom Pij may point to one or more WQF mechanisms or events. Let set C represents the classes of cause of a WQF event, such as physical (e.g., temperature), inorganic (e.g., metals), organic (e.g., trihalomethanes) or biological (e.g., E-coli). In total there are p classes in set C as follows:
C = [C1 C2 ... Ck … Cp] 1 × p; k = 1, 2,..., p
A relational matrix R (to relate cause and effect) can be established between the classes of WQF and symptoms, based on hard (field) and soft (expert opinion) data. Let the matrix Ri represents the relationship between Ck (class of causes of WQF) and Pij (symptom) as follows:
p i m p , i im , i im , i im p , i , i , i p , i , i , i i r r r r r r r r r R × = L M L K 2 1 2 2 2 1 2 1 2 1 1 1 i = 1, 2,..., n
where rij,p represents a correlation (statistically derived or perceived qualitatively) between Ck and Pij. Knowledge acquisition is required to explore and develop relationships between Pij and
literature review; surveys/interviews and solicitations of opinions of an expert panel (McCauley-Bell and Badiru, 1996).
The preliminary analysis helps to obtain an overview of the problem and determine potential modular categories that would be useful in classifying various types of WQF risks. For water quality in distribution networks, this analysis could be carried out along the contamination pathways as illustrated in Figure 1. Literature review follows the preliminary analysis, which provides more comprehensive understanding of water quality failure. With comprehensive understanding, questionnaires and interview sessions can be designed to query the knowledge of utility personnel and other professionals working in the water industry. Finally, an expert panel can be assembled to discuss and organize the available information as well as to help fill
identified knowledge gaps. The final data (correlation between WQF symptoms and the causes) may be qualitative, quantitative or a hybrid of both.
2.3 WATER QUALITY SAMPLING – A CONFIRMATIONAL MATRIX
Let N represent a set of l water samples, collected from the distribution system to monitor the WQF indicators.
N = [N1 N2… Nh… Nl] 1 × l; h = 1, 2,..., l (5)
(6) where Nh represents a single sample. Each Nh encompasses measurements of i (i = 1, 2,…, n) WQF indicators, and as stated in equation (2) can take a value of Pimi. Let Q represents a water
quality report about WQF indicator i in sample N
h i h : Q
[
]
j = 1, 2,..., m i m h i im h ij h i h i h i = q1 q2 L q L q 1× iwhere qijhrepresents a level of certainty that any water sample Nh may have certain symptom Pij. For each sample Nh, the matrix Qihcontains mi (number of) symptoms. If any symptom is not
reported (or is below detection limit) that entry is considered as zero. Q is commonly referred
to as confirmational matrix.
h i
2.4 FUZZY COMPOSITION FOR WATER QUALITY FAILURE
Let T denote a fuzzy set with p members (or tuples), where each tuple tih i,k represents a
certainty level that in sample Nh the WQF indicator i was caused by WQF class k. T can be
estimated from the water sample report Q and the relational matrix R
h i h i i
[
]
[
i i ip]
p h i p m p im im im p i i i p i i i m h im h i h i i h i h i t t t T r r r r r r r r r q q q R Q T i i i i i i × × × = = = 1 , 2 , 1 , , 2 , 1 , , 2 2 , 2 1 , 2 , 1 2 , 1 1 , 1 1 2 1 L L M L K o L o (7) (8) (9) (10) where “ο” represents composition operators defined with the help of t-norms and t-conorms. Theextension of (7) to all WQF indicators i (i = 1, 2, …, n) results in matrix Th where each ith row
corresponds to a specific Tih T p n p , n , n , n p , , , p , , , h t t t t t t t t t × = L M L L 2 1 2 2 2 1 2 1 2 1 1 1
Let I denote a matrix representing the relative importance of the presence of a symptom Pij as a testimonial to the occurrence of an event of WQF, and let Bh denote a non-weighted
p-tuple fuzzy set, in which element denotes the likelihood that a water sample h is evidence to
the occurrence of a class k WQF:
h k b I =
[
I1 I2 L Ii L In]
1×n ; i = 1, 2,..., n[
]
[
]
p h p h k h h h p n p , n , n , n p , , , p , , , n n i h h b b b b B t t t t t t t t t I I I I T I B × × × = = = 1 2 1 2 1 2 2 2 1 2 1 2 1 1 1 1 2 1 L L L M L L o L K owhere “ο” represents composition operators defined with the help of t-norms and t-conorms.
Equation (10) can be extended to l water samples as follows
B p l l p l l p p b b b b b b b b b × = L M L L 2 1 2 2 2 2 1 1 1 2 1 1 (11) (12) (13) Water quality sampling can be carried out in various ways. Often, several samples are collected from the same sampling location to increase the reliability of the findings. Sometimes there is a reason to suspect that some samples are more (or less) reliable than others, in which case different weights can be assigned to samples according to their perceived reliabilities. Further, samples could also be weighted by the importance of their sampling locations, such as the relative importance of the water main sampled (e.g., based on size or flow rate), proximity to the water storage facility and the type of consumers (e.g., sensitive population i.e., close to school or hospital). Let W denote a sample weight matrix, in which each element W
corresponds to the weight of sample h
h
W =
[
W1 W2 L Wh L Wl]
1×l ; h = 1, 2,..., lImportance and weight matrices (I and W) can be established through the analytic
hierarchical process (AHP). The AHP is a technique commonly used for multiple-criteria analysis. The AHP develops a linear additive model, which derives weights by performing pair-wise comparisons between criteria or attributes (Ziara et al., 2002). Once the W is established,
the matrix B can be weighted
[
]
[
k p]
p p l l p l l p p l l h a a a a A b b b b b b b b b W W W W B W A × × × = = = 1 2 1 2 1 2 2 2 2 1 1 1 2 1 1 1 2 1 L L L M L L o L K owhere “ο” represents composition operator defined with the help of t-norms and t-conorms as
water samples, that a class k WQF event has occurred. The highest value of ak is typically designated the most probable WQF class.
The relational matrices Ri provide a knowledgebase for the proposed framework. These relational matrices can be expanded to additional hierarchical levels, e.g. the water quality failure class Ck can be related to more specific classes of contaminants. These specific contaminants (classes of WQF) can be further linked to the basic sources and pathways of water quality failure.
3 HYPOTHETICAL CASE STUDY
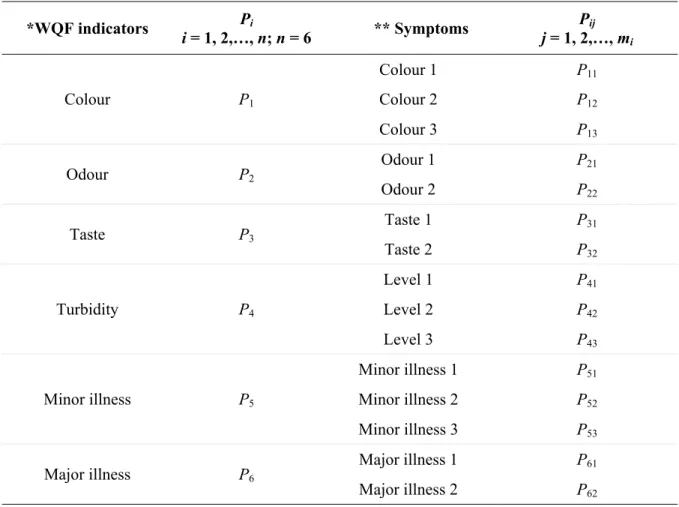
Table 1 shows six major WQF indicators (Pi; i =1, 2, …n; n = 6), where each indicator enumerates all possible symptoms Pij (, i =1, 2, …n; j =1, 2, …mi). For example, the WQF indicator “colour” can take one of three values– colour 1, colour 2 and colour 3, which may be symptoms of a WQF event.
Three classes Ck (k =1, 2, …p; p = 3) of causes of WQF are considered in this example,
namely, physical (C1, e.g. temperature), chemical (C2, e.g. presence of heavy metals, organics) and microbiological (C3, e.g. E-coli, heterotrophic plate counts). Table 2 shows the relational matrices Ri, which express the correlations between symptoms (Pij) and the cause of classes, Ck, of WQF. Matrices Ri constitute the knowledgebase, which can be established from field,
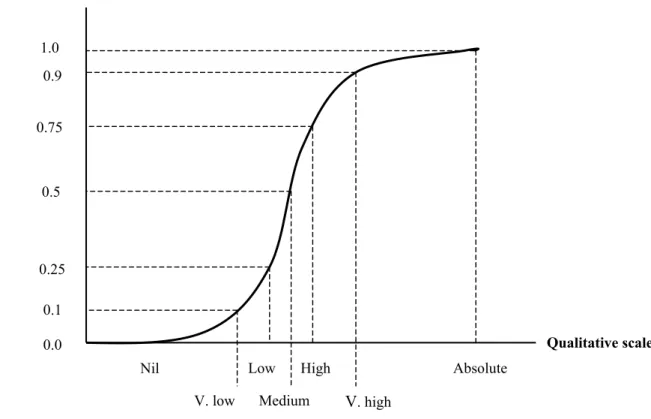
laboratory data and expert judgment or any combination thereof. Membership functions (Figure 2) can be used to define these correlations if available knowledge is vague or imprecise, or probabilities can be used if sufficient hard data are available. For example, if statistical data show that symptom P11 is caused 80% of the time by C2 and 20% of the time by C3, the values 0.8 and 0.2 can be designated to C2 and C3, respectively. If the data are not available, experts can assign these values using a linguistic scale similar to that shown in Figure 2 (Chao and Cheng, 1998).
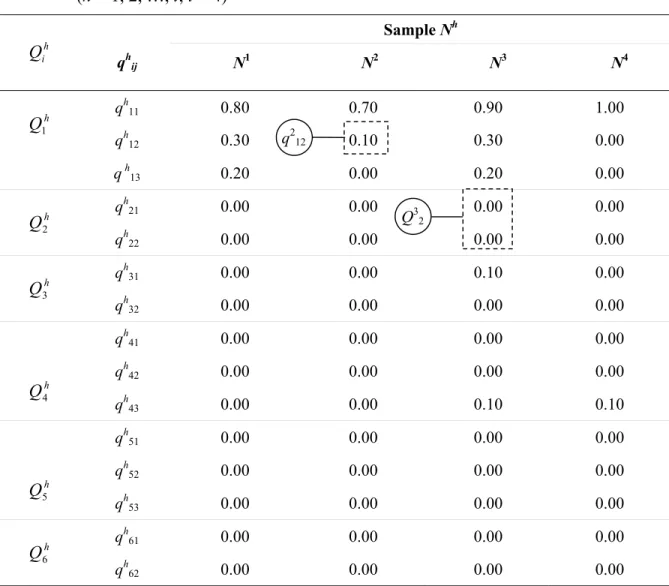
Assume that the water quality is monitored at four sampling locations and that one sample Nh was collected from each location (h = 1, 2, …, l; l = 4). Table 3 shows (from equation
(6)) certainty levels, qijh associated with water sample Nh for symptom Pij. For example, a certainty level of 0.8 (high to very high) was assigned to symptom P11 (colour 1) in sample N1,
and a certainty level 0.7 (medium to high) for the same symptom in sample N2, and so on. Note that in the sample N1 the observer is also about 0.3 (low to medium) certain that colour 2 was
observed and 0.2 (very low to low) certain that it was colour 3. This illustrates the reality in
which distinctions between observed phenomena are imprecise and often vague. Again the linguistic scale (Figure 2) can be used to define the certainty level of the presence of symptoms in samples. Matrices Q are compiled from Table 3. ih
Once both matrices Q and Rih i are established, the matrix T can be calculated using equation (7) and subsequently T
h i
h
can be calculated using equation (8). Note that for comparison, equation (7) was applied using three different composition operators, max-min (reflects low uncertainty range), sum-prod (reflects high uncertainty range) and mix of both max-min and sum-prod. These three compositional operators express the various degrees of and-ness and
or-ness in the application of fuzzy sets. Logical operators like max-min are more restrictive than,
say, sum-prod and max-prod. Application of different operators leads to a range of outcomes
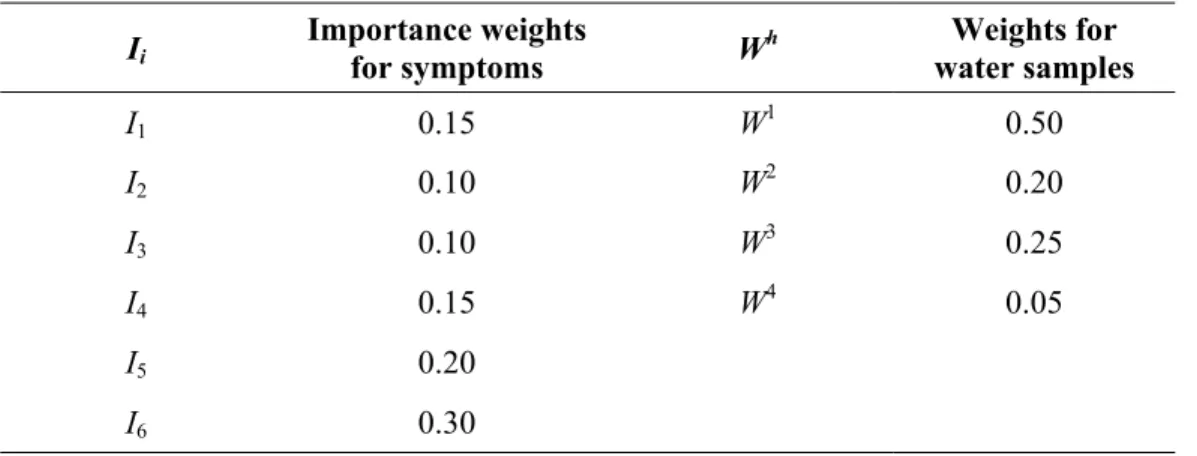
that permits the analyst to assess the likely cause of a WQF event. Arbitrarily chosen importance factors (I) for symptoms and weights for sampling locations (W), required to establish matrices Bh and A, are shown in Table 4. The non-weighted likelihood that water sample h is due to class k WQF as per equation (10) is shown in the top part of Table 5. Dramatically different
non-weighted likelihoods Bh can also serve as quality control measures for water sample tests. The weighted aggregate likelihood of all l water samples due to a class k WQF is shown in the last
row of Table 5. Note those membership values h and a
k
b k are normalized in Table 5, so that the sum of every row is unity. This facilitates the conversion of the results from membership values to probabilities (Yao and Yao, 2001). The max-min and mixed compositional operator indicate
that, the highest likelihood (probability or a normalized membership) of the water quality failure in this example is due to chemical agents (C2), followed by microbial (C3) and physical agents (C1). However, the max-min compositional operator indicates that both chemical (C2) and microbial (C3) agents are equally likely to have caused the WQF event. This apparent discrepancy serves to point out how the outcome can differ when different compositional operators are used but this type of analyses offers leading clues of what issues should be addressed first.
4 DISCUSSION AND CONCLUSIONS
Forensic analysis of a WQF event in a complex system inherently involves quantitative and qualitative assessments based on hard knowledge, supported by field data, as well as on soft imprecise knowledge acquired through anecdotal observations and vague notions of experts. The proposed framework using fuzzy-based approaches is uniquely suited to synthesize and make use of both types of knowledge. Fuzzy-based approaches allow the explicit consideration of
uncertainties, which propagate through the analysis. It should however be noted that the framework presented in this paper is a simplified demonstration of the approach. A
comprehensive structure would require a major effort, including the collaboration of several experts in the various related disciplines of knowledge.
The proposed method can be used to develop a system in which data (symptoms)
obtained from sensors or field or lab tests are interpreted to help determine the likely source of a WQF and/or the pathway through which a contaminant was introduced into the system. The method is modular and scalable and thus able to accommodate new knowledge and information. It is easily programmable for computer applications and can be developed into a reliable water quality forensic tool for a water distribution system. It can also be linked to geographic
information systems (GIS) and online monitoring systems to determine the likelihood of causes of water quality failures at various locations in a distribution system. Uncertainty in the diagnosis improves as the uncertainties in the various inputs and parameters are reduced. The proposed approach can help pinpoint those areas in which more data would yield the highest benefits in terms of accurate results.
Different compositional operators can be used at different hierarchical levels. The
proposed method may be sensitive to the selection of compositional operators, as is illustrated in the variability of the results of the numerical example. A comprehensive analysis would require appropriate sensitivity tests. However, ultimately more research is needed to determine which compositional operators are most appropriate for various levels.
The proposed framework may also be sensitive to the weights that are assigned at various compositional levels of the analysis. There are numerous ways to derive weights, prominent among which is the analytic hierarchical process mentioned earlier. Regardless of the method
used for weight derivation, sensitivity analyses would have to be implemented in any credible analysis. It would also be possible to assign fuzzy rather than crisp weights, and then examine the resulting most-likely values and the tolerances (e.g., Deng, 1999; Triantaphyllou and Lin, 1996).
The proposed framework accommodates both qualitative and quantitative data as
described before. Some data may be supported by rigorous observations (historical data based on probabilities), while other data may be based on loosely supported or anecdotal-based beliefs (expert opinion). These two types of data should have different weights in the aggregation process. The framework in its current form does not address this need to distinguish between data obtained from sources with different reliabilities.
Another issue that requires further research is the way in which the symptoms qij are reported in the water samples (confirmational matrix). In the presented approach, single values of memberships (called singletons in fuzzy set theory) are used to establish confirmational matrices. The analyses can be more flexible if fuzzy numbers were used instead. The same can also be said about the relational matrices for Pij. Currently, all relations rij,p are represented by singletons, which carry the same weight. In reality, some of these relations would typically be supported by hard data, while others would be more loosely based on anecdotal information. A possible way of considering these differential reliabilities of knowledge is by expressing the relations using fuzzy rather than crisp numbers (memberships), where the less reliable relations would assume a fuzzy number with a wider range of uncertainty.
5 REFERENCES
Ayyub, B.M. 2001. Elicitation of expert opinions for uncertainty and risks, CRC Press.
Chao, C-J., and Cheng, F-P. 1998. Fuzzy pattern recognition model for diagnosing cracks in RC structures, ASCE Journal of Computing in Civil Engineering, 12(2): 111-119.
Chatterjii, B.N. 1982. Character recognition using fuzzy similarity relations, In: Fuzzy information and decision processes, Ed. Gupta, M.M., and Sanchez, E., North-Holland
Publishing Co, New York, 131-137.
Deng, H. 1999. Multicriteria analysis with fuzzy pairwise comparison, International Journal of Approximate Reasoning, 21: 215-231.
Geldreich, E.E. 1990. Microbiological quality control in distribution systems, In: Water quality and treatment, Ed. Frederick, W.P., American Water Works Association, NY, McGraw-Hill
Inc.
Hajnal, M., and Koczy, L.T. 1982. Classification of textures by vectorial fuzzy sets, In: Fuzzy information and decision processes, Ed. Gupta, M.M., and Sanchez, E., North-Holland
Publishing Co, New York, 157-164.
Hunsinger, R.B., and Zioglio, G. 2002. Rationale for online monitoring, In: Online monitoring for drinking water utilities co-operative research report, Ed. Hargesheimer, E., Conio, O.,
and Popovicova, J., American Water Works Association Research Foundation, CO. Kiseliova, T., and Peters, H. 2001. Decision-making in diagnosis of oral Mucosa Lesions, In:
Fuzzy days 2001, Ed. Reusch, B., LNCS 2206, pp. 33-39.
Kleiner, Y. 1998. Risk factors in water distribution systems, British Columbia Water and Waste Association 26th Annual Conference, Whistler, B.C., Canada.
Klir, G.J., and Yuan, B. 1995. Fuzzy sets and fuzzy logic - theory and applications, Prentice-
Hall, Inc., Englewood Cliffs, NJ, USA.
Maier, S.H. 1999. Modeling water quality for water distribution systems, Ph.D. thesis, Brunel
University, Uxbridge.
McCauley-Bell, P., and Badiru, A.B. 1996. Fuzzy modeling and analytic hierarchy processing to quantify risk levels associated with occupational injuries – Part I: the development of fuzzy linguistic risk levels, IEEE Transactions on Fuzzy Systems, 4(2): 124-131.
Ramik, J., and Vlach, M. 2001. Generalized concavity in fuzzy optimization and decision analysis, Kluwer Academic Publishers, Boston.
Sadiq, R., Kleiner, Y., and Rajani, B.B. 2003a. Aggregative risk analysis for water quality failure in distribution networks, Submitted to AQUA - Journal of Water Supply: Research &
Technology.
Sadiq, R., Rajani, B.B., and Kleiner, Y. 2003b. A fuzzy-based method to evaluate soil corrosivity for prediction of water main deterioration, Submitted to ASCE, Journal of Infrastructure Systems.
Sentz, K. and Ferson, S. 2002. Combination of evidence in Dempster-Shafer theory, SAND 2002-0835.
Sinha, R., Gupta, P., and Jain, P.K. 1994. Water quality modeling of a city water distribution system, Indian Journal of Environmental Health, 36(4): 258-262.
Swamee, P.K., and Tyagi, A. 2000. Describing water quality with aggregate index, ASCE Journal of Environmental Engineering, 126(5): 451-455.
Triantaphyllou, E., and Lin, C-T. 1996. Development and evaluation of five fuzzy multi-attribute decision-making methods, International Journal of Approximate Reasoning, 14: 281-310.
US EPA 1999. Microbial and disinfection by-product rules – simultaneous compliance guidance manual, United States Environmental Protection Agency, EPA 815-R-99-015.
Watada, J., Fu, K.S., and Yao, J.T.P. 1984. Linguistic assessment of structural damage, Rcp.
CE-STR-84-30, Purdue University, West Lafayette, Indiana.
Yao, J.F-F., and Yao, J-S. 2001. Fuzzy decision-making for medical diagnosis based on fuzzy number and compositional rule of inference, Fuzzy Sets and Systems, 120: 351-366.
Zadeh, L.A. 1965. Fuzzy sets, Information and Control, 8: 338-353.
Ziara, M., Nigim, K., Enshassi, A., and Ayyub, B.M. 2002. Strategic implementation of infrastructure priority projects: case study in Palestine, ASCE Journal of Infrastructure Systems, 8(1): 2-11.
Regrowth and protection of
microbes
Effects on water quality in water mains (the physical, chemical and biological characteristics of the water change with age of the pipe)
Detachment and sloughing pH, alkalinity, DO, etc. In-line disinfection DBPs Residual disinfectant AOC, TOC, Nutrients Injured bacteria Water quality from treatment plant Formation of biofilm Tuberculation Contaminated groundwater Contaminated soil Transients De-pressurized and
low pressure pipes
Maintenance events Broken pipes and
deteriorated gaskets
Internal corrosion and leaching High breakage frequency
rate
Pipe deterioration
Cross-connection
Back flow
Qualitative scale 1.0 0.9 0.75 0.5 0.25 0.1 0.0 Membe rshi p function ( µ ) or p robabilit y Medium Low V. low V. high Absolute Nil High
Table 1. Symptoms for water quality failure in distribution system *WQF indicators Pi i = 1, 2,…, n; n = 6 ** Symptoms Pij j = 1, 2,…, mi Colour 1 P11 Colour 2 P12 Colour P1 Colour 3 P13 Odour 1 P21 Odour P2 Odour 2 P22 Taste 1 P31 Taste P3 Taste 2 P32 Level 1 P41 Level 2 P42 Turbidity P4 Level 3 P43 Minor illness 1 P51 Minor illness 2 P52 Minor illness P5 Minor illness 3 P53 Major illness 1 P61 Major illness P6 Major illness 2 P62
* Water quality failure indicators
Table 2. Relational matrices Ri = Pij× Ck (k = 1, 2, …, p; p = 3) Symptoms, Pij (j = 1, 2,…, mi) Physical C1 Chemical C2 Microbial C3 P11 (colour 1) 0.00 0.80 0.20 P12 (colour 2) 0.00 0.70 0.30 P13 (colour 3) 0.10 0.60 0.30 P21 (odour 1) 0.20 0.40 0.40 P22 (odour 2) 0.30 0.50 0.10 P31 (taste 1) 0.10 0.60 0.30 P32 (taste 2) 0.00 0.30 0.70 P41 (turbidity level 1) 0.50 0.40 0.10 P42 (turbidity level 2) 0.70 0.20 0.10 P43 (turbidity level 3) 0.90 0.10 0.00 P51 (minor illness 1) 0.00 0.30 0.70 P52 (minor illness 2) 0.00 0.60 0.40 P53 (minor illness 3) 0.10 0.10 0.80 P61 (major illness 1) 0.00 0.80 0.20 P62 (major illness 2) 0.10 0.50 0.40 r42,2 R4
Table 3. Water quality report (confirmational matrix) for 4 sampling locations (h = 1, 2, …, l; l = 4) Sample Nh h i Q qhij N 1 N2 N3 N4 qh11 0.80 0.70 0.90 1.00 qh12 0.30 0.10 0.30 0.00 h Q1 qh13 0.20 0.00 0.20 0.00 qh21 0.00 0.00 0.00 0.00 h Q2 qh22 0.00 0.00 0.00 0.00 qh31 0.00 0.00 0.10 0.00 h Q3 qh32 0.00 0.00 0.00 0.00 qh41 0.00 0.00 0.00 0.00 qh42 0.00 0.00 0.00 0.00 h Q4 qh43 0.00 0.00 0.10 0.10 qh51 0.00 0.00 0.00 0.00 qh52 0.00 0.00 0.00 0.00 h Q5 qh53 0.00 0.00 0.00 0.00 qh61 0.00 0.00 0.00 0.00 h Q6 qh62 0.00 0.00 0.00 0.00 q212 Q32
Table 4. Weights assigned to symptoms and sampling locations Ii Importance weights for symptoms W h Weights for water samples I1 0.15 W1 0.50 I2 0.10 W2 0.20 I3 0.10 W3 0.25 I4 0.15 W4 0.05 I5 0.20 I6 0.30
Table 5. Summary of the example forensic analyses Matrices Composition operator *Likelihood to Physical C1 Likelihood to Chemical C2 Likelihood to Microbial C3 sum-prod 0.02 0.75 0.23 max-min 0.24 0.38 0.38 B1 mixed 0.08 0.67 0.25 sum-prod 0.00 0.79 0.21 max-min 0.00 0.50 0.50 B2 mixed 0.00 0.78 0.22 sum-prod 0.08 0.69 0.23 max-min 0.24 0.38 0.38 B3 mixed 0.08 0.67 0.25 sum-prod 0.08 0.74 0.18 max-min 0.24 0.38 0.38 B4 mixed 0.09 0.73 0.18 sum-prod 0.04 0.73 0.23 max-min 0.24 0.38 0.38 A mixed 0.07 0.69 0.24 b21 a2