NUCLEAR
ENGINEERING
READING ROOM:
M.I.T
NYO - 10211
MITNE - 33
ANALYTICAL AND EXPERIMENTAL INVESTIGATIONS
OF THE BEHAVIOR OF THERMAL NEUTRONS
IN LATTICES OF URANIUM METAL
IN HEAVY
WATER
by
R.Simms , I. Kaplan, T.J. Thompson., D.D. Lanning
Contract AT (30-1) 2344
U.S. Atomic E
October
Department
iergy. Commission
II,
1963
of Nuclear Engineering
Massachusetts' Institute
of Technology
Cambridge, Massachusetts.
U
RODS
."
MASSACHUSETTS INSTITUTE OF TECHNOLOGY
DEPARTMENT OF NUCLEAR ENGINEERING Cambridge 39, Massachusetts
ANALYTICAL AND EXPERIMENTAL INVESTIGATIONS OF THE BEHAVIOR OF THERMAL NEUTRONS IN LATTICES OF
URANIUM METAL RODS IN HEAVY WATER
by
R. Simms, I. Kaplan, T. J. Thompson, D. D. Lanning October 11, 1963
MITNE - 33
NYO - 10211
AEC Research and Development Report UC - 34 Physics
(TID - 4500, 20th Edition)
Contract AT(30-1)2344
DISTRIBUTION NYO-10211 MITNE-33
AEC Research and Development Report UC-34 Physics
(TID-4500, 20th Edition)
1. USAEC, New York Operations Office (Max Plisner)
2. USAEC, Division of Reactor Development (P. Hemmig) 3. USAEC, New York Patents Office (H. Potter)
4. USAEC, New York Operations Office (S. Strauch) 5. USAEC, Division of Reactor Development,
Reports and Statistics Branch
6. USAEC, Maritime Reactors Branch 7. USAEC, Civilian Reactors Branch 8. USAEC, Army Reactors Branch 9. USAEC, Naval Reactors Branch
10. Advisory Committee on Reactor Physics (E. R. Cohen)
11. ACRP (G. Dessauer) 12. ACRP (D. de Bloisblanc)
13. ACRP (M. Edlund) 14. ACRP (R. Ehrlich)
15. ACRP (I. Kaplan)
16. ACRP (H. Kouts) 17. ACRP (F. C. Maienschein) 18. ACRP (J. W. Morfitt) 19. ACRP (B. I. Spinrad) 20. ACRP (P. F. Zweifel) 21. ACRP (P. Gast) 22. ACRP (G. Hansen) 23. ACRP (S. Krasik) 24. ACRP (T. Merkle) 25. ACRP (T. M Snyder) 26. ACRP (J. J. Taylor)
27. - 29. O.T.I.E., Oak Ridge, for Standard Distribution, UC-34, TID-4500 (20th Edition)
30. - 49. R. Simms
ACKNOWLEDGMENTS
The success of the M.I T. Lattice Project has been due to the contri-butions of a number of individuals. The results of this particular report are primarily due to the work of its principal author, Richard Simms, who has submitted substantially this same report in partial fulfillment for the Ph.D. degree at M.I.T. He has been assisted by other graduate students as well as those mentioned specifically below.
Over-all direction of the project and its research is shared by Professors I. Kaplan, T. J. Thompson and D. D. Lanning. Messrs. Joseph Barch and Albert Supple have been of invaluable assistance in the setup of experiments and in the operation and maintenance of the facility. Miss Barbara Kelley has helped in the preparation of foils and in the reduction of the data.
Staffs of the M.I.T. Reactor, Machine Shop, Electronics Shop and Radiation Protection Office have provided much assistance and advice during the experimental portion of this work. Miss Rae Visminas and
Mrs. Mary Bosco have given valuable aid in the typing of this report. Dr. Henry Honeck, of the Brookhaven National Laboratory, has given much assistance in the calculational aspects of this work, a portion of which were made on the B.N.L. computer. The majority of the calcu-lations were performed at the M.I.T. Computation Center. Dr. C. N. Kelber, of the Argonne National Laboratory, was kind enough to provide a copy of a
computer program. Dr. Paul Brown, Dr. John Suich, Messrs.
Walter D'Ardenne, Phillip Kier, Sang Kyong and David McGoff have con-tributed to various portions of the research program.
All of these individuals and groups were essential to the completion
ABSTRACT
Measurements of the intracellular distribution of the activation of foils by neutrons were made in lattices of 1/4-inch diameter, 1.03% U-235, uranium rods moderated by heavy water, with bare and cadmium-covered foils of gold, depleted uranium, lutetium, europium and copper. The
measurements were made in the M.I.T. Heavy Water Lattice Facility with source neutrons from the M.I.T. Reactor. Two lattices were studied in detail in this work. The more closely packed lattice had a triangular
spacing of 1.25 inches, and the less closely packed lattice had a triangular spacing of 2.5 inches. The results of the experiments were compared to one-dimensional, 30-energy group, THERMOS calculations based on the available energy exchange kernels. The comparison indicated that the approximation that the hexagonal cell may be replaced by an equivalent circular cell (the Wigner-Seitz approximation) can lead to serious dis-crepancies in closely packed lattices moderated by heavy water. A modi-fied one-dimensional, and a two-dimensional, calculation were shown to predict the intracellular activation distribution in the closely packed lattice.
An analytical treatment of the problem of the flux perturbation in a foil was developed and compared to the experimental results obtained by using gold foils of four different thicknesses in the lattice cell; the method
was shown to be adequate. An analytical method to treat the effect of leak-age from an exponential assembly was formulated; the results indicated that only in small exponential assemblies would leakage be a significant problem in intracellular flux measurements. A method was developed to predict the cadmium ratio of the foils used in the lattice cell; comparison with available measurements with gold foils indicated good agreement
between theory and experiment, except for a lattice having very large ratios of moderator volume, to fuel volume, e.g., 100:1. Calculations of the fuel disadvantage factor by the method of successive generations for gold, lutetium and europium detector foils were compared to the results of THERMOS calculations, because THERMOS was shown to predict the experimental distributions. The comparison indicated that the method of successive generations is a good alternative to the THERMqS calculation, if all that is required is 17 and the thermal utilization.
TABLE OF CONTENTS Chapter I. 1.1 1.2 1.3 Chapter II. 2.1 2.2 2.3 2.4 2.5 2.6 2.7 Introduction
The M.I.T. Heavy Water Lattice Project The Importance of the Neutron Economy The Contents of This Report
Experimental Methods Introduction
The M.I T. Lattice Facility
Description of the Foils Used in the Experiments The Foil Holders
The Three-Rod Cluster
Counting of the Activated Foils Data Reduction
Chapter III. Analytical Methods
3.1 Methods of Solution of the Space Dependent-Transport Equation
3.2 The Energy Exchange Kernels for Heavy Water
3.3 Radial and Axial Leakage in an Exponential Assembly 3.4 Flux Perturbations for Foils in a Lattice
3.5 The Prediction of the Gold-Cadmium Ratio in a Lattice Cell
3.6 The Cell Cylindricalization Problem
3.7 The Calculation of Disadvantage Factors by the Method of Successive Generations
Chapter IV. Experimental Results and Comparison with Analytical Methods
4.1 The Experimental Results 4.2 Results for the Gold Foils
4.3 The Use of Other Detector Foils
Chapter V. Conclusions and Recommendations for Future Work
1 1 1 3 5 5 5 5 10 19 19 25 27 27 29 37 58 64 71 81 91 91 97 123 135
Appendix Appendix Appendix Appendix Appendix Appendix Appendix Appendix Appendix A. B. C. D. E. F. G. H. I.
TABLE OF CONTENTS (Concluded)
Thermal Neutron Flux Perturbation Problem Effects of Foil Interaction and Mylar Tape The QUICK Code
The ACTIVE Code
Graphite-Moderated Lattices
Data Input for Computer Calculations Nomenclature
References
Averaged Experimental Results
138 145 149 165 175 188 190 193 200
LIST OF TABLES
2.3.1 Properties of the Foils 8
3.2.1 Constants for H2 0 and D 20 32
3.2.2 Comparison of Calculated Nuclear Properties in a Lattice
of 1.01-inch Diameter, Natural Uranium Rods on a 4.5-inch
Triangular Spacing 38
3.2.3 Comparison of Calculated Nuclear Properties in a Lattice
of 1.01-inch Diameter, Natural Uranium Rods on a 5.0-inch
Triangular Spacing 39
3.2.4 Comparison of Calculated Nuclear Properties in a Lattice of 1.01-inch Diameter, Natural Uranium Rods on a 5.75-inch
Triangular Spacing 40
3.2.5 Comparison of Calculated Nuclear Properties in a Lattice
of 0.25-inch Diameter, 1.03% U-235, Uranium Rods on a
1.25-inch Triangular Spacing 41
3.2.6 Intracellular Activity Distribution Below 0.4 ev for a
1/v-Activator in a Lattice of 1.01-inch Diameter, Natural
Uranium Rods on a 4.5-inch Triangular Spacing 42
3.2.7 Intracellular Activity Distribution Below 0.4 ev for a
1/v-Activator in a Lattice of 1.01-inch Diameter, Natural
Uranium Rods on a 5.0-inch Triangular Spacing 43
3.2.8 Intracellular Activity Distribution Below 0.4 ev for a
1/v-Activator in a Lattice of 1.01-inch Diameter, Natural
Uranium Rods on a 5.75-inch Triangular Spacing 44
3.2.9 Intracellular Activity Distribution Below 0.4 ev for a
1/v-Activator in a Lattice of 1/4-inch Diameter, 1.03% U-235,
Uranium Rods on a 1.25-Inch Triangular Spacing 45
3.2.10 Intracellular Activity Distribution Below 0.4 ev for a
1/v-Activator in a Lattice of 1/4-inch Diameter, 1.03% U-235,
Uranium Rods on a 2.5-inch Triangular Spacing 46
3.3.1 Values of the Diffusion Coefficient for H20 and D20
Calcu-lated by the Nelkin Model for Slow Neutron Scattering 50
3.3.2 Calculated Values of the Thermal Diffusion Length for
the M.I.T. Lattices 54
3.3.3 Calculated Values of F(X,a) for the Axial Correction 56
3.3.4 Radial and Axial Corrected Intracellular 1/v-Activation Distribution in a Lattice of 1.01-inch Diameter, Natural
LIST OF TABLES (Continued)
3.4.1 Values of Equivalent Foil Thickness for 1/16-inch
Diameter Foils 61
3.4.2 Comparison of the Intracellular Activity Distributions for Gold Foils of Different Thickness in the Lattice of 1.03%
Enriched, 1/4-inch Diameter Rods on a 1-1/4-inch
Triangular Spacing 63
3.4.3 Comparison of the Intracellular Activity Distributions for Gold Foils of Different Thickness in the Lattice of 1.03% Enriched, 1/4-inch Diameter Rods on a 2-1/2-inch
Triangular Spacing 64
3.5.1 Resonance Parameters for Gold 67
3.5.2 Calculated Effective Resonance Integrals for Gold 67
3.5.3 Calculated Values of K exp 68
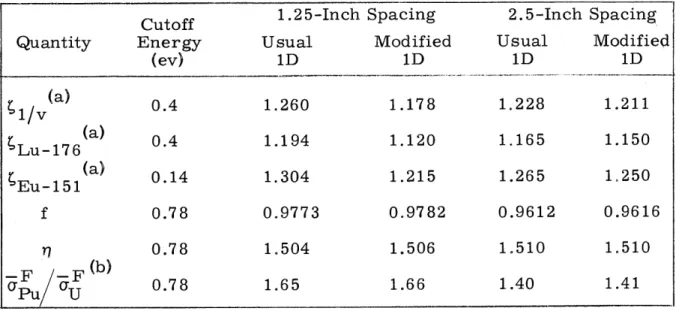
3.6.1 Comparison of Nuclear Parameters for the Lattices with the 1.25-inch and 2.5-inch Triangular Spacings Calculated
by the Usual and Modified THERMOS Methods 79 3.7.1 Fuel Disadvantage Factors for 1/v-Activators Below 0.4 ev 90 4.1.1 Summary of Intracellular Activity Distribution Measurements 92 4.1.2 Subcadmium Activity Distributions for the Experiments
in the Lattice with the 2.5-inch Triangular Spacing 95 4.1.3 Epicadmium Activity Distributions for the Experiments
in the Lattice with the 2.5-inch Triangular Spacing 95 4.1.4 Subcadmium Activity Distributions for the Experiments
in the Lattice with the 1.25-inch Triangular Spacing 96 4.1.5 Epicadmium Activity Distributions for the Experiments
in the Lattice with the 1.25-inch Triangular Spacing 96 4.2.1 Legend for the Graphs of Intracellular Activation
Distributions 97
4.2.2 Comparison of the Thermal Activities of Gold Foils
Along the Rod-to-Rod Traverse 116
4.2.3 Comparison of Predicted Values of the Cadmium Ratio at
the Cell Edge for Gold Foils with the Experimental Values 119 4.2.4 Variation with Lattice Spacing of the Gold-Cadmium Ratio
at the Cell Edge 120
4.2.5 Volume Fractions of Lattices Studied 121 4.2.6 Measurements of the Cadmium Ratio at the Cell Edge in
the Lattice of 1/4-inch Diameter, 1.03% U-238 Uranium
LIST OF TABLES (Concluded)
A.1 Comparison of Values of the Flux Perturbation Factor Calculated by Using 2200 m/sec Cross Sections and by
Assuming an Incident Maxwellian Spectrum 143
B.1 Ratios of Foil Activities for 4.3 mil Thick Gold Foils
in the Test Position of the Three-Rod Cluster 147
C.1 Effective Activation Cross Sections for 0.5 mil Thick
Gold Foils 151
C.2 Effective Activation Cross Sections for 1.0 mil Thick
Gold Foils 152
C.3 Effective Activation Cross Sections for 2.3 mil Thick
Gold Foils 153
C.4 Effective Activation Cross Sections for 2.5 mil Thick
Gold Foils 154
C.5 Effective Activation Cross Sections for 3.8 mil Thick
Gold Foils 155
C.6 Effective Activation Cross Sections for 4.3 mil Thick
Gold Foils 156
C.7 Effective Activation Cross Sections for 7.7 mil Thick
Gold Foils 157
C.8 Effective Activation Cross Sections for 10.2 mil Thick
Gold Foils 158
C.9 Effective Activation Cross Sections for 12.4 mil Thick
Gold Foils 159
C.10 Effective Activation Cross Sections for 20.6 mil Thick
Gold Foils 160
D.1 Deviations for the Counting of Gold Foils 167
F.1 Properties of the Lattices Studied 188
F.2 Thirty Energy Group Mesh Spacing Used in the
Multigroup Calculations 189
1.1 Subcadmium Activation Distribution Based on the Average of the Experiments with Gold Foils in the Lattice with the
1.25-inch Triangular Spacing 201
1.2 Subcadmium Activation Distribution Based on the Average of the Experiments with Gold Foils in the Lattice with the
LIST OF FIGURES
2.2.1 Vertical Section of the Subcritical Assembly 6
2.2.2 Plan View of the Subcritical Assembly 7
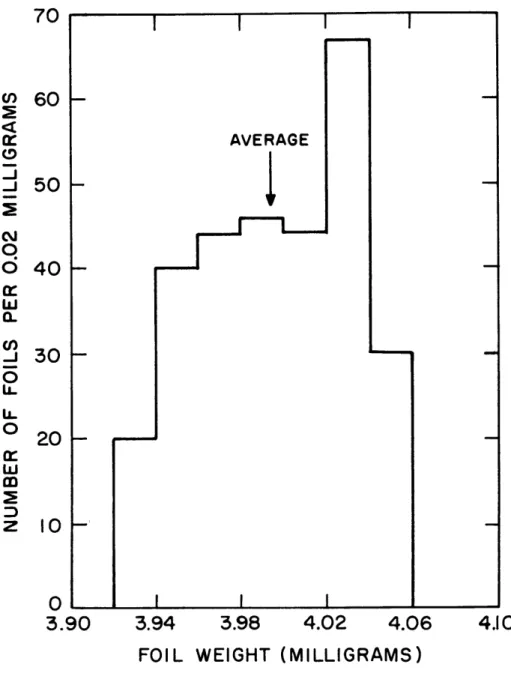
2.3.1 The Distribution of Foil Weights in the 4.3 mil Gold Foil File 9
2.3.2 Average Weight of Gold Foils as a Function of Foil Thickness 11
2.4.1 The Holder for the Foils Irradiated in the Fuel Rod Used
in the Lattice with the 2.5-inch Triangular Spacing 13
2.4.2 The Holder for the Bare Foils Irradiated in the Moderator
Used in the Lattice with the 2.5-inch Triangular Spacing 14 2.4.3 The Holder for the Foils Irradiated in the Fuel Rod Used
in the Lattice with the 1.25-inch Triangular Spacing 15
2.4.4 The Holder for the Bare Foils Irradiated in the Moderator
Used in the Lattice with the 1.25-inch Triangular Spacing 17
2.4.5 The Cadmium Box and a Section of the Holder Used to
Position the Box in the Moderator 18
2.5.1 The Three-Rod Cluster 20
2.5.2 Positions of the Foil Holders in the Experiments in the
Lattice with the 2.5-inch Triangular Spacing 21
2.5.3 Positions of the Foil Holders in the Experiments in the
Lattice with the 1.25-inch Triangular Spacing 22
2.6.1 Block Diagram of the Gamma-Ray Counting System 24
3.2.1 The Measured and Calculated Total Scattering Cross
Section of Heavy Water 31
3.2.2 Comparison of the Nelkin and Free Gas Energy Exchange
Kernels for Heavy Water for Neutrons Having an Initial
Energy, E., of 1.44 kTM 33
3.2.3 Comparison of the Nelkin and Free Gas Energy Exchange
Kernels for Heavy Water for Neutrons Having an Initial
Energy, E . of 8.4 kTM 34
3.2.4 The Calculated Thermal Neutron Spectra at the Center of a 1.01-inch Diameter, Natural Uranium Rod in a
Lattice on a 4.5-inch Triangular Spacing 36
3.3.1 The Fictitious Absorbing Region Used to Account for
Radial Leakage in the Lattice Cell 48
3.3.2 Maxwellian Average Diffusion Coefficients for Mixtures
LIST OF FIGURES (Continued)
3.3.3 Comparison of the One Group Flux with the Variation
of the Radial Buckling 53
3.4.1 Effective Activation Cross Sections for Metallic Gold Foils 62
3.5.1 Comparison of Experimental and Calculated Values of K 70
exp
3.5.2 Calculated Resonance Flux in the Region of the
Gold Resonance 72
3.6.1 Reflection of Neutrons from the Hexagonal and
Equivalent Cell Boundaries 74
3.6.2 Restrictive Paths for Neutrons in the Equivalent
Circular Cell 75
3.6.3 Reflection of Neutrons from the Square and the Inscribed
Circle Boundaries 77
3.6.4 The Reflection Law for Neutrons at the Boundary of
the Actual Cell 78
3.6.5 The Two-Dimensional Cell for the THERMOS Calculation 80
3.6.6 Comparison of the One- and Two-Dimensional THERMOS
Calculations for the Lattice of 1/4-inch Diameter, 1.03%
Enriched, Uranium Rods on a 1.25-inch Triangular Spacing 82
3.6.7 Comparison of the One-Dimensional Calculations for the
Lattice of 1.03% Enriched Uranium, 1/4-inch Diameter
Rods Arranged on a 2.5-inch Triangular Spacing 83
3.7.1 Ratio of the Activity of Gold Foils at the Surface of a
Uranium Metal Rod to the Average Activity Inside the Rod Below 0.4 ev, Calculated by the Method of Successive
Generations for an Incident Maxwellian Spectrum 86
3.7.2 Ratio of the Activity of Lutetium Foils at the Surface of a
Uranium Metal Rod to the Average Activity Inside the Rod Below 0.4 ev, Calculated by the Method of Successive
Generations for an Incident Maxwellian Spectrum 87
3.7.3 Ratio of the Activity of Europium Foils at the Surface of
a Uranium Metal Rod to the Average Activity Inside the Rod Below 0.14 ev, Calculated by the Method of Successive
Generations for an Incident Maxwellian Spectrum 88
4.1.1 Directions of Intracellular Activity Traverses in
the Moderator 94
4.2.1 Gold Activity Distribution for Run A8; Dilute Gold Foils
in the Lattice with the 2.5-inch Spacing 98
4.2.2 Gold Activity Distribution for Run A4; 2.5 mil thick Gold
Foils in the Lattice with the 2.5-inch Spacing 99
4.2.3 Gold Activity Distribution for Run A4; 2.5 mil thick Gold Foils in the Lattice with the 2.5-inch Spacing Counted by
LIST OF FIGURES (Continued)
4.2.4 Gold Activity Distribution for Run A6; 2.5 mil Thick Gold
Foils in the Lattice with the 2.5-inch Spacing 101
4.2.5 Gold Activity Distribution for Run A5; 4.3 mil Thick Gold
Foils in the Lattice with the 2.5-inch Spacing 102 4.2.6 Gold Activity Distribution for Run A5; 4.3 mil Thick Gold
Foils in the Lattice with the 2.5-inch Spacing Counted by
the Integral Method 103
4.2.7 Gold Activity Distribution for Run A7; 4.3 mil Thick Gold
Foils in the Lattice with the 2.5-inch Spacing 104 4.2.8 Gold Activity Distribution for Run A9; 10 mil Thick Gold
Foils in the Lattice with the 2.5-inch Spacing 105
4.2.9 Gold Activity Distribution for Run A9; 10 mil Thick Gold Foils in the Lattice with the 2.5-inch Spacing Counted by
the Integral Method 106
4.2.10 Gold Activity Distribution for Run A10; 10 mil Thick Gold
Foils in the Lattice with the 2.5-inch Spacing 107
4.2.11 Gold Activity Distribution for Run A17; 10 mil Thick Gold
Foils in the Lattice with the 2.5-inch Spacing 108
4.2.12 Gold Activity Distribution for Run A14; 2.5 mil Thick Gold
Foils in the Lattice with the 1.25-inch Spacing 109
4.2.13 Gold Activity Distribution for Run A15; 2.5 mil Thick Gold
Foils in the Lattice with the 1.25-inch Spacing 110
4.2.14 Gold Activity Distribution for Run A16; 4.3 mil Thick Gold
Foils in the Lattice with the 1.25-inch Spacing 111 4.2.15 Gold Activity Distribution for Run All; 4.3 mil Thick Gold
Foils in the Lattice with the 1.25-inch Spacing 112 4.2.16 Gold Activity Distribution for Run A12; 10 mil Thick Gold
Foils in the Lattice with the 1.25-inch Spacing 113
4.2.17 Gold Activity Distribution for Run A13; 10 mil Thick Gold
Foils in the Lattice with the 1.25-inch Spacing 114 4.3.1 Copper Activation Distribution for Run CUl; Copper Foils
in the Lattice with the 1.25-inch Spacing 124 4.3.2 Subcadmium Depleted Uranium Activation for Run DU3;
Depleted Uranium Foils in the Lattice with the 1.25-inch
Spacing 125
4.3.3 Epicadmium Depleted Uranium Activation for Run DU3 126
4.3.4 Subcadmium Depleted Uranium Activation for Run DU4; Depleted Uranium Foils in the Lattice with the 1.25-inch
Spacing 127
LIST OF FIGURES (Concluded)
4.3.6 Epicadmium Depleted Uranium Activation for Run DU2; Depleted Uranium Foils in the Lattice with the 2.5-inch
Spacing 129
4.3.7 Lutetium Activation Distribution for Run L4; Lutetium
Alloy Foils in the Lattice with the 1.25-inch Spacing 130
4.3.8 Lutetium Activation Distribution for Run L5; Lutetium
Alloy Foils in the Lattice with the 1.25-inch Spacing 131
4.3.9 Lutetium Activation Distribution for Run L2 and L3;
Lutetium Alloy Foils in the Lattice with the 2.5-inch Spacing 132
A.1 Maxwellian Average Flux Perturbation Factor for
Detector Foils 142
A.2 Comparison of Theory and Experiment for the Flux
Perturbation of Gold Foils in H20 144
B.1 Top View of the Foil Holder for the Perturbation
Experiments in the Moderator 146
E.1 Comparison of Parks' Kernel with the Free Gas Kernels
for an Initial Energy of 0.04 kTM 176
E.2 Comparison of Parks' Kernel with the Free Gas Kernels
for an Initial Energy of 3.9 kTM 177
E.3 Comparison of Parks' Kernel with the Free Gas Kernels
for an Initial Energy of 14.8 kTM 178
E.4 Intracellular Dysprosium Foil Activation Distribution
for the BNL Graphite Reactor Lattice 180
E.5 Calculated Neutron Spectra at the Center of the Cell
for the BNL Lattice 181
E.6 Calculated Neutron Spectra at the Air-Moderator
Interface for the BNL Lattice 182
E.7 Calculated Neutron Spectra at the Cell Boundary
for the BNL Lattice 183
E.8 Intracellular Manganese Wire Activation Distribution for
the GLEEP Lattice with the 1.5-inch Channel Diameter 184 E.9 Intracellular Manganese Wire Activation Distribution for
the GLEEP Lattice with the 2.0-inch Channel Diameter 185
E.10 Intracellular Manganese Wire Activation Distribution for
the GLEEP Lattice with the 2.75-inch Channel Diameter 186
E.11 Intracellular Manganese Wire Activation Distribution for
the GLEEP Lattice with the 3.75-inch Channel Diameter 187
1.1 Subcadmium Activation Distribution Based on the Average of the Experiments with Gold Foils in the Lattice with the
1.25-inch Triangular Spacing 203
1.2 Subcadmium Activation Distribution Based on the Average of the Experiments with Gold Foils in the Lattice with the
1
CHAPTER I INTRODUCTION
1.1 THE M.I.T. HEAVY WATER LATTICE PROJECT
The Department of Nuclear Engineering of M.I.T. with the support of the United States Atomic Energy Commission, has undertaken a pro-gram of experimental and theoretical studies of the physics of D2
0-moderated lattices of slightly enriched uranium rods. The emphasis so far has been on the development of techniques that may lead to a better understanding of reactor lattices. The work of the M.I.T. Heavy Water
Lattice Project has been summarized in several reports (T3, K1, K9, M2,
P1, W3,_W5, P5, B14).
1.2 THE IMPORTANCE OF THE NEUTRON ECONOMY
One of the major problems in the design of a nuclear reactor is that of the neutron economy. Neutrons can react with fertile and fissionable materials in a reactor core at all energies, and a quantitative understand-ing of these reactions is required to specify the design of the reactor. For a large class of reactors, the majority of fissions occur at energies in the neighborhood of the energy corresponding to the moderator temperature, so that these reactors are called "thermal." The lattices investigated by M.I.T. fall into this category. To achieve economic power, it is necessary to predict reactor criticality, core power distribution, core lifetime and the production of fissionable material (conversion or breeding). These quantities depend on the reaction rates of neutrons with the materials of the core, and a knowledge of the neutron economy is required to predict them.
It has become necessary in the past few years, because of increased design requirements, to re-evaluate the methods, both analytical and
experimental, that pertain to the study of the neutron economy. The avail-ability of improved electronic equipment and of digital computers has made possible more precise evaluations of the methodology of reactor
2
physics measurements and calculations. The demands imposed on both the experimental and theoretical methods have become more stringent as reactor design becomes more nearly competitive with conventional power sources. There is, therefore, an incentive to improve the methods in order to reduce the experimental uncertainty and to uncover systematic errors in these methods. Recent reviews by Kaplan (K9) and Crandall
(C10, C11) discuss the present status of the methods used to measure and
calculate the reactor parameters related to the study of the neutron economy. They each conclude that there still remain areas for improve-ment in both the experiimprove-mental and theoretical methods.
As examples of this type of research, we may cite recent work at the Brookhaven National Laboratory, the Savannah River Laboratory and the Chalk River Laboratory. Measurements involved in our understand-ing of the capture of resonance neutrons in uranium are receivunderstand-ing much attention. Thus, Arcipiani, Ricabarra and Ricabarra (Al) have studied the methods used to measure the U238 cadmium ratio, which is related to the plutonium production in a reactor. They obtained a systematic difference in the cadmium ratio of about 3%, depending on whether or not the foils they used were homogenized (by dissolving them) before they
were counted. Tassan(T5) has considered the measurement of the cadmium ratio of U2 3 5 fission in lattices of slightly enriched uranium rods moder-ated by H 20. He indicates that there is a discrepancy between conversion
2 238
ratios deduced from U and gold cadmium ratio measurements and those deduced from U238 and U2 3 5 cadmium ratio measurements. Tunnicliffe et al. (T6) have developed a method for the determination of the relative initial conversion ratio based on the coincidence method of neptunium,
which has a precision of ± 1/2%. The measurement of the material buckling has also been critically examined. Hellens and Andersen (H4) have studied
in great detail the methods used to measure the material buckling in H 20-moderated lattices, and have reported that a difference exists between the
1variable loading" method and the "flux shape" method used to obtain the
material buckling of exponential assemblies. Graves (G4) has considered the problem of inferring the material buckling by the "substitution technique" and concludes that the analytical methods presently used "gave satisfactory
results in all cases."
3
way to investigate the methods for possible systematic errors as they may apply to D 20-moderated lattices. This report deals with the results of one such study of the experimental and theoretical methods of analyzing the behavior of thermal neutrons in the lattice cell.
1.3 THE CONTENTS OF THIS REPORT
From the standpoint of reactor design, the quantities of interest in the thermal energy range are the thermal utilization, f (the ratio of captures in the uranium to the captures in the cell in the thermal energy range), and the number of fast neutrons produced per thermal neutron captured in uranium, 17. It is not possible to measure these quantities directly, but
experiments can be made that yield enough information so that 77 and f can be inferred from them with some confidence. This report deals with the kind of experiment made to infer the thermal utilization; it involves the measurement of the intracellular distribution of the activation of bare and cadmium-covered foils in a lattice cell. In a lattice cell, the neutron flux is a function of position and energy. The variation with position is
observed by using foils that are small enough to obtain the fine structure of the activation distribution. The variation with energy is observed by performing several separate experiments, each experiment with a set of foils having an activation cross section different, as a function of energy, from the cross sections of the other sets of foils. This technique yields only an integral index of the energy spectrum. The objective of the ana-lytical methods is to predict these activation distributions. Since the experiments give, at best, only integral properties of the neutron flux, they are not absolute tests of the theoretical methods. However, a valid prediction by a theoretical method gives added confidence in its future use.
Brown (B14) has reviewed several of the methods used to "measure" the thermal utilization of a lattice cell. The more precise analytical
methods used to predict the activation distribution are discussed in Chapter III; these methods have been programmed for use with digital computers. Neutrons in a lattice cell can diffuse through, and be scattered
by, the moderator. A description of the scattering process forms the basis
of the study usually called "Neutron Thermalization." Several reviews of this subject are available; among them are those of Cohen (C8), Hurwitz and Nelkin (H16), Nelkin and Cohen (N2), Amaldi (A3) and Nelkin (N5).
4
Because of the chemical binding between the atoms of the moderator, the scattering centers may not accurately be treated as free, monotomic gases. When the scattering process has been defined analytically, it is necessary to calculate the spatial dependence (transport) of the neutrons in the cell. Honeck (H14) has provided a good summary of the methods that are
presently available for both the calculation of the scattering kernel and the calculation of the spatial dependence.
Chapter II of this report discusses the methods used to measure the intracellular activation distributions in lattices of 1/4-inch diameter,
1.03% U2 3 5 , uranium rods moderated by heavy water. Chapter III deals with the analytical methods used to calculate the activation distributions. The results of the experiments and the calculations are discussed in Chapters IV and V. The appendices are intended to implement the dis-cussions of the text. Included in the report are disdis-cussions of energy exchange kernels, transport methods, leakage effects, flux perturbation effects, and the cell cylindricalization problem. The experiments were made to investigate various aspects of the problems discussed in
5
CHAPTER II
EXPERIMENTAL METHODS
2.1 INTRODUCTION
In this chapter, the experimental techniques used to measure the intracellular activation distributions in reactor lattices are discussed. The lattices studied were made up of 1/4-inch diameter, 1.03% U235 uranium metal rods on 1.25- or 2.5-inch triangular spacing in a 3- or
4-foot diameter, exponential tank and moderated by 99.8 atom % D 20.
The height of the active fuel was 4 feet. Additional information on the details of the lattices is given in Appendix F. The experiments required the preparation of detector foils, the development of foil holders and
cadmium covers, and the establishment of procedures for counting and data reduction.
2.2 THE M.I.T. LATTICE FACILITY
The intracellular activation distributions were measured in the M.I.T. Heavy Water Lattice Facility. Cross-sectional drawings of the facility are shown in Figs. 2.2.1 and 2.2.2. The facility consists of an exponential tank located above a graphite-lined cavity. Source neutrons for the exponential tank are reflected upward, by the cavity arrange-ment, from the MITR thermal column. The details of the cavity arrangement are discussed by Madell et al. (M2). The M.I.T. Heavy Water Lattice Facility has been described in previous reports (T3, K1).
2.3 DESCRIPTION OF THE FOILS USED IN THE EXPERIMENTS
Nine sets of 1/16-inch diameter foils were used in the experi-ments; the relevant properties of the foils are listed in Table 2.3.1. The foils, metal or alloy, were punched from a sheet of the appropri-ate mappropri-aterial by means of a punch and dye. The dye was made to fit the punch closely, and was heat treated. The foils were examined and found to be almost free from burrs. They were weighed individually on a Fisher precision microbalance (Model 1-912); the scale was read
72" TANK 48" TANK
FUEL ROD DUMP LINE
CORE-
--STEEL SHIELDING DOORS
BORAL LINING
GRAPHITE REFLECTED HOHLRAUM
LIFTING EYE NOTCHED GIRDER UPPER ADAPTOR
FUEL ROD SECTION
72" TANK CONNECTIONS
CONTROL ARM DRIVE
8
TABLE 2.3.1
Properties of the Foils
Average(a)
(b)
No. of Weight Range Thickness
Foil Set Foils (mg) (mg) (mils)
Dilute Gold 300 0.406± .07% 0.023 3.0± 0.1
(1% gold in 3 mil Al)
2.5 mil Gold 300 2.225± .11% 0.179 2.5± 0.1 (metallic, 99.97% pure) 4.3 mil Gold 300 3.995± .05% 0.125 4.3± 0.1 (metallic, 99.97% pure) 10.2 mil Gold 600 9.497 ± .0 2% 0.201 10.2 ± 0.1 (metallic, 99.97% pure)
5 mil Depleted Uranium 300 3.851 ± .30% 0.868 5.0 ± 0.3
(metallic, 18 ppm U-235)
Lutetium Alloy 300 1.430± .06% 0.065 10.0 ± 0.2 (10 w/o Lu 203 in 10 mil Al)
5 mil Copper 70 3.324 .10% 0.213 5.0 ± 0.2
(metallic)
Lutetium Powder 200 -
-(Lu203-glyptal on 5 mil Al)
Europium Powder 200 -
-(Eu20 3 -glyptal on 5 mil Al)
(a) The standard deviation from the mean is given.
(b) The range is the maximum weight difference between any two foils
in the set.
to the nearest microgram. The uncertainty for a single weighing was ±0.004 mg, as established by the repeated weighing of a single foil.
The foils, in sets of 300, were arranged in increasing order of weight and stored in a foil file. Each foil was assigned a number, and a record of the weights of the foils was punched in IBM cards. Since each experiment required no more than 70 foils, the weight corrections applied were always small. The distribution of weights for the set of 4.3 mil gold foils is given in Fig. 2.3.1. After an experiment, the foils were returned to the file, the numbering system being maintained, and were used again after at least 10 half-lives in time had elapsed. After
10 half-lives, the activity of a foil decreases to about 0.1% of its original
AVERAGE
3.94 3.98
4.02
4.06 FOIL WEIGHT (MILLIGRAMS)FIG. 2.3.1 THE DISTRIBUTION OF FOIL WEIGHTS IN THE 4.3 MIL GOLD FOIL FILE. 70 U)
0
cr
0 -0
w
z
60
50
40
30
20
10
3.904.10
I I II
I
I
10
The thickness of a sheet from which foils were punched was measured with a micrometer at several positions; average values of the foil weights are listed in Table 2.3.1. The uncertainty in thickness was approximately
±0.1 mils for the gold foils. Each sheet was also weighed and the thickness
calculated from the known density and dimensions; the result was found to agree with the measured thickness, within the uncertainty of the measure-ments.
Since the foils were all punched with the same punch and dye, there should be some correlation between the measured weight and thickness. Figure 2.3.2 indicates that the weight was proportional to the thickness. If it is assumed that there were no burrs on the foils, the line from the
origin to the best known point, that for the 10 mil gold foils, provides a way of determining the thickness of the thinner foils from their weights. With the assumption that the 10 mil gold foils were perfect right circular
cylinders, the diameter of the punch was calculated from the density of gold and the thickness of the sheet; the nominal punch diameter was
1/16 inch, while the calculation gave 0.060 inch, indicating that the punch
was slightly undersized. A measurement of the diameter with a microme-ter gave the diamemicrome-ter as 0.059 ± 0.001 inch, but this result should not affect the interpretation of the experiment.
The powder foils of lutetium and europium were fabricated and inter-calibrated on a flux wheel by Brown (B14). In the calibration experiment the foils were irradiated in a tank filled with heavy water, and counted on the gamma-ray counter used in the experiments. The counting uncertainty was about one per cent.
2.4 THE FOIL HOLDERS
The small diameter of the rods and the small lattice spacings made the accurate positioning of the foils difficult. The foil holders used were improved with time, so that those used in the experiments in the lattice with the 2.5-inch triangular spacing differed from those used in the lattice with the 1.25-inch triangular spacing. The differences were minor so far as nuclear properties are concerned, but made the experiment easier to do.
8
6-
4-
2-o L0
FOIL THICKNESS (MILS)
FIG. 2.3.2 AVERAGE FUNCTION
WEIGHT OF GOLD FOILS AS
A
OF FOIL THICKNESS. 10 cf) 0 0
-w
2 4 6 8 1012
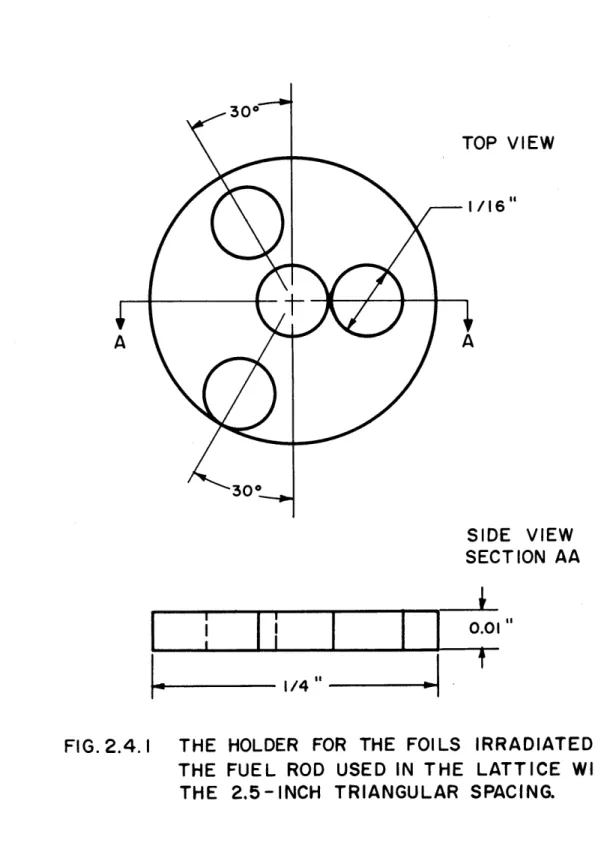
2.4.1 THE LATTICE WITH THE 2.5-INCH TRIANGULAR SPACING The holder used for the bare and cadmium-covered foils irradiated in the fuel rod is shown in Fig. 2.4.1. The foils were placed in holes punched in a 1/4-inch diameter, 10 mil thick foil of 1.03% enriched uranium. To hold the foils in place, each side of the 1/4-inch foil was taped with mylar tape, 2 mils thick. The tape also served to prevent contamination of the foils by fission products. The effect of the mylar was found to be negligible (see Appendix B).
A schematic diagram of the foil holder used in the moderator is
shown in Fig. 2.4.2. The bare foils irradiated in the moderator were placed in 1/16-inch holes milled in 12 mil thick aluminum holders, and were held in place by mylar tape. Brown (B14) has made experiments that indicate that this thickness of aluminum perturbs the flux by less than 0.3%. The foil holder was held fast to the rods of the three-rod cluster by wrapping the attached tabs around the rods and taping them in place with mylar tape. This procedure provided additional rigidity in the positioning of the three rods of the cluster.
Foils irradiated in the moderator were covered with cadmium (20 mils) by putting them in cadmium pill boxes, which were placed in 1/8-inch diameter holes milled in a 12 mil thick aluminum holder.
The boxes were taped to the holder with mylar tape, and the foil holders were attached to the rods by means of the tabs.
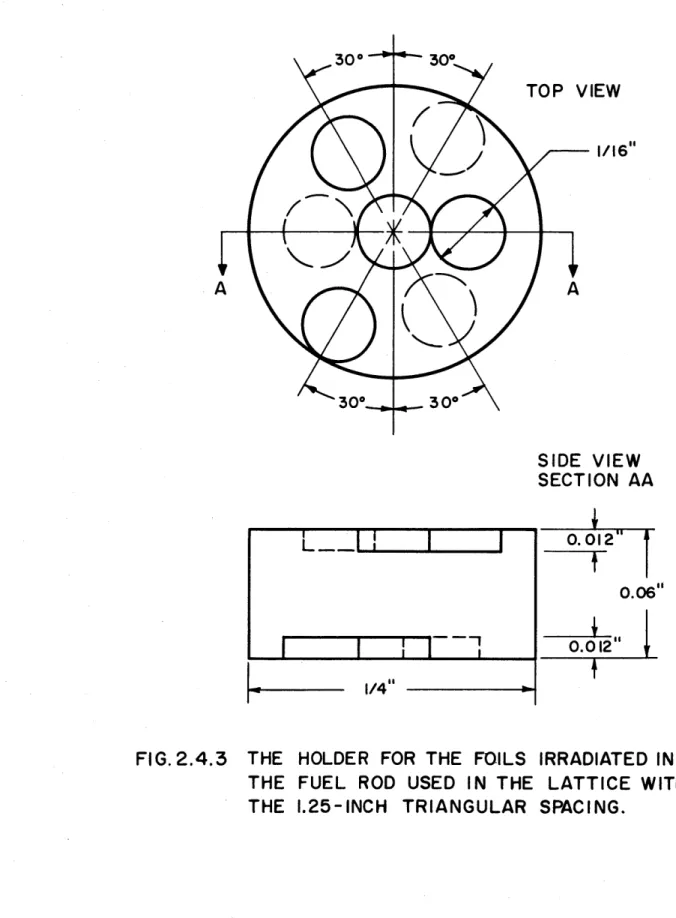
2.4.2 THE LATTICE WITH THE 1.25-INCH TRIANGULAR SPACING Because of the smaller spacing in this lattice, and the consequent greater importance of the positioning, the foil holders were improved. The foils irradiated, bare or cadmium-covered, in the rod were placed in 12 mil holes milled on both sides of 1.03% U235 uranium button,
60 mils thick and 1/4 inch in diameter, as shown in Fig. 2.4.3. An
aluminum foil, one mil thick, was placed in the hole first to prevent contamination of the foils by fission products from the uranium button. The aluminum foils were counted and their activity was found to be negligible in comparison to the background. The foils were held in the uranium button with mylar tape, trimmed to the 1/4-inch diameter of
the button. The mylar tape also served to prevent fission products from the uranium rod from contaminating the foils.
TOP VIEW
1 /6 "
SIDE VIEW SECTION AA
0.01"
FIG. 2.4.1 THE HOLDER FOR THE FOILS IRRADIATED IN THE FUEL ROD USED IN THE LATTICE WITH
THE 2.5-INCH TRIANGULAR SPACING.
11
1/4 "
I I
TOP VIEW
CLAD
FOILS
CENTER ROD
TABS
FI G. 2.4.2 THE HOLDER FOR THE BARE FOILS IRRADIATED IN THE MODERATOR USED IN THE LATTICE WITH THE 2.5-INCH TRIANGULAR SPACING.
TOP VIEW A A 30* 30* SIDE VIEW SECTION AA 0.012 0.06" 0.012 1/4
FIG. 2.4.3 THE HOLDER FOR THE FOILS IRRADIATED IN THE FUEL ROD USED IN THE LATTICE WITH THE .25-INCH TRIANGULAR SPACING.
16 The holders for the bare foils were fabricated from 12 mil thick aluminum machined with 1/16-inch holes as shown in Fig. 2.4.4. Mylar tape was used to hold the foils in position. The sides of the holder in a line tangential to the outer diameter were bent through 90* to provide the holder with additional rigidity along the rod-to-rod line. In an experi-ment, a holder was clipped onto the rods of the three-rod cluster and a strip of mylar tape was used to hold the foil holder to the cluster.
The holders for the cadmium-covered foils were made from 18 mil thick aluminum. Each cadmium pill box was placed in an 1/8-inch hole milled in the holder, recessed 10 mils deep in a 5/32-inch hole centered in the 1/8-inch hole as shown in Fig. 2.4.5. The boxes were permanently fixed in position with epoxy resin, and the foils could be loaded and
unloaded without removing the boxes from the holder. Except for the sizes of the holes milled, the holders for the cadmium-covered foils were the same as those used for the bare foils.
2.4.3 THE CADMIUM BOXES
It was required that the cadmium boxes for the foils be leak-tight to water and to thermal neutrons, and that the foils could be removed easily, without damage to the foil or the box. After considering several designs, it was decided to use the rivet-like design shown in Fig. 2.4.5.
A sheet of cadmium, 60 mils thick, was taped to an aluminum backing
block with two-sided tape. The aluminum block was clamped in a milling machine and a number of pill boxes machined at once. Depressions,
1/32 inch in diameter, were milled in the wall of the box to provide an
easy way to pry off the cover. An 1/8-inch inside diameter trepan tool (a hollow mill) was used to mill the outer diameter of the cadmium pill,
50 mils deep. The final rivet-like cadmium pill box was obtained by
punching the pill from the sheet with a special punch having a hollow center and an outer diameter of 5/32 inch.
Covers for the boxes were punched from a 20 mil sheet of cadmium with a 3/32-inch punch. No attempt was made to reuse the covers. The cadmium boxes epoxied to the holders were intact at the completion of all the experiments.
A box was filled with an indicator dye and dropped into a beaker of
TOP VIEW
CLAD
FOLD ALONG THE
CENTER ROD
FIG.2.4.4 THE HOLDER FOR THE BARE FOILS IRRADIATED IN THE MODERATOR USED IN THE LATTICE WITH THE 1.25-INCH TRIANGULAR SPACING.
CADMIUM BOX (SIDE VIEW)
CADMIUM BOX (TOP VIEW)
1/32" DIAMETER
FIG. 2.4.5 THE CADMIUM BOX USED TO POSITION
AND A SECTION OF THE HOLDER THE BOX IN THE MODERATOR.
HOLDER
19
so that the requirement that the box be leak-tight to water was met. Cadmium ratio experiments were made in a thermal flux to deter-mine if the cadmium boxes were leak-tight to thermal neutrons. Bare and cadmium-covered foils from the 4.3 mil gold foil file were irradiated in the cavity (see Fig. 2.2.1) and the cadmium ratio was found to be 600± 10%. Although the experiment does not yield absolute proof that the cadmium
boxes do not leak, the value of the cadmium ratio agrees with values obtained in other experiments, with gold foils of different diameters and different cadmium boxes, made by D'Ardenne (D1).
2.5 THE THREE-ROD CLUSTER
The foil holders described in Section 2.4 were loaded in the expo-nential tank in the three-rod cluster shown in Fig. 2.5.1. The foils irradi-ated in the fuel were loaded into the central rod. With the exception of the measurement involving the dilute gold foils, the same positions in the rod were occupied by the foil holders relative to the active fuel height.
Figures 2.5.2 and 2.5.3 show the positions occupied by the foil holders. In the experiments in the lattice with the 2.5-inch spacing, only one type of foil was used per experimental run. As a result of the improve-ments in the experimental technique, the experiimprove-ments in the lattice with the
1.25-inch spacing involved the use of two types of detectors per run. All experiments were repeated at least once. The experiments in each lattice were completed with the original sets of foil holders, thus attesting to the durability of the holders.
2.6 COUNTING OF THE ACTIVATED FOILS
In these experiments, y-counting was used in preference to
p-counting. For 1/16-inch foils, it is doubtful that a weight correction would be meaningful for
p-counting.
The count rate for p-counting is due top-sources near the surface of the foil, because of the short range of p-particles in the metal foil. Any imperfections in the surface of the foil affect the
count rate so that the foils would have to be calibrated on the p-counter. The y-counting technique was free from these disadvantages and was used
exclusively.
A Nuclear-Chicago automatic sample changer with a 1/2-inch
CENTER
ROD
HOLDER
BARE
FOILS
CADMIUM
SLEEVE
HOLDER
FOR THE
CADMIUM
COVERED
FOILS
FOIL HOLDER (10 MILS)-N
1% U2 3 5 SPACER (5
MILS)-FOIL HOLDER (10
MILS)--URANIUM ROD 1100 ALUMINUM 1/16" FOILS
I,
HOLDER FOR THE BARE FOILS
CAUMIUM (20 MILS)
60 MIL NAT'LU -FOIL HOLDER (10
MILS)-1%U2 3 5 SPACER (5 MILS)
FOIL HOLDER (10 MILS)-60 MIL NAT'L U
CADMIUM (20
MILS)---CADMIUM BOX
'HOLDER FOR THE CADMIUM COVERED FOILS
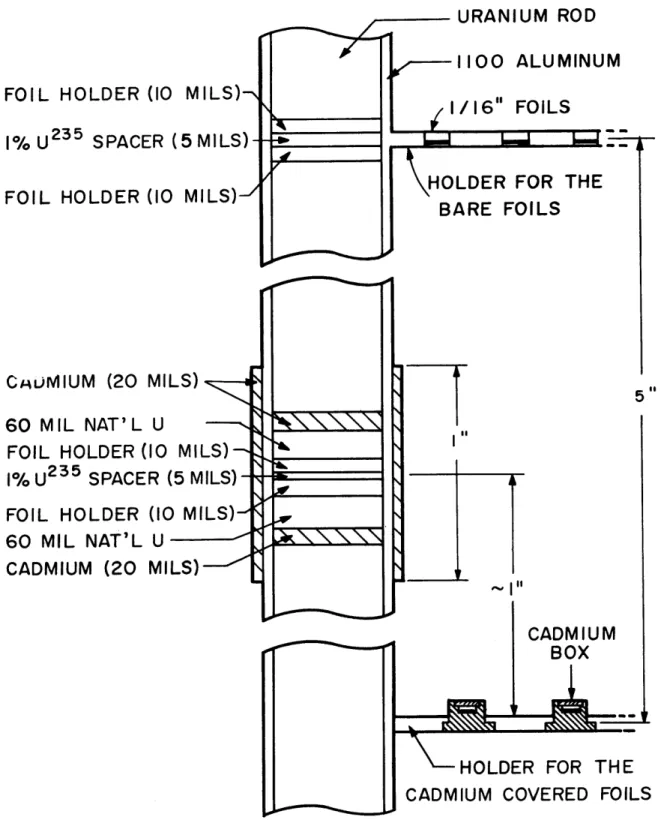
FIG. 2.5.2 POSITIONS OF THE FOIL HOLDERS IN THE EXPERIMENTS
IN THE LATTICE WITH THE 2.5-INCH TRIANGULAR SPACING. 5 "f O
FOIL HOLDER (60 MILS)
FOIL HOLDER (60 MILS)
CADMIUM (20 MILS) d
1% U2 3 5 SPACER (60 MILS) FOIL HOLDER B (60 MILS)
-I%U 2 3 5SPACER (60 MILS)
FOIL HOLDER A (60 MILS)
-1% U2 3 5SPACER (60 MILS)
-CADMIUM (20
MILS)-FOILS
TEST POSITION
FIG. 2.5.3 POSITIONS OF THE FOIL HOLDERS IN THE EXPERIMENTS IN THE LATTICE WITH THE 1.25-INCH TRIANGULAR SPACING.
23
counting equipment is shown in Fig. 2.6.1. The single-channel analyzer was used for both differential and integral counting. The system was calibrated each time a run was counted.
The cadmium-covered foils were counted separately from the bare foils. Monitor foils were used to estimate the counter drift. The time correction for decay based on the monitor foils was within 0.5% of the correction calculated from the half-life and the elapsed time. By sepa-rating the two sets of foils when counting, it was possible to minimize the contribution to the count rate of the foils in the stack that were out of the counting chamber.
The preset count setting was adjusted so that a counting time of
5 to 10 minutes was obtained for most of the foils. The printer records
the counting time to the nearest 0.01 minutes, so that a 5-minute counting time is needed to reduce the error below 0.2%. Since the timing is based on the 60 cycle per second line voltage, any variation in the voltage cycles
could introduce errors in timing. The Cambridge Electric Light Company gives the variation of the voltage as ±1/20 cps, 95% of the time and
±1/10 cps, 5% of the time. Hence, the maximum error introduced by the
variation in the voltage is ±0.2%.
When possible, several passes were made for the foils in any given run to spread any counter drift over all the foils. For example, it seemed more desirable to count the foils for a total of 100,000 counts in five
passes, at 20,000 per pass, rather than one pass at 100,000.
2.6.1 GOLD
Neutron activation of gold yields Au198, with a half-life of 2.7 days. The principal gamma radiation is a 412 key gamma ray. Both integral and differential counting methods were used; the results indicated no sig-nificant differences between the two methods. The differential method used was to straddle the 412 key photopeak with a window width corre-sponding to 90 key. The particular crystal used in the experiments had a full-width at half-maximum of 70 key. The integral method used was to set the base line at 320 key, the lowest point of the gamma spectrum just below the 412 key photopeak. The window was opened so that all gamma rays above 320 key could be counted.
Nal (TI) DETECTOR 1/2" x I 1/2" DIA. I I PHOTOMULTIPLI ER RCA/6342A HIGH VOLTAGE SUPPLY BA /312 A LINEAR AMPLIFIER BA / 215 SINGLE CHANNEL ANALYZER BA!/ 5 10 BA (BAIRD ATOMIC)
RCA (RADIO CORPORATION OF AMERICA)
NC (NUCLEAR CHICAGO)
I1
PRINTER NC/l lB
BLOCK DIAGRAM OF GAMMA COUNTING
V
SCALER NC/ 186 -4 SYSTEM. F IG. 2.6.125
2.6.2 LUTETIUM
After a cooling period of 48 hours, the 6.7-day Lu was counted with the integral method. The base line was set at 45 key, just below the
57 key Hf X-ray peak (B14). The window of the analyzer was opened so
that all gamma rays above 45 key could be counted.
2.6.3 EUROPIUM
The 9.2-hour half-life Eul52 was counted with the integral method. The base line was set at 80 key, just below the 122 key Sm152 peak (B 14). The window of the analyzer was opened so that all gamma rays above
80 key could be counted.
2.6.4 DEPLETED URANIUM
The 103 key peak of the 2.3-day Np239 was straddled with a window width corresponding to 30 key. This procedure was used by Weitzberg (W3). For the purpose of obtaining backgrounds, unirradiated depleted uranium foils were counted in various positions in the foil stack of the automatic sample changer.
2.7 DATA REDUCTION
The data reduction was accomplished with the aid of an IBM 7090 computer, with the ACTIVE code described in Appendix D. The use of the computer program insured that the calculations could be repeated and that storage could be provided for the raw experimental data. The ACTIVE code was designed for operation with the foil files discussed in Section 2.3 and with the automatic sample changer described in Section 2.6. Routine corrections were made by the code for background, counter dead time, decay during counting, decay from an arbitrary time and the weight of the foil.
For the intracellular activation experiments, a height correction factor was used to correct the activities of the cadmium-covered foils to activities corresponding to the height of the bare foils in the lattice. The corrections were based on the axial flux distributions measured by Kim
(K4) and by Harrington (H3). The results of these axial buckling experi-ments indicated that the cadmium ratio for gold foils was constant in the region in which the intracellular measurements were made.
26
The experimental data were corrected for radial leakage by multi-plying each experimental activity by a J0-correction factor, based on the radial flux distribution measured in the buckling experiments by Kim (K4) and Harrington (H3). The number of cells along a radius of the exponential tank was large enough so that the greatest correction was less than 3%.
27
CHAPTER III
ANALYTICAL METHODS
3.1 METHODS OF SOLUTION OF THE SPACE-DEPENDENT TRANSPORT EQUATION
The analytical methods needed for the interpretation of the intra-cellular activation measurements are developed and discussed in this chapter. The comparison with experiment will be made in Chapter IV.
To predict the subcadmium, intracellular, activation distribution, it is necessary to be able to calculate the directional flux as a function of energy and position in the lattice cell. Several computer programs have been developed to treat the problem numerically, and the more use-ful ones will be reviewed.
The energy exchange kernel will be considered arbitrary; that is, only the spatial part of the calculation will be discussed in this section. The choice of a computer program depends on the amount of computer time that one is willing to spend; the more nearly exact the method, the longer the computer time required. Probably the most rapid method developed so far for computing space-dependent spectra for lattice cells is the variational method used as the basis for the SWAKRAUM code developed by Calame and Federighi (C1, C2). By using a non-self-adjoint variational method, the P1 spherical harmonic multigroup equations (W2) are reduced to a few coupled Helmholz equations, the number depending on the number of trial spectra chosen. The space-dependent neutron spectrum is taken as a linear combination of the trial spectra. The coef-ficients of the linear combination are determined from the variational condition for a stationary absorption rate. The present version of SWAKRAUM includes an option for treating the spatial calculation in double spherical harmonic expansion (Y2, Z1) of order unity (double-P 1 )
or P3 for slabs. Further work on the variational method has been done
by Buslik (B15). The basic weakness with the variational method is that
28
An alternative to the variational method involves the direct, iter-ative solution of the multigroup P1 equations; ULCER (R1) and SLOP-1 (B9) are good examples of the use of multigroup diffusion theory. The
SLOP-1 code has an option for the double-P 1 or P3 approximations in
slabs, but the treatment for cylinders is restricted to diffusion theory. Little incentive exists for extending the spherical harmonic treatment beyond the P1-approximation for cylinders.
The TET code (D4) offers the desired degree of transport approxi-mation for slabs. The code incorporates a form of the discrete ordinate method (G3) in that it uses six quadrature angles in the forward and in the backward directions. This order of approximation is considered to be equivalent to a double-P 5 approximation. Eventually, the code will
incorporate terms up to the P3-scattering term, with a P3 -source; but
the method is not likely to be extended to cylinders in this form.
The Sn method developed by Carlson (C3, C4) has received much attention in recent years. This method can be considered to be a form of a discrete ordinate solution to the transport equation. It has been reported that a version of the SNG code, in the S8-approximation for
cylinders, has been used with good results (Ml). Another version of the method has been extended to include the effects of anisotropic scattering up to the P3-scattering component of the energy exchange kernel (A2).
The integral transport method has been programmed by Honeck as the basis of the THERMOS code (H8). The program treats slabs and
cylinders with the assumption that the scattering is isotropic in the labo-ratory system. For slabs, Honeck has extended the method to include the effects of the P1-scattering component of the energy exchange kernel
(H9, H12).
The Monte Carlo method probably offers the most nearly exact
method of solution. The accuracy depends on the number of case histories considered and, therefore, depends on the computer time used; TRAM (P6) is a good example of a computer program based on this method.
In most of the calculations discussed in this report, the THERMOS code has been used because of its proven usefulness (B12, B13) and the possibility of close cooperation with the Reactor Theory Group of the Brookhaven National Laboratory, where Honeck is developing the method further. Only the details of the method relevant to the work are considered;
29 for a more detailed discussion, the published literature should be consulted
(H5, H6, H7).
The THERM@S calculation involves a direct, numerical solution of the integral Boltzmann equation for cylinders. It is assumed that the flux is independent of the axial position and that the boundary of the cylindrical cell is perfectly reflecting. The cell is divided into concentric regions, with a maximum of 20 permitted, because of computer storage require-ments. Thirty thermal energy groups are considered. The source of thermal neutrons in the cell is usually taken to be that from a spatially flat, 1/E-distribution above 0.78 ev. The scattering is assumed to be isotropic, but the scattering kernel is arbitrary. The program reads the cross section information from a magnetic tape, thus eliminating the necessity for generating an energy exchange kernel each time a new problem is considered, and reducing the chance of errors due to the han-dling of punched cards. The final solution involves a direct iterative procedure until the scalar flux, *(E,r), converges.
3.2 THE ENERGY EXCHANGE KERNELS FOR HEAVY WATER
The purpose of this section is to investigate the sensitivity of the spatially-dependent energy spectrum to the scattering model used. Infor-mation concerning this dependence should be helpful in the interpretation
of the intracellular flux traverses. The energy exchange kernel involves the details of the scattering probability for neutron transfer from any initial energy to any final energy when the neutron interacts with a
moder-ator molecule.
The development of the theory began with the work of Wigner and Wilkins (W4). Assuming that the atoms of the molecule can be treated as
free, monotomic gas atoms, they derived an analytical expression for the scattering kernel, o (Ei Ef), for neutrons in a gas of atoms of arbitrary mass. They assumed that a (v r), where vr is the relative velocity between the neutron and target, is constant. This kernel, with a mass of two, is valid for a deuterium gas; it will be referred to as the Mass-Two kernel.
Brown and St. John (B11) recognized that they could obtain a solution for the scattering kernel for the case:
a-svr) = A exp (-c v$), (3.2.1)