Publisher’s version / Version de l'éditeur:
Vous avez des questions? Nous pouvons vous aider. Pour communiquer directement avec un auteur, consultez la première page de la revue dans laquelle son article a été publié afin de trouver ses coordonnées. Si vous n’arrivez pas à les repérer, communiquez avec nous à [email protected].
Questions? Contact the NRC Publications Archive team at
[email protected]. If you wish to email the authors directly, please see the first page of the publication for their contact information.
https://publications-cnrc.canada.ca/fra/droits
L’accès à ce site Web et l’utilisation de son contenu sont assujettis aux conditions présentées dans le site LISEZ CES CONDITIONS ATTENTIVEMENT AVANT D’UTILISER CE SITE WEB.
Proceedings of the Buildings Simulation 2003 [Proceedings], 3, pp. 1093-1100,
2003-09-01
READ THESE TERMS AND CONDITIONS CAREFULLY BEFORE USING THIS WEBSITE. https://nrc-publications.canada.ca/eng/copyright
NRC Publications Archive Record / Notice des Archives des publications du CNRC :
https://nrc-publications.canada.ca/eng/view/object/?id=c01df11e-4812-482b-b360-a04a136425e8
https://publications-cnrc.canada.ca/fra/voir/objet/?id=c01df11e-4812-482b-b360-a04a136425e8
NRC Publications Archive
Archives des publications du CNRC
This publication could be one of several versions: author’s original, accepted manuscript or the publisher’s version. / La version de cette publication peut être l’une des suivantes : la version prépublication de l’auteur, la version acceptée du manuscrit ou la version de l’éditeur.
Access and use of this website and the material on it are subject to the Terms and Conditions set forth at
The Lightswitch Wizard - reliable daylight simulations for initial design
investigation
The Lightswitch Wizard – reliable daylight simulations
for initial design investigation
Reinhart, C.F.; Morrison, M.; Dubrous, F.
NRCC-46264
A version of this document is published in / Une version de ce document se trouve dans: Proceedings of the Buildings Simulation 2003, Eindhoven, The Netherlands, v. 3, p. 1093-1100
published in the Proceedings of the Buildings Simulation 2003, Eindhoven, The Netherlands, vol. III, pp.1093-1100, August 11- 14, 2003
1
THE LIGHTSWITCH WIZARD – RELIABLE DAYLIGHT SIMULATIONS FOR
INITIAL DESIGN INVESTIGATION
C. F. Reinhart
α, M. Morrison
The Lighting Group - Institute for Research in Construction
National Research Council Canada, Ottawa K1A 0R6, Canada
F. Dubrous
The Buildings Group – CANMET Energy Technology Centre
Natural Resources Canada, Ottawa, Ont., K1A 0E4, Canada
ABSTRACT
A web-based, non-expert daylighting analysis tool has been developed to support daylighting-related design decisions in peripheral private offices during an early design stage (http://buildwiz.com). The tool offers a comparative, reliable, and fast analysis of the annual amount of daylight in the offices (daylight factor and daylight autonomy) and the lighting energy performance of automated lighting controls (occupancy sensors, photocells) compared to standard on/off switches. Blinds are either manually or automatically controlled.
During a simulation run, pre-calculated, RADIANCE-based daylight coefficients for over 600 office designs are coupled with weather data from 285 sites in North America to yield annual daylight illuminance profiles. The annual electric lighting energy use is subsequently predicted via a model that mimics occupancy and manual lighting and blinds control in private offices.
A simulation run takes between 30 seconds to 3 minutes and yields a detailed report of the annual daylight availability and lighting energy use in the investigated office.
INTRODUCTION
The role of computerized building design tools is to supply decision makers with performance measures that support informed design choices. Given the breadth of choices and concerns a design team is constantly confronted with, various design aspects are usually competing for the team’s attention. In this competitive environment, information gained through any one simulation tool are constantly weighed against the required time and financial resources necessary to obtain them, as well as information that could be gained through the use of other or no tools.
Daylighting analysis software should have a high acceptance and adoption rate within the market given that daylighting is (a) a desirable design
aspect for most buildings and (b) difficult to capture through simple rules of thumb. Therefore it is surprising, that the market penetration of daylighting tools is slow. They seem to keep a “nice-to-have but too costly” stigma. A number of barriers against the wider usage of these tools have been identified in the past (Donn 1999):
• long learning curves due to the tools’ complexity, • uncertainty about the accuracy of simulation
results,
• time-consuming 3D model preparation1 and
simulation times, and
• the absence of conclusive performance measures. In addition, most tools provide analysis suitable for the full design phase, not the initial conceptual design work.
This paper introduces a new web-based analysis tool that aims to make advanced daylight simulation techniques available to a wider spectrum of users and foster their use at the initial design stage. The tool is called “The Lightswitch Wizard”. Its mandate is to help:
• building designers to design perimeter offices with “enough but not too much” annual daylight. • lighting designers to assess the energy/cost
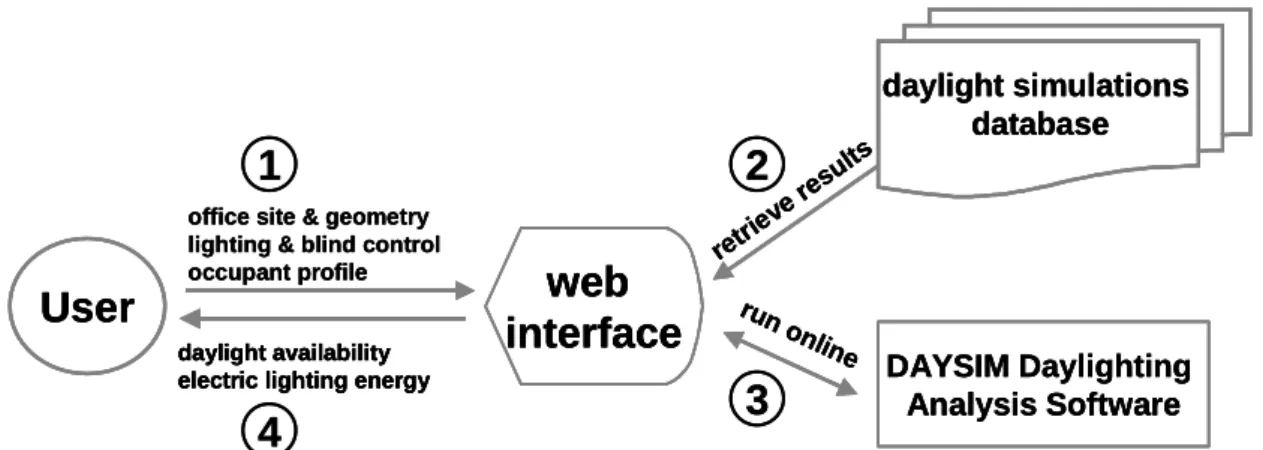
benefits of lighting and window blinds controls. The Lightswitch Wizard design specifically addresses the barriers listed above. Its basic approach is shown in Figure 1:
Simulation input is provided via a web-based graphical user interface (see Figure 3) that allows the user to customize dimensions, material properties, lighting and blinds systems, and user properties for a standard peripheral office. Based on the chosen office properties, pre-calculated daylight simulation results are retrieved from a database and further processed to calculate the annual daylight availability and electric lighting energy use in the
1 A survey of 198 mostly North American architects
and engineers yielded that 80% “always used” 2D-CAD compared to only 10% who “always used” 3D-CAD programs (Jacobs and Henderson 2002).
office. A detailed simulation report (see Table 2) is delivered back to the user.
The simulation engine and output are described below, followed by an example application and a discussion of the merits and limitations of the wizard.
SIMULATION INPUT
Figure 3 shows a screenshot of the Lightswitch Wizard’s main application window. Similar to the
RADIANCE Image Database (http://gaia.lbl.gov/rid) and the Daylighting Design
Variations Book (www.bwk.tue.nl/fago/daylight/), the tool offers a side-by-side analysis of two independent office scenarios at a time. Simulation input is grouped under three tabs: site, office, and
user. The former two groups allow customary
choices such as one out of 285 sites in North America2, four facade orientations, and, currently, three prototype facades. Room dimensions, surface reflections, glazing type and frame proportions are entered under the office tab.
To reduce simulation times from hours to minutes without compromising simulation accuracy, daylight coefficients for all possible office combinations have been pre-calculated with the RADIANCE backward raytracer (Ward and Shakespeare 1998). Daylight coefficients offer a fast and reliable method to predict indoor illuminances under arbitrary sky conditions (Tregenza and Waters 1983). The Lightswitch Wizard uses the validated DAYSIM program (Reinhart and Walkenhorst 2001) to convert daylight coefficients and irradiance climate files
2 Hourly direct and diffuse irradiances have been
taken from the Environment Canada database CWEEDS (Environment Canada, 1992) and the US database SAMSON (NCDC, 1996) for 1990 and converted into 5 minute time series using a stochstic model described in (Walkenhorst et al. 2002).
into 5 minute time series of the indoor illuminance distribution in the chosen office. These time series are in turn used to calculate annual daylight autonomies and daylight factor distributions (see Table 2).
A unique feature of the Lightswitch Wizard is a strong emphasis on the description of the occupant (occupancy and user behavior) and the lighting and blinds control systems.
User occupancy is characterized by arrival and departure times on weekdays, which are processed by a stochastic occupancy model that breaks up the working day through temporary absences from the work place (Reinhart 2001). The resulting mean occupancy probability on a weekday is shown in Figure 2 for an arrival time of 8:00 and a departure time of 17:003.
Figure 2: Mean occupancy probability on a
weekday for arrival to departure times of 8:00
to 17:00.
User occupancy and daylight illuminance profiles determine the time per year when the
3
For a working day longer than 6 hours, the occupancy model assigns a one hour lunch break and two 30 minute absences from the work place in the morning and afternoon.
daylight simulations database retri eve resu lts
User
office site & geometry lighting & blind control
occupant profile
web
interface
DAYSIM Daylighting Analysis Software run online daylight availabilityelectric lighting energy
1
2
3
4
daylight simulations database retri eve resu lts daylight simulations database retri eve resu ltsUser
office site & geometry lighting & blind control
occupant profile
web
interface
User
office site & geometry lighting & blind control
occupant profile
web
interface
DAYSIM Daylighting Analysis Software run online DAYSIM Daylighting Analysis Software run online daylight availabilityelectric lighting energy daylight availability electric lighting energy daylight availability electric lighting energy
1
2
3
4
published in the Proceedings of the Buildings Simulation 2003, Eindhoven, The Netherlands, vol. III, pp.1093-1100, August 11- 14, 2003
3 occupant could principally work by daylight alone. User behavior and the lighting and blinds control system determine how much of this available daylight actually replaces electric lighting loads.
In the following the lighting and blinds control scenarios supported by the Lightswitch Wizard are described. The input variable user
behavior, which determines how the occupant
interacts with manual controls (on/off switch or manual blinds) is described further below.
The wizard features six lighting control scenarios: • manual on/off switch: a standard manually
controlled electric lighting system with an on/off switch near the door. According to chapter 27 of the IESNA Lighting Handbook (IESNA 2000), this is the reference system relative to which the energy savings potential of automated controls should be expressed.
• switch-off occupancy sensor: manually controlled on/off switch lighting system combined with an ideally located occupancy sensor with a user-specified switch-off delay time. The lighting system is switched on manually through the switch. It is switched off either manually by the occupant or automatically by the occupancy sensor. The occupancy sensor requires a standby power of 3W when the lighting system is switched on.
• on/off occupancy sensor: automatically controlled lighting system with an ideally located occupancy sensor with a user-specified switch-off delay time. The occupancy sensor is permanently in standby mode and activates the lighting whenever occupancy is detected. The standby power of the occupancy sensor is 3W.
• dimming system: ideally commissioned dimming system with a manual on/off switch near the door. A photocell dims the lighting until the total work plane illuminance (daylight & electric light) reaches a specified minimum illuminance threshold. At minimum lighting output (1%) the system consumes 15% of its full electric power. The photocell requires a standby power of 2W. • dimming system with switch-off occupancy
sensor: same system as above combined with a
switch-off occupancy sensor. The control module (photocell and occupancy sensor) requires a standby power of 5W.
• dimming system with on-off occupancy sensor: fully automated dimming system that is switched on and off by an occupancy sensor. The control module (photocell and occupancy sensor) requires a permanent standby power of 5W. The temporary setting of the blinds throughout the year determines the amount of daylight available for
lighting. The following blinds control scenarios are supported:
• manually operated blinds: standard internal venetian blinds system commonly found throughout North America. Depending on the
user behavior chosen, the blinds use is ‘active’
or ‘passive’ (Table 1).
• automated blinds: ideal automated blinds system. The blinds are fully lowered to avoid glare as soon as direct sunlight above 50 Wm-2 hits the work place. The blinds are re-opened as soon as the glare criteria is no longer met.
• no blinds: this scenario that is not recommended unless glare protection is realized through a static device such as a light-shelf.
To simulate indoor illuminances when the blinds are lowered, a simple blinds model has been used. The model assumes that the lowered blinds reject 100% of the direct and transmit 25% of the diffuse solar radiation (Vartiainen 2000).
A key finding from field studies on manual lighting and blinds control in single offices is, that even though occupants behave differently, they use their lighting and blinds controls consciously and
consistently (e.g.: Lindsay and Littlefair, 1993;
Pigg, Eilers and Reed, 1996; Love, 1998; Jennings
et al., 1999; Reinhart and Voss, 2003). The latter
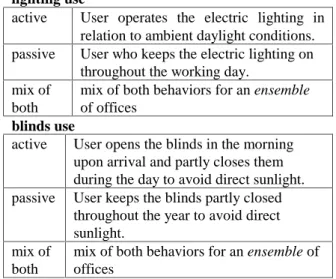
finding confirms that manual lighting control is not arbitrary and constitutes the theoretical foundation for models (such as the Lightswitch Wizard) that aim to mimic how occupants interact with their controls. To account for individual differences between occupants, the wizard allows to specify the occupant’s user behavior concerning lighting and blinds use. To simplify this choice for the software user, lighting and blinds use have been termed either ‘active’ or ‘passive’ (see Table 1).
Table 1: Input parameters for user behavior in
the Lightswitch Wizard (Reinhart 2002).
lighting use
active User operates the electric lighting in relation to ambient daylight conditions. passive User who keeps the electric lighting on
throughout the working day. mix of
both
mix of both behaviors for an ensemble of offices
blinds use
active User opens the blinds in the morning upon arrival and partly closes them during the day to avoid direct sunlight. passive User keeps the blinds partly closed
throughout the year to avoid direct sunlight.
mix of both
mix of both behaviors for an ensemble of offices
The lighting and blinds control algorithms in Table 1 are a combination of various stochastic switch on/off probability functions that depend on occupant arrival, departure and indoor illuminances. The algorithms have been described in (Reinhart 2002). They are based on individual behavioral patterns that have been observed in field studies (Reinhart and Voss 2003). The electric lighting
energy uses for identical offices and lighting systems can differ considerably for different user
behaviors.
How can a designer choose an adequate lighting system for a particular project? For an individual office, it is impossible to predict the user behavior of the occupant. If, on the other hand, the office
Simulation Report
Simulation Report
Simulation Report
Simulation Report
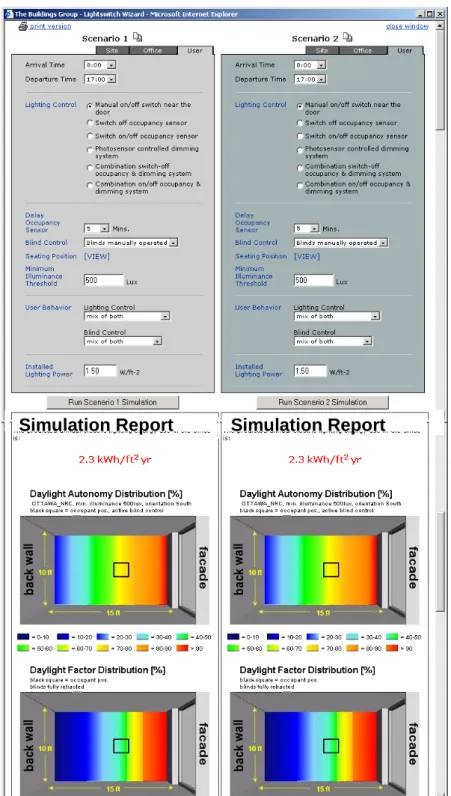
Figure 3: The Lightswitch Wizard offers a side-by-side comparison of the electric lighting use and
annual daylight availability in two independent perimeter offices. The main application window is
divided into four parts: Two upper input sections and two lower simulation report sections. The two
left input and simulation report sections refer to office scenario 1. The two sections on the right refer
published in the Proceedings of the Buildings Simulation 2003, Eindhoven, The Netherlands, vol. III, pp.1093-1100, August 11- 14, 2003
5
Table 2: Example Simulation Report.
Simulation Report
The predicted annual electric lighting energy use in the office is:
2.3 kWh/ft2 yr
Site Description
The office is located in OTTAWA_NRC (N 45o, W 75.67o). Daylight savings time lasts from April 1st to October 31st. Office Description
The office has a facade facing due South. The facade glazing has a visual transmittance of 72.0%. The window unit has a frame proportion of 15.0%. The facade is unobstructed by surrounding buildings or landscape. The office has a floor to ceiling height of 9ft, is 10 ft wide and 15ft deep. The diffuse reflectances of the ceiling, walls and floor are 80%, 50%, and 20%, respectively. A view of the office facade is shown below.
User Description
The office is occupied Monday through Friday from 8:00 to 17:00. The occupant leaves the office three times during the day (30 minutes in the morning, 1 hour at midday, and 30 minutes in the afternoon). The occupant performs a task that requires a minimum illuminance of 500 lux. The predicted electric lighting energy use of 2.3 kWh/ft2 yr corresponds to the mean energy use in an ensemble of indentical offices that are occupied by four user types:
• a user who operates the electric lighting in relation to ambient daylight conditions, opens the blinds in the morning (upon arrival), and lowers them when direct sunlight above 50 Wm-2 hits the seating position (to avoid direct glare),
• a user who operates the electric lighting in relation to
ambient daylight conditions, and keeps the blinds lowered throughout the year to avoid direct sunlight,
• a user who keeps the electric lighting on throughout the working day, opens the blinds in the morning (upon arrival), and lowers them when direct sunlight above 50 Wm-2 hits the seating position (to avoid direct glare), and
• a user who keeps the electric lighting on throughout the working day, and keeps the blinds lowered throughout the year to avoid direct sunlight.
Lighting and Blinds Control
The electric lighting system has an installed lighting power density of 1.5Wft-2 and is manually controlled with an on/off switch. A venetian blinds system acts as the glare protection device in the office. The blinds are manually controlled.
View of the investigated office facade.
investigated by the Lightswitch Wizard is one out of many identical offices in a large building, the average energy demand for this ensemble of offices is the design criteria of interest. In this case, the relevant question becomes: What is the frequency distribution of the different user types in the building? Unfortunately, there is no data currently available to meaningfully answer this question. A straightforward engineering approach is to assign equal frequencies to all four combinations in Table 1 (active/active, active/passive, passive/active and passive/passive). This choice corresponds to the mix
of both-option for lighting and blinds use.
SIMULATION OUTPUT
Table 2 shows an example simulation report. These reports are displayed in the main application window in Figure 3 below the input section. The influence of the different input parameters can be assessed through a side-by-side comparison of the simulation reports for two different scenarios. The main simulation results are presented up front: • The annual electric lighting use is expressed in
kWh/ft2yr. Depending on the user behavior chosen, it either refers to the energy use of a particular user type or to the mean energy use of an ensemble of identical offices.
• The amount of daylight available in the office is expressed through false color maps of the
daylight factor and daylight autonomy distributions. The daylight factor is defined as the ratio of the indoor illuminance on the work plane to the outdoor horizontal illuminance under an overcast CIE reference sky. It is a common parameter to characterize the daylight situation in a building as it is an intuitive quantity that can be measured or calculated. Nevertheless, its explanatory power as a design performance measure is limited as it ignores building orientation and geographical latitude, and is based on a single overcast sky condition. • The daylight autonomy in a building is defined
as the percentage of the occupied times per year, when a minimum illuminance level can be maintained by daylight alone. It is a performance measure that considers all sky conditions throughout the year when the office is occupied. It captures daylight availability, user occupancy and illuminance requirements in a single number. It is independent of the installed electric lighting system so that a high daylight autonomy is a necessary requirement but not a guarantee for lighting energy savings due to daylight.
For quality assurance purposes all simulation assumptions are documented in the simulation report in a format that can be copied and pasted into documents prepared by the users of the software.
EXAMPLE APPLICATION
Assume a designer working on an office building in Ottawa, Canada. The office has no external obstructions. All perimeter offices are private and have the dimensions of the example office in Table 2. In the reference scenario, all offices have standard on/off lighting switches and manually
operated venetian blinds. Table 2 informs the designer that the mean energy use in the offices facing south is 2.3 kWh/ft2yr.
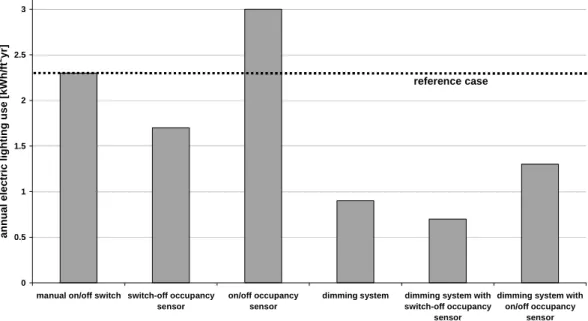
The designer is interested in estimating the energy saving potential of installing automated lighting controls. A few runs quickly lead to the results shown in Figure 4. All investigated automated lighting controls except for the on/off occupancy sensor are likely to yield energy savings with respect to the reference scenario. The on/off sensor hinders all users to ever work by daylight alone. This effectively nullifies energy savings for those users in Table 1 who would operate the electric lighting in relation to ambient daylight conditions. The largest electric lighting energy savings (70%) can be expected from a dimming system combined with a switch-off occupancy sensor. These savings are largely due to the dimming system and the high daylight autonomy of 70% near the work place4. Depending on the installation costs for the different automated lighting systems, Figure 4 allows the designer to quantitatively weigh projected payback times against initial costs. Of course, the same kind of analysis is also possible for the remaining three facade orientations.
DISCUSSION
As laid out in the introduction, the intention of the Lightswitch Wizard is to bring daylight simulation
4
The black square in the daylight autonomy distribution figure in Table 2 depicts the seating position of the occupant. This is one of the simulation inputs. 0 0.5 1 1.5 2 2.5 3
manual on/off switch switch-off occupancy sensor
on/off occupancy sensor
dimming system dimming system with switch-off occupancy
sensor
dimming system with on/off occupancy sensor annual el ect ri c l ight ing use [ k W h /f t 2yr] reference case
published in the Proceedings of the Buildings Simulation 2003, Eindhoven, The Netherlands, vol. III, pp.1093-1100, August 11- 14, 2003
7 techniques closer to the mainstream design practice by aiming at the initial conceptual phase and combining a smart simplified GUI with a sophisticated calculation engine. This section discusses the extent to which the wizard overcomes the barriers identified above, and what its limitations are:
• long learning curves: Compared to the time required to proficiently learn RADIANCE, the wizard provides instant access to reliable simulation results for standard peripheral offices. The users of the software will have to invest some time into familiarizing themselves with the daylight performance measures provided. It will probably take a number of runs until the user develops a feeling of what is a high daylight autonomy or annual electric lighting use. On the other hand, “acquiring a systematic understanding of the relationships of architectural precedents to the environment” (Donn, 1999) –in our case room design and daylight availability– constitutes a useful exercise for a designer in itself.
• time-consuming 3D model preparation and simulation times: The time necessary for a user of the software to enter the building data and getting daylight simulation results is small compared to having to create a 3D model, import it into RADIANCE and run a simulation. This time savings on the users’ side have been realized through a substantial simulation effort on the developer’s side5. This effort has limited the number of prototype facades that are presently offered. More facades can be added as/if the wizard further evolves. In the meantime, the expert simulation software DAYSIM offers more ambitious users a way to get the same simulation output for arbitrary complex building models6. • accuracy of simulation results: All simulation
results stored in the Lightswitch Wizard database are based on the RADIANCE simulation engine that has been validated for comparable sidelit rooms (Mardaljevic 1995). A comparison of the daylight autonomy measurements and calculations in a full scale test office showed that results were identical within a two percentage-point range (Reinhart and Walkenhorst, 2001). Despite these encouraging findings are daylight simulation results of the Lightswitch Wizard based on a number of approximations:
(a) Shading due to external objects is presently discarded.
5
The daylight coefficient data for one facade variant require about 1.5 GB of disc space and 9000 hours of CPU time to generate them.
6
http://irc.nrc-cnrc.gc.ca/ie/light/daysim.html
(b) Mullions are not explicitly modeled. Instead the window transmission is simply scaled down depending on the frame to window area ratio specified by the user.
(c) As explained above, blinds are generic and not explicitly modeled.
(d) No furniture is considered.
(e) The ground reflectance is set to 20% throughout the year, ignoring snow cover in the winter.
(f) The dimming system is considered to be ideally commissioned which does not necessarily reflect current practices (see e.g. Floyd et al.
,
1995; Love, 1995)Of all these approximations, neglecting surrounding external objects can lead to the most drastic errors especially in dense urban settings. Using a generic instead of an explicit blinds model –which can lead to substantial simulation inaccuracies at individual time steps– usually becomes less crucial considering a whole year. The reason for this is that our present knowledge of how occupants use their blinds is limited and does not include what slat angles are routinely chosen or how far the blinds are lowered. In the model, blinds are either ‘up’ or ‘down’.
The main simulation uncertainty lies in the user behavior model. As discussed in (Reinhart 2002) the current Lightswitch model offers a snapshot of current knowledge of office occupant interaction with their lighting and blinds controls. The model is currently being validated through field studies that are carried out in the context of the International Energy Agency Task 31, Daylighting Buildings in the 21st
century 7.
• conclusive performance measures: Despite the uncertainties of the Lightswitch Wizard, the tool provides a set of relevant performance parameters that can be directly used to guide design choices. A limitation of the wizard is that it presently does not consider thermal energy balances for heating and cooling. This limitation might be overcome in the future. It bears the risk of a designer optimizing “one dimensionally” towards an adequate use of daylight while at the same time introducing unwanted heating and cooling loads.
CONCLUSIONS
This paper describes a new web-based daylight simulation tool to assist the implementation of daylighting measures in perimeter offices. Applications and limitations of the tool are discussed. Required simulation times are short and
7
pre-set input options largely draw on standard and readily available design choices. The simulation output provides innovative but intuitive performance parameters that can be seamlessly integrated into the design process. The tool has the potential to contribute to a wider usage of daylight simulation techniques at an early design stage. As this design support service is breaking new grounds, challenges lie ahead regarding its adoption by industry. A sustained effort to reach product maturity is planned for the near future.
ACKNOWLEDGEMENTS
The Lightswitch Wizard is the result of a partnership between the National Research Council Canada and Natural Resources Canada (contract number B3213). The authors are indebted to the Ottawa-based software company LOGICOM for programming the simulation interface.
REFERENCES
Donn M. 1999. Quality assurance – simulation and the real world, Conf. Proc. of the IBPSA ’99 Buildings Simulation, Vol. III, 1139 - 146, Kyoto, Japan.
Environment Canada 1996. CWEEDS – Canadian Weather Energy and Engineering Data Sets) Files, prepared by WATSUM Simulation Laboratory, Waterloo, Ontario, and the National Research Council of Canada.
Floyd D B, Parker D 1995. Field Commissioning of a Daylight-Dimming Lighting System. Proc. Right Light Three, 3rd European Conference on Energy Efficient Lighting, Newcastle UK , 83-88.
IESNA 2000. The Lighting Handbook, published by the Illuminating Engineering Society of North America, ISBN 0-87995-150-8 (New York, NY:IESNA), 9th Edition .
Jacobs, Henderson 2002. State-of-the-Art Review, Whole Buildings and Building Envelope Simulation and Design Tools, Project Report
605-30010, http://www.arti-21cr.org/research. Jennings J, Rubinstein F, DiBartolomeo D, and
Blanc S 1999. Comparison of Control Options in Private Offices in an Advanced Lighting Control Testbed. Proceedings of the IESNA 1999 Annual Conference, New Orleans, LA, August 10-12 .
Love J A 1998. Manual switching patterns observed in private offices. Lighting Research & Technology 30[1], 45-50.
Love J . 1995. A Field Performance of Daylighting Systems with Photoelectric Control. Proc.
Right Light Three, 3rd European Conference on Energy Efficient Lighting, Newcastle UK , 75-82.
Lindsay C R T and Littlefair P J 1993. Occupant use of Venetian Blinds in Offices. PD 233/92. Watford, Building Research Establishment. Mardaljevic J 1995. Validation of a lighting
simulation program under real sky conditions, Lighting Research & Technology, 27(4), 181-188.
NCDC (National Climatic Data Center) 1996. Solar And Meteorological Surface Observation Network (SAMSON) data, can be ordered from
http://www.ncdc.noaa.gov/.
Pigg S, Eilers M, and Reed J 1996. Behavioral Aspects of Lighting and Occupancy Sensors in Privates Offices: A case study of a University Office Building . Proceedings of the 1996 ACEEE Summer Study on Energy Efficiency in Buildings 8, 8.161-8.171.
Reinhart C F, Voss K 2003. Monitoring manual control of electric lighting and blinds. Lighting Research & Technology, 35:2 16 pp., 2003, in press.
Reinhart C F 2002. LIGHTSWITCH 2002: A model for manual control of electric lighting and blinds, submitted to Energy & Buildings. Reinhart C F, Walkenhorst O 2001. Dynamic
RADIANCE-based daylight simulations for a full-scale test office with outer venetian blinds. Energy & Buildings, 33:7 pp. 683-697.
Reinhart C F 2001. Daylight Availability and Manual Lighting Control in Office Buildings – Simulation Studies and Analysis of Measurements. Ph.D. thesis, Technical University of Karlsruhe, Faculty of Architecture.
Tregenza P R, Waters I M 1983. Daylight Coefficients, Lighting Research & Technology
15(2), 65-71.
Walkenhorst O, Luther J, Reinhart C F, Timmer J 2002. Dynamic annual daylight simulations based on one-hour and one-minute means of irradiance data. Solar Energy, 72:5 pp. 385-395.
Vartiainen E 2000. Daylight Modeling and Optimization of Solar Facades, Ph.D. thesis from the Faculty of Engineering Physics at the Helsinki University of Technology.
Ward G, Shakespeare R 1998. Rendering with RADIANCE. The Art and Science of Lighting Visualization, Morgan Kaufmann Publishers.