Publisher’s version / Version de l'éditeur:
Marine Biotechnology, 2, 6, pp. 650-663, 2010-11-01
READ THESE TERMS AND CONDITIONS CAREFULLY BEFORE USING THIS WEBSITE.
https://nrc-publications.canada.ca/eng/copyright
Vous avez des questions? Nous pouvons vous aider. Pour communiquer directement avec un auteur, consultez la première page de la revue dans laquelle son article a été publié afin de trouver ses coordonnées. Si vous n’arrivez pas à les repérer, communiquez avec nous à [email protected].
Questions? Contact the NRC Publications Archive team at
[email protected]. If you wish to email the authors directly, please see the first page of the publication for their contact information.
NRC Publications Archive
Archives des publications du CNRC
This publication could be one of several versions: author’s original, accepted manuscript or the publisher’s version. / La version de cette publication peut être l’une des suivantes : la version prépublication de l’auteur, la version acceptée du manuscrit ou la version de l’éditeur.
For the publisher’s version, please access the DOI link below./ Pour consulter la version de l’éditeur, utilisez le lien DOI ci-dessous.
https://doi.org/10.1007/s10126-009-9252-8
Access and use of this website and the material on it are subject to the Terms and Conditions set forth at
Seasonal Changes in Hepatic Gene Expression Reveal Modulation of
Multiple Processes in Rainbow Smelt (Osmerus mordax)
Richards, Robert C.; Short, Connie E.; Driedzic, William R.; Ewart, K. Vanya
https://publications-cnrc.canada.ca/fra/droits
L’accès à ce site Web et l’utilisation de son contenu sont assujettis aux conditions présentées dans le site LISEZ CES CONDITIONS ATTENTIVEMENT AVANT D’UTILISER CE SITE WEB.
NRC Publications Record / Notice d'Archives des publications de CNRC:
https://nrc-publications.canada.ca/eng/view/object/?id=4b431c4e-73de-4414-b8ec-7df797707aef https://publications-cnrc.canada.ca/fra/voir/objet/?id=4b431c4e-73de-4414-b8ec-7df797707aefORIGINAL ARTICLE
Seasonal Changes in Hepatic Gene Expression Reveal
Modulation of Multiple Processes in Rainbow Smelt
(Osmerus mordax)
Robert C. Richards&Connie E. Short&
William R. Driedzic&K. Vanya Ewart
Received: 14 August 2009 / Accepted: 23 November 2009 / Published online: 27 January 2010 # Her Majesty the Queen in Right of Canada 2010
Abstract Rainbow smelt (Osmerus mordax) are freeze-resistant fish that accumulate glycerol and produce an antifreeze protein during winter. Quantitative reverse transcription PCR (qPCR) and subtractive hybridization studies have previously revealed five genes in rainbow smelt liver to be differentially regulated in winter in comparison with the fall when water temperatures are warmer. In order to further define the suite of processes that are regulated seasonally, we undertook a large-scale analysis of gene expression by hybridization of smelt cDNA to the salmonid 16K cGRASP microarray. In total, 69 genes were identified as up-regulated and 14 genes as down-regulated under winter conditions. A subset of these genes was examined for differential regulation by qPCR in the individual cDNA samples that were pooled for microarray analysis. Ten of the 15 genes tested showed significant change in the same direction as microarray results, whereas one showed significant change in the opposite direction. Fructose-bisphosphate aldolase B and the cytosolic NAD-dependent glycerol-3-phosphate dehydrogenase were among the most highly up-regulated genes, a result supporting a metabolic focus on glycerol synthesis during winter. Modulation of other processes, including endoplasmic reticulum stress, lipid metabolism and transport, and protein synthesis, was also suggested by the qPCR analysis of array-identified genes. The 15 genes were subsequently examined by qPCR for seasonal
variation in expression over five sampling times between October and March, and ten showed significant variation in expression over the sampling period. Taken together, these results provide new understanding of the biochemical adaptations of vertebrates to an extremely low seasonal temperature.
Keywords Rainbow smelt . Osmerus mordax . Microarray . Glycerol . Antifreeze protein . Cold adaptation . qPCR
Introduction
Fish species that inhabit polar and north temperate oceans are able to survive very low temperatures that can decline below the normal freezing point of fish serum. Several of these species have biochemical adaptations that lower their freezing points to that of the seawater and thereby protect them from freezing (Goddard and Fletcher 2002; Driedzic and Ewart 2004). The most widespread freeze resistance adaptation in fish is the production of antifreeze proteins (AFPs) that lower the freezing point in a non-colligative fashion by binding to ice crystals (Fletcher et al. 2001). A less common adaptation in fish is the accumulation of glycerol to high levels, which results in a colligative freezing point depression (Driedzic and Ewart2004). Both adaptations are present in rainbow smelt (Osmerus mordax; Ewart et al. 1992; Raymond1992), a species that survives in icy seawater and remains active and feeding throughout the winter season. The rainbow smelt (hereafter referred to as smelt) produces an antifreeze protein seasonally. Glycerol also accumulates seasonally, although the cycle appears independent of that of the antifreeze protein and the two processes appear to be regulated separately (Lewis et al. 2004; Liebscher et al. 2006).
R. C. Richards
:
K. V. Ewart (*)Institute for Marine Biosciences, National Research Council, Halifax, NS, Canada B3H 3Z1
e-mail: [email protected] C. E. Short
:
W. R. DriedzicOcean Sciences Centre, Memorial University of Newfoundland, St. John’s, NL, Canada A1C 5S7
The spectrum of adaptations required in order for smelt to be active in freezing seawater is expected to involve more than freeze resistance. Cellular components that are sensitive to temperature variation would require adjustment over the winter season in order to maintain their integrity and function. In simple model eukaryotes that are euryther-mal, transcriptional response to temperature shift has been examined in a thorough manner, leading to contrasting results. In yeast (Saccharomyces cerevisiae), a comparison of results obtained by three different laboratories revealed a set of six genes up-regulated with cold that were common to all experiments, and three of these genes were involved in lipid metabolism (Tai et al. 2007). However, genetic disruption of low-temperature-induced lipid remodeling in the worm Caenorhabditis elegans results in substantial retention of the cold tolerance phenotype, revealing the significance of other adaptations (Hayward et al.2007). In fish, most studies have involved species that are cold-sensitive or moderately eurythermal. For this reason, transcriptional responses to cold temperature are likely to involve a stress (heat shock) response in addition to adaptive changes; however, the adaptive changes remain informative. In the zebrafish (Danio rerio), temperature shift from 28°C to 18°C for a year increased the expression of genes involved in alleviating oxidative stress (Malek et al. 2004). A further study in which zebrafish gills were more specifically examined and for a shorter length of time (1–30 days) showed differential regulation of several genes involved in metabolism (Chou et al. 2008). In tissues of catfish (Ictalurus punctatus), carp (Cyprinus carpio), killifish (Austrofundulus limnaeus), and cultured cells of medaka (Oryzias latipes), which are all relatively euryther-mal species, cool temperatures (10–20°C) resulted in the up-regulation of many genes, including several that were specific to species, tissue, or temperature regimen (Ju et al.
2002; Podrabsky and Somero 2004; Cossins et al. 2006; Hirayama et al.2008). These findings were in contrast to the more modest responses with fewer up-regulated genes in stenothermal zebrafish and cells in culture at similar temperatures (Chou et al. 2008), suggesting that a strong transcriptional response might be essential to seasonal and low temperature adaptation. Together, these studies reveal the stress response to low temperature and suggest some avenues by which fish may lessen the limitations of low temperature on cell components and metabolic processes.
To identify genes that are truly adaptive at the lowest temperatures encountered by functioning vertebrate cells and widely relevant to vertebrate temperature adaptation, it would be most informative to examine a temperate eurythermal species that is metabolically active and feeding over a wide temperature range, including sub-zero freezing seawater. The most fully cold-adapted species would be expected to show no detectable stress response upon
cooling as the genes differentially regulated in those species would bring about fully adaptive changes that preclude a stress response. The smelt, which is active at low and freezing water temperatures, is an ideal model in this context. Earlier studies have shown differential regulation for a small number of genes. Initially, the smelt antifreeze protein, phosphoenolpyruvate carboxykinase, and glycerol-3-phosphate dehydrogenase were examined over the fall– spring interval because of their expected roles in generating antifreeze protein and glycerol that lower the freezing point of smelt over the winter season. Each showed a seasonal cycle of gene expression, although the cycles were distinct, suggesting different modalities of regulation (Liebscher et al.2006). In a subsequent study, liver mRNA was subject to suppressive subtraction hybridization (Richards et al.2008) as a means of discovering other genes with potential roles in winter survival. Although the enrichment process was leaky, a large number of genes were enriched in the fall and winter libraries, and after a triage process, two genes with distinct roles were confirmed by quantitative reverse transcription PCR (qPCR) as up-regulated in winter, suggesting that the scope of adaptive change in smelt extends beyond freeze resistance during the winter season (Richards et al.2008).
The goal of the current study was to generate a representative profile of the transcriptome of smelt liver in response to the winter season in order to reveal the spectrum of products and processes that are integral to winter survival at the molecular level. A salmonid cDNA microarray was hybridized with smelt cDNA from fall and winter samples. Because a heterologous array was used in this study, a subset of microarray-identified genes was directly examined in the samples used for microarray. The same genes were then examined for seasonal variation in order to gain further insight into their roles.
Materials and Methods Sample Preparation
Smelt were collected in Newfoundland, Canada and maintained at the Memorial University of Newfoundland Ocean Sciences Centre (OSC) on flow-through water at ambient temperature and photoperiod. Procedures were according to the Canadian Council on Animal Care guide-lines. For samples used in microarray hybridization, livers were obtained from three male smelt on 20 October 2000 when the water temperature was 10°C and from three male smelt on 23 January 2001 when the temperature was 1°C. These samples were also used for qPCR analysis of selected genes for evaluation of the microarray hybridization results. Thereafter, a more detailed examination of seasonal gene
expression by qPCR was conducted with livers obtained from male smelt sampled on the following dates: 20 October 2000, 1 Nov. 2000, 20 Dec 2000, 23 Jan. 2001, and 23 March 2001 (Lewis et al. 2004). A detailed temperature profile for these samples is provided by Lewis et al. (2004).
Liver (30–50 mg) was treated with RNAlater (Ambion), stored at −80°C, and transferred to the National Research Council Institute for Marine Biosciences for processing. Tissue was homogenized in 1 mL TRIzol reagent following the manufacturer’s protocol (Invitrogen) using an RNase-Zap (Ambion)-treated Polytron homogenizer (Brinkmann) for 15–20 s on high speed. The tip was rinsed between samples with a series of washes beginning with 0.1% sodium dodecyl sulfate (SDS) in DEPC water and ending with DEPC water. After air drying, the total RNA pellet was redissolved in nuclease-free water (Sigma-Aldrich) and treated with RNAsecure reagent (Ambion). RNA quality was assessed by electrophoresis on 2% agarose gels in TBE buffer and quantified using the NanoDrop spectrophotom-eter (Thermo Fisher).
cDNA Synthesis and Microarray Hybridization
RNA preparations from the three fish sampled on a single day in October were combined in equimolar amounts, and the same was done for RNA from the three fish sampled on a single day in January. Microarray analysis of the pooled RNA samples was performed using the cGRASP 16K chip (Centre for Biomedical Research, Department of Biology, University of Victoria, Canada; http://web.uvic.ca/grasp/ microarray/array.html). Microarray hybridization was per-formed in triplicate (three technical replicates) according to the manufacturer’s instructions (Genisphere), essentially following the methods of Rise et al. (2004a, 2006). The microarray experiments were designed in compliance with “minimum information about a microarray experiment” guidelines (Brazma et al.2001). All data were deposited in the gene expression omnibus (http://www.ncbi.nlm.nih.gov/ geo/), and the accession number is GSE17961.
Labeling of cDNAs employed the 3DNA Array 900 chemistry (Genisphere) for two-color analysis using the Alexa Fluor 546 and 647 kits and was conducted essentially as described by the manufacturers, with minor modifica-tions. For each pool of total RNA, 2 µg of RNA was combined with 1 µL of the fluor-specific RT primer and nuclease-free water to make 6 µL. After denaturing at 80°C for 5 min and cooling on ice, 4.5 µL of a master mix consisting of 5 µL 5× Superscript first-strand buffer, 2.5 µL DTT, 1.25 µL Superase-in RNase inhibitor, and 1.25 µL Superscript III enzyme (200 units) was added. After mixing and brief centrifugation, the solution was incubated at 50°C for 2 h. The reaction was stopped by the addition of 1 µL
1 M NaOH, and after incubation at 65°C for 10 min to hydrolyse the RNA, the reaction was neutralized by adding 1.2 µL of 2 M Tris–HCl, pH 7.5, for a final reaction volume of 12.7 µL for each fluor.
Pre-hybridization of the arrays was performed in custom made, O-ring sealed aluminum chambers using 60 µL of a solution of final concentration 5× SSC (20× SSC stock, Ambion), 0.1% SDS (10% stock, Ambion), and 0.2% BSA (fraction V, Sigma-Aldrich) which was aliquoted carefully to prevent air bubble entrainment beneath a spaced coverslip (Lifterslip, ThermoFisher Scientific). The sealed chambers were immersed in a 49°C water bath for 45 min, after which the arrays were washed in water twice for 20 s each, followed by drying by centrifugation at 500 rpm for 2 min. A cDNA hybridization solution consisting of the two cDNA reactions (12.5 µL each), 3 µL of the GFP gridding assist spike (see below), 2 µL of the LNA dT blocker, and 30 µL 2× formamide hybridization buffer #7 (cooled after previously being heated to 70°C for 10 min) was heated to 80°C for 10 min and cooled to 49°C before introduction beneath a fresh Lifterslip placed over the prepared, pre-warmed to 49°C, arrays. A 40 µL aliquot of nuclease-free water was added to the chamber before sealing for humidification during the overnight incubation in the 49°C water bath.
In addition to the labeled cDNAs, the hybridization solution contained a DNA fragment encoding GFP and labeled with Cy5 to hybridize to green fluorescent protein cDNA spots added to the subgrids for identification (Rise et al. 2004b). Using an expression vector (pGFP, Clontech) with a GFP-tagged gene of interest as a template, a 280-bp product was amplified using PCR primers F and GFP-R (Table 1). The amplicon was gel-purified and labeled using a random primed DNA labeling kit (Roche) accord-ing to the manufacturer’s instructions. Briefly, 50 ng of template DNA in 18 µL nuclease-free water was heated to 95°C for 10 min before cooling on ice. Deoxynucleotide triphosphates (2 µL each except dCTP) from the kit were added as well as a 10 µL aliquot of Cy5-labeled dCTP (Perkin Elmer) and 2 µL of the Klenow fragment, followed by incubation at 37°C for 45 min. The reaction was stopped by the addition of 4 µL 0.2 M EDTA. The Cy5-tagged product was purified using a PCR product purification kit (Qiagen) and analyzed for dye incorporation using the NanoDrop spectrophotometer (Thermo Fisher).
The 3DNA hybridization solution was prepared by mixing 30 µL prepared formamide hybridization buffer #7, 2.5 µL each fluor-specific capture reagent, and 25 µL nuclease-free water. The mixture was then heated to 80°C, cooled to 49°C, and aliquoted beneath a fresh Lifterslip on the washed arrays as before. The hybridization was allowed to continue for 4 h in sealed chambers at 49°C. The arrays were then removed from the chambers and the same wash
procedure followed except under subdued yellow light to prevent photobleaching of the fluorophores. The arrays were stored protected from light until scanned.
For the post-hybridization wash, the first wash buffer (2× SSC, 0.1% SDS) was pre-warmed to 49°C. The coverslip was floated off by washing the array in pre-warmed wash buffer, and the washing continued for an additional 10 min with the arrays mounted in a rack. The rack was then transferred through a series of washes of increasing stringency, all at room temperature: two 5-min washes in 2× SSC with 0.1% SDS; two 5-min washes in 1× SSC; and two 5-min washes in 0.1× SSC followed by centrifugal drying as before. Small, covered stainless steel flat-bottomed boxes with removable microscope slide racks were used for all washing steps.
Microarrays were scanned at 532 and 635 nm using the ScanArray 5000XL (Packard BioChip Technologies) at a resolution of 10 μm with channels balanced based on line scans through representative groups of spots. Spot intensity values were obtained and normalized using the QuantArray (Packard) microarray analysis software, and data were exported to Excel for further analysis. Genes with intensity values ≥325 fluorescence units, with a coefficient of variation ≤30%, based upon data from a minimum of two
technical replicates were considered as suitable for use as data. In the set of genes meeting the criteria, those for which the mean January expression value was twofold or greater or 0.5-fold or less of their October values were identified as differentially regulated.
Gene Expression Analysis by qPCR
A series of qPCR reactions were performed on cDNA reverse-transcribed from smelt RNA using SYBR Green detection. For this purpose, liver tissue samples stored as above were removed from the −80°C freezer and kept on dry ice while a 40 mg portion was weighed and placed into a tube from the FastRNA Pro Green Kit (MP Biomedicals) containing Lysing Matrix D. Once all were weighed, 1 mL of the RNApro lysis solution was added and the tubes were placed in a FastPrep-24 machine (MP Biomedicals) and processed for 40 s at speed setting 6. The procedure continued as in the manufacturer’s instructions. The resulting pellets were dissolved in nuclease-free water and treated with RNAsecure as above. RNA was analyzed in each sample using a NanoDrop Spectrophotometer (Thermo Fisher). Each sample (25 µg RNA in 60 µL) was treated with two 1.25 µL aliquots of TurboDNase
Table 1 Synthetic oligonucleotides used in analysis of seasonal gene expression in smelt Primer
names
Target gene 5′ to 3′ Oligonucleotide sequence
Forward Reverse
GFP Green fluorescent protein GAAACATTCTTGGACACAATTTGG GCAGCTGTTACAAACTCAAGAAGG smApo14k 14-kDa apolipoprotein AGGCTGCCAAAGACTACATCG TAAACCTTGATGGAGGTGATGG smAldoB Fructose-bisphosphate aldolase B TGGAAGCTGACCTTTTCCTACG GCTGGCTGTGTAGAGTGACTGC smGPase Glycogen phosphorylase, muscle form TTGTTGAGAAAATTGGGGAAGG GGACTCTGGGTTGATTTTGACC smGDH2 Glutamate dehydrogenase (2) ATCTGAAGACCAGGGAGACAGC CCTCAATCACTTCCCACTCTCC smUST UDP-sugar transporter UST74c ATGTGGGGAATCAGGTATCAGG AGCTTGACAGACCCAGAGAAGG smAHC Adenosylhomocysteinase GGAAGAACACCAGCAAGTACCC GAGCTTCACTCCCAGTTTGTCC smATP6 ATP synthase, α chain TACCAGAAGGTACGCCTGTGC CGTAGGCATAATGGGAAGAAGG smGDH3 Glutamate dehydrogenase (3.1) GAGAACAACGTCATGGTCATCC GACATCAGCAGGTGGTAGTTGG smUCE Ubiquitin-conjugating enzyme E2 E1 ATCGCCTTCACACCAGACTACC GGATGTCCAGACAGATCACACC smSSR Signal sequence receptor, γ subunit TTTGTCCTCAAACACAAAGTTGC GCAGCTACCTCGTTCTTTTTCC smPME2 Peroxisomal multifunctional enzyme type 2
(17-β-hydroxysteroid dehydrogenase 4)
AGAAAGTCAACGCTGTGTTTGG TGATGGTCACGTCTGTCTTGC smApoAI1 Apolipoprotein A-I-1 CCCTATGCTGAGGAGTACAAGG GGCCCATCTTTTCCTTAATGC smPCQAP Positive cofactor 2 glutamine/Q-rich-associated
protein
TGTCTTCAACCATTCCCTGTACC GACGAGGAACTTGGAGTTGAGG smBHMT Betaine-homocysteine methyltransferase AATGTCATGCGGACTTTCACC CTCAGGTAAGAGGGGGTCTGG smACT Actin CATGTTCGAGACCTTCAACACC CTTCATCAGGTAGTCGGTGAGG smNucl Nucleolin ACAGGAGACAAGAGCCAGAAGG CGTTGTTCTGTGGTACTCTGACG smRPL27 Ribosomal protein L29 AAAATGGATGGGAACTTTGTCC GGAGGAACGTACACTTCCTTGG smGPDH Glycerol-3-phosphate dehydrogenase GACCTCATCACAACCTGCTACG CTGAAGCTTTTGTCCATTCAGC GFP oligonucleotides were employed in the microarray analysis. All other primers were used for qPCR analysis of gene expression. Primers were designed as described in the “Materials and Methods”.
(Ambion) for 30 min each at 37°C. Following DNase inactivation and centrifugation, RNA was stored at −80°C. Absorbance values revealed consistent final concentrations of approximately 300 ng/µL.
The reverse transcription procedure was followed as in the user’s manual (Invitrogen), except that it was scaled to 10 µL reaction size. Briefly, in the wells of a 96-well plate (Ultident Canada), 1 µg of each sample was made up to 5 µL with nuclease-free water. Additional reaction compo-nents including 0.5 µL 500 ng/µL of oligo(dT)12–18 (Invitrogen), 0.5 µL random decamers (Ambion), and 0.5 µL of a 10 mM dNTP mix (Fermentas) were added, and after capping the wells, the reaction mixture was heated in a thermocycler (Applied Biosystems GeneAmp 9700) at 65°C for 5 min and placed on ice for longer than 1 min. The remaining reaction components were added as a pre-mix including 2 µL of the 5× reaction buffer, 0.5 µL 0.1 M DTT, 0.5 µL RNaseOut, and 0.5 µL Superscript III reverse transcriptase (all Invitrogen). The wells were capped once again, and after a brief centrifugation to settle all droplets to the bottom of the wells, the plate was returned to the thermocycler for 5 min at 25°C followed by 1 h at 50°C and 15 min at 70°C to denature the enzyme. An aliquot of the pre-mix was heated at 95°C for 10 min to denature the enzyme for no-RT controls. A 1:100 dilution of the cDNA reaction was used as template in qPCR.
The qPCR reactions were carried out using primers designed to amplify genes of interest using the program Primer3 (Rozen and Skaletsky 2000). Primers were also designed for three genes showing no detectable variation in expression in the microarray analysis, which encoded nucleolin, actin, and 60S ribosomal protein L27a. These genes were used together as controls to normalize the qPCR measurements of test genes. For salmonid cDNAs on the microarray for which there were orthologous contigs available from smelt in the cGRASP contig collection (http://web.uvic.ca/grasp/) or for which cDNAs are already available in our lab, sequence alignment with the array cDNA was performed to select the region in the smelt cDNA most identical in sequence to the salmonid cDNA sequence on the array, and primers were designed to amplify DNA within this conserved interval. For cDNAs on the array for which no ortholog has been generated from smelt, primers were designed by aligning cDNA sequences from the array with those from one or more other fish species including zebrafish (D. rerio), barramundi (Lates calcarifer), yellow perch (Perca flavescens), crucian carp (Carassius auratus gibelio), and killifish (Fundulus hetero-clitus) in order to identify a widely conserved sequence region and then generating primer sequences from within that region. In this way, primers were designed that would amplify the cDNAs from smelt that are orthologous to the salmonid array cDNA sequences. All primer
oligonucleo-tides were obtained from Integrated DNA Technologies with standard desalting. The primer sequences are shown in Table1. PCR product sizes and specificities were evaluated for each primer set by agarose gel electrophoresis prior to qPCR analysis.
The qPCR reaction pre-mixes were prepared consisting of 10 µL iQ SYBR Green Supermix (Bio-Rad), 6.4 µL nuclease-free water (Sigma-Aldrich), and 0.8 µL each forward and reverse primers (10 µM; IDT DNA Technologies) for each primer pair, adding these to 2 µL of the diluted cDNA as template for a 20 µL final reaction volume. Thermocycling was performed on a LightCycler LC480 instrument (Roche) and included a 10-min cycle at 95°C to activate the enzyme, 45 cycles of 20 s at 95°C, 20 s at 58°C, 10 s at 72°C, and 10 s at 84°C for fluorescence data capture, then a 50°C through 95°C melt curve analysis. Threshold cycle data were exported to Excel files for further analysis using the BestKeeper software (Pfaffl et al. 2004) for consolidation of multiple reference genes and Q-gene software (Simon 2003) for calculation of normalized expression. Data were analyzed by ANOVA using the Tukey post-test with p<0.05 considered as significant.
Results
Microarray Analysis of Gene Expression
Hybridization of smelt liver cDNA to the salmonid micro-array resulted in signals above background for approxi-mately 30% of the microarray features. This level of hybridization is consistent with other studies using this microarray (Rise et al. 2004b; von Schalburg et al. 2005). Using a twofold minimum difference as the criterion for differential regulation, 83 genes were identified. Among these genes, 69 were classified as up-regulated and 14 as down-regulated in January compared with October levels in the microarray analysis (Table2).
qPCR Analysis of Gene Expression in Microarray Samples Because a heterologous microarray was used, a subset of the genes identified as differentially expressed in October and January in the array analysis was subsequently analyzed for differential gene expression by qPCR in the three individual samples that had been pooled for array hybridization to provide an independent measure of gene expression. Among the 11 genes classified as up-regulated on the array and selected for further examination, nine were found to be significantly up-regulated by qPCR in the same sample set and two were not (Table 2). The fold-change values obtained by qPCR for the nine significantly up-regulated genes corresponded well with those obtained by
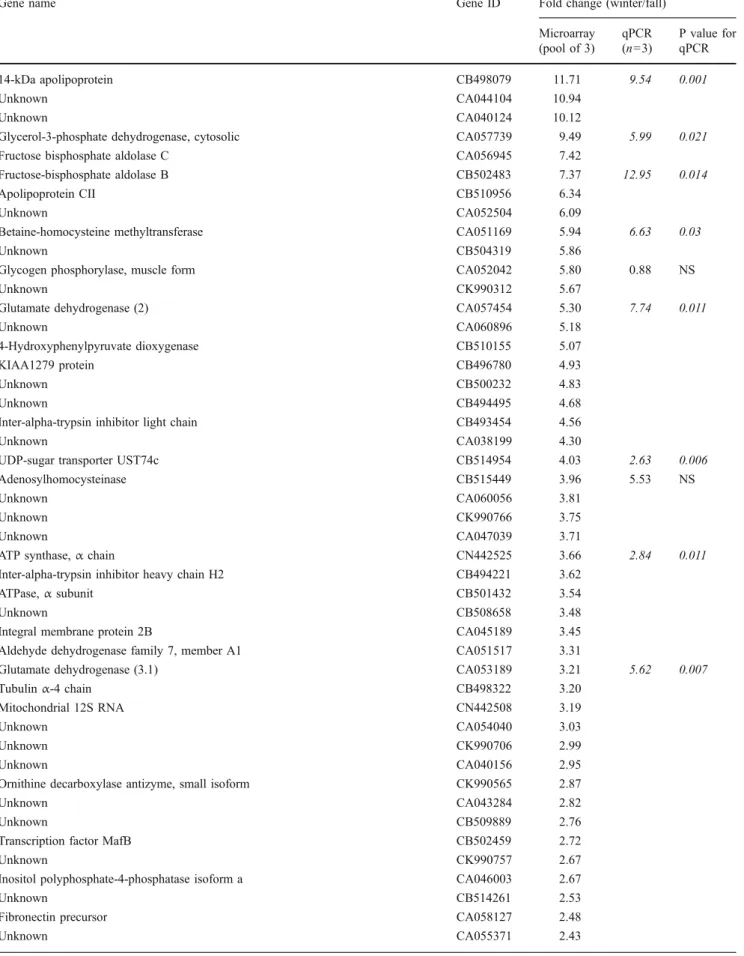
Table 2 January/October expression ratios of genes identified by microarray and examined by qPCR
Gene name Gene ID Fold change (winter/fall) Microarray (pool of 3) qPCR (n=3) P value for qPCR 14-kDa apolipoprotein CB498079 11.71 9.54 0.001 Unknown CA044104 10.94 Unknown CA040124 10.12
Glycerol-3-phosphate dehydrogenase, cytosolic CA057739 9.49 5.99 0.021 Fructose bisphosphate aldolase C CA056945 7.42
Fructose-bisphosphate aldolase B CB502483 7.37 12.95 0.014 Apolipoprotein CII CB510956 6.34
Unknown CA052504 6.09
Betaine-homocysteine methyltransferase CA051169 5.94 6.63 0.03
Unknown CB504319 5.86
Glycogen phosphorylase, muscle form CA052042 5.80 0.88 NS
Unknown CK990312 5.67
Glutamate dehydrogenase (2) CA057454 5.30 7.74 0.011
Unknown CA060896 5.18
4-Hydroxyphenylpyruvate dioxygenase CB510155 5.07
KIAA1279 protein CB496780 4.93
Unknown CB500232 4.83
Unknown CB494495 4.68
Inter-alpha-trypsin inhibitor light chain CB493454 4.56
Unknown CA038199 4.30
UDP-sugar transporter UST74c CB514954 4.03 2.63 0.006 Adenosylhomocysteinase CB515449 3.96 5.53 NS
Unknown CA060056 3.81
Unknown CK990766 3.75
Unknown CA047039 3.71
ATP synthase, α chain CN442525 3.66 2.84 0.011 Inter-alpha-trypsin inhibitor heavy chain H2 CB494221 3.62
ATPase, α subunit CB501432 3.54
Unknown CB508658 3.48
Integral membrane protein 2B CA045189 3.45 Aldehyde dehydrogenase family 7, member A1 CA051517 3.31
Glutamate dehydrogenase (3.1) CA053189 3.21 5.62 0.007 Tubulin α-4 chain CB498322 3.20
Mitochondrial 12S RNA CN442508 3.19
Unknown CA054040 3.03
Unknown CK990706 2.99
Unknown CA040156 2.95
Ornithine decarboxylase antizyme, small isoform CK990565 2.87
Unknown CA043284 2.82
Unknown CB509889 2.76
Transcription factor MafB CB502459 2.72
Unknown CK990757 2.67
Inositol polyphosphate-4-phosphatase isoform a CA046003 2.67
Unknown CB514261 2.53
Fibronectin precursor CA058127 2.48
microarray, with differences less than twofold between expression ratios in the pooled sample obtained by micro-array and mean expression ratios of the individual samples obtained by qPCR for each gene tested. Among the four genes found to be down-regulated on the array that were
further analyzed, only one showed significant down-regulation in qPCR analysis, and two others showed no significant change. The only incongruent result was for the peroxisomal multifunctional enzyme type 2 gene, which was classified as down-regulated based upon microarray
Table 2 (continued)
Gene name Gene ID Fold change (winter/fall) Microarray (pool of 3) qPCR (n=3) P value for qPCR Ubiquitin-conjugating enzyme E2 E1 CA056463 2.42 2.54 0.017 Forkhead box protein P2 CA037805 2.42
Unknown CA054812 2.42
Myc proto-oncogene protein CB517923 2.38 Estradiol 17-β-dehydrogenase 2 CA062348 2.36 GABA receptor-associated protein-like 2 CA054111 2.32
Unknown CB505692 2.31 Unknown CB516852 2.23 Unknown CB502720 2.22 Unknown CB497954 2.21 Unknown CA051850 2.15 Cathepsin B CA041567 2.12 Unknown CK990994 2.12
Zinc finger protein 183 CA054117 2.11
Unknown CA060800 2.11
Unknown CA054194 2.11
Unknown CA060592 2.10
Unknown CB494761 2.09
NADH-ubiquinone oxidoreductase, 20-kDa subunit, mitochondrial CB512348 2.08
Unknown CA062342 2.08
Transposase CA037517 2.07
ATP synthase β chain, mitochondrial CB498067 2.01
Unknown CA051890 2.00
Prolactin CK991050 0.49
Unknown CB501798 0.48
Synaptic vesicle membrane protein VAT-1 CA052848 0.47 G1/S-specific cyclin E1 CA055138 0.46 Bone morphogenetic protein 4 CA056395 0.46
Signal sequence receptor, γ subunit CK990390 0.45 0.30 0.041 Apolipoprotein A-I-1 CB497259 0.42 0.63 NS Peroxisomal multifunctional enzyme type 2 (17-β-hydroxysteroid dehydrogenase 4) CB501079 0.42 2.66 0.03
Unknown CA058307 0.42
Unknown CB505334 0.40
Unknown CA062361 0.34
Unknown CA051857 0.33
G protein-coupled receptor CK990254 0.29
PC2 glutamine/Q-rich-associated protein CA057970 0.26 3.01 NS Genes found to be twofold up- or down-regulated in the microarray analysis performed using cDNA preparations from pooled mRNA are listed with the fold change values obtained. Mean fold change for a subset of genes was determined in the same samples measured individually by qPCR are also listed. For significant qPCR results (p<0.05), means and p values are shown in italics.
hybridization and showed significant up-regulation when analyzed by qPCR (Table2).
Expression in Microarray-Identified Genes over the Season A subset of genes identified by microarray analysis was selected for a qPCR-based analysis of seasonal expression cycles. The qPCR reactions on seasonal samples were successful for 14 genes, but failed to produce regular products for betaine-homocysteine methyltransferase, and that gene was therefore not analyzed further. Differential regulation over the season was evident for ten genes, as shown in Fig.1. However, there appear to be different cycles of expression for the genes. Genes encoding the 14-kDa apolipoprotein, UDP-sugar transporter, ATP synthase α chain, glutamate dehydrogenase 3.1, and peroxisomal multifunc-tional enzyme type 2 increased in expression over the winter months but were no longer significantly different from October levels in March, suggesting a winter up-regulation with rapid return to fall levels. The expression of ubiquitin-conjugating enzyme E2 E1, adenosylhomocysteinase, and fructose-bisphosphate aldolase B genes increased in the fall and remained elevated through to March, suggesting a more extended seasonal cycle. The glutamate dehydrogenase 2 gene also remained significantly up-regulated in March, although there appeared to be a substantial decline in its expression that month, suggesting that it could return to October values within another month. The gene encoding PC2 glutamine/Q-rich-associated protein was unique among those examined in showing no significant change over winter but an increasing trend over the season with significant up-regulation only in March. The other genes tested, including glycogen phosphorylase, signal sequence receptor γ, and apolipoprotein A-I-1 showed no significant change in expression over the season; however, wide variability in the expression values for those genes may have obscured seasonal differences for some of those genes if they did occur.
Although the expression of the cytosolic NAD+ -dependent glycerol-3-phosphate dehydrogenase (GPDH) gene has been shown to vary seasonally (Liebscher et al.
2006), it was re-examined within the group of 15 genes selected from the microarray for consistency. This re-analysis confirmed its significant seasonal up-regulation; however, the data are not shown here because the seasonal expression of GPDH in these samples was previously reported.
Discussion
The goal of this study was to generate a representative profile of the transcriptome of smelt liver in response to the
winter season. Although there are substantial genomics resources available for smelt, including large expressed sequence tag databases, multiple cDNA libraries, and a bacterial artificial chromosome library (von Schalburg et al.
2008), no nucleic acid microarray is available for osmerid fish species. Nonetheless, heterologous microarray experi-ments present an efficient choice for examining a species such as smelt. Previous reports suggest that this approach can be successful and highly informative for diverse vertebrate species (Renn et al. 2004; Buckley 2007; Eddy and Storey 2008). The smelt cDNA has been shown to interact with the cGRASP 16K salmonid cDNA microarray with approximately 30% of the array features hybridizing to smelt liver cDNA (Rise et al. 2004b; von Schalburg et al.
2005). The overall hybridization of smelt cDNA was approximately half those of the salmonid cDNAs to the array (von Schalburg et al. 2005). Those reported findings are consistent with hybridization results of the current study. The lower level of hybridization for smelt cDNA would appear to result from the evolutionary divergence between smelt and salmonids. Smelt belong to the order Osmeriformes, distinct from the Salmoniformes, and as noted by von Schalburg et al. (2005), mitogenomics show that these orders are not monophyletic (Ishiguro et al.
2003). It is likely that a proportion of the genes expressed in smelt would not hybridize adequately to the array due to sequence divergence. Furthermore, for genes that are absent in salmonids or not included on the array, there would be no signal. For example, the smelt antifreeze protein gene, which was previously shown to be differentially expressed over the season (Liebscher et al. 2006), would not figure among the results of this array hybridization because this gene is absent in representative salmonids (Graham et al.
2008). In contrast, the most highly conserved genes among salmonid and osmerid species would be expected to hybridize most efficiently. For this reason, genes with roles in essential and universal processes would be expected to be detected in these hybridizations, and their differential regulation should be evident if it occurred over the winter season in smelt. There are multiple factors that would be expected to generate changes in gene expression over the course of the winter such as temperature, photoperiod, diet, growth, and reproduction, and the differentially regulated genes would show the scope of change that occurs during winter in this species.
The substantial winter up-regulation of cytosolic NAD+ -dependent GPDH, evident in the array analysis and confirmed in the October and January array samples using qPCR, is consistent with previous findings on the fall and winter regulation of this gene, which had shown a dramatic increase in its expression until February when it begins to decline (Liebscher et al.2006). The synthesis of glycerol in smelt liver from amino acids and glucose has been
0.00 0.02 0.04 0.06 average MNE 0 2 4 6 *** 0 40 80 120 0 1 2 0.0 0.4 0.8 1.2 0 1 2 3 4 * ** 0.0 0.4 0.8 1.2 1.6 0 0.5 1 1.5 0.00 0.03 0.06 0.09 average MNE 0 1 2 3 4 ** * * 0 10 20 30 0 2 4 6 8 *** *** *** 0 100 200 300 n 0 2 4 6 8 * 0 4 8 12 0 1.5 3 4.5 * *** ** 0 7 14 21 0 2 4 6 *** *** *** * 0.00 0.03 0.06 0.09 0 0.4 0.8 1.2 0 100 200 300
Sep Oct Nov Dec Jan Feb Mar Apr Sep Oct Nov Dec Jan Feb Mar Apr Sep Oct NovDec Jan Feb Mar Apr
Sep Oct NovDec Jan Feb Mar Apr
Sep Oct NovDec Jan Feb Mar Apr Sep Oct Nov Dec Jan Feb Mar Apr
Sep Oct Nov Dec Jan Feb Mar Apr 0 5 10 15 ** *** * 0.000 0.002 0.004 0.006
Sep Oct Nov Dec Jan Feb Mar Apr
Sep Oct Nov Dec Jan Feb Mar Apr
Sep Oct Nov Dec Jan Feb Mar Apr Sep Oct Nov Dec Jan Feb Mar Apr
Sep Oct Nov Dec Jan Feb Mar Apr
Sep Oct Nov Dec Jan Feb Mar Apr
average MNE 0 5 10 15 * * 0 1 2 3 average MNE 0 1 2 3 **
Apo14K AldoB GPase GDH2
UST AHC ATPα GDH3
Apo14K
UCE SSR PME2 ApoA1
PCQ AP
Relative expression
Relative expression
Relative expression
suggested by radiotracer experiments (Raymond and Driedzic 1997) and confirmed by NMR analysis (Walter et al.2006). Rapid glycerol synthesis involves the conver-sion of dihydroxyacetone phosphate plus NADH to glycerol-3-phosphate plus NAD+ in the GPDH-catalyzed reaction. Glycerol-3-phosphate is subsequently converted to glycerol, but it is unclear how the cells might deal with the accumulated NAD+. Genes encoding two isoforms of glutamate dehydrogenase (GDH) are among those most highly up-regulated on the microarray and confirmed to be seasonally up-regulated by qPCR. Isoforms of GDH can catalyze the oxidative deamination of glutamate plus NADP+/ NAD+ to yield α-ketoglutarate plus NADH/NADPH. Smelt derive energy from a protein-rich diet during winter (Driedzic and Ewart 2004) which, in concert with transaminases, would require the deamination reaction. Therefore, the concomitant expression of GPDH and GDH suggests a mechanism for redox balance in hepatocytes during acceler-ated glycerol synthesis. Furthermore, the ammonia produced by the GDH-catalyzed reaction is a precursor for the synthesis of urea, which also accumulates in smelt plasma during winter (Raymond1998; Treberg et al. 2002). In the catabolism of glucose, aldolase B cleaves fructose-1,6-bisphosphate into glyceraldehyde-3-phosphate and dihydroxyacetone phos-phate. Therefore, the strong up-regulation of the gene encoding aldolase B during winter may also reflect the increased flux through this pathway.
Other genes may also be accommodating the metabolic shift required to produce substantial glycerol and AFP during winter. Ubiquitin-conjugating enzyme E2 E1 catalyzes the conjugation of ubiquitin with intracellular proteins, which are thereby tagged for proteolysis. This gene is up-regulated in smelt during winter, and the amino acids thereby released can be used for gluconeogenesis and/or glyceroneogenesis (through the activity of enzymes such as GDH discussed above) or as precursors for the synthesis of other proteins.
These two processes would allow the catabolism of cell proteins to produce glycerol and antifreeze proteins, respec-tively, which both accumulate to high levels during the winter (Lewis et al.2004). The up-regulation of an enzyme involved in ubiquination suggests that dietary protein may not always be sufficient to accommodate the accelerated synthesis of compounds essential for winter freeze resistance in smelt. The continued increase in expression of the ubiquitin-conjugating enzyme E2 E1 gene over the winter months, corresponding to the depletion of glycogen in liver over the same interval (Treberg et al.2002), suggests dietary protein insufficiency as the winter progresses, although the overall protein synthesis rates in smelt during winter are unknown. The related ubiquitin-conjugating enzyme E2 17 was up-regulated in response to moderate cold exposure in all tissues examined in carp (C. carpio; Gracey et al. 2004), further suggesting cold-responsive protein catabolism. The role of ubiquination in generating protein precursors during winter in smelt may also require further study, as the ubiquitin– proteasome system has been shown to be unrelated to starvation in trout (Martin et al.2002). The up-regulation of ubiquitin-conjugating enzyme E2 E1 may alternatively reflect a need for enhanced protein turnover at cold temper-atures due to protein denaturation. Greater expression of genes encoding proteins involved in ubiquination, including ubiquitin-conjugating enzyme E2 isoforms, is evident in cold-adapted Antarctic species Dissostichus mawsoni com-pared with unrelated warm water fish species (Chen et al.
2008). Copy numbers of genes encoding these enzymes were also elevated in the genomes of Antarctic nototheniids compared with those located outside of the subfreezing waters of the Antarctic (Chen et al. 2008). Since the Antarctic species are not undergoing a seasonal change or obvious starvation, a metabolic role of ubiquitin in supplying protein precursors is unlikely, and a role in the disposal of denatured proteins appears reasonable. Nonetheless, the shift in ubiquitin-conjugating enzyme E2 E1 gene expression is not necessarily occurring in smelt for the same reasons as in the other species.
Lipid metabolism appears to be modulated over the season, with the qPCR analysis of microarray samples showing substantial up-regulation of the 14-kDa apolipo-protein during winter. This teleost apolipoapolipo-protein was first cloned from eel (Anguilla japonica) liver (Kondo et al.
2001). It does not appear to have a direct ortholog in mammals and its biological role is unknown (Kondo et al.
2001). The clear seasonal expression pattern of this gene in smelt may be helpful in guiding the examination of its recognition properties and role. The ATP synthase α chain gene follows a similar pattern of expression to the 14-kDa apolipoprotein. Besides its known role in mitochondrial ATP synthesis, ATP synthase is present at the plasma membrane of hepatocytes where it associates with lipid
Fig. 1 Seasonal variation in mRNA levels for microarray-identified genes in liver of smelt. Transcript levels for each gene studied relative to those for a set of reference genes were determined by qPCR, as described in “Materials and Methods”. For the Oct. 20, Nov. 1, and March 23 samples, n=4; for Dec 20, n=5; for Jan. 23, n=3. All data are mean normalized expression (MNE) represented as means ± SEM. Asterisks indicate significant differences compared to October values, with *, **, and *** signifying p<0.05, 0.01, and 0.001, respectively. Gene names abbreviated on the graph labels are the following: 14-kDa apolipopro-tein (Apo14K), fructose-bisphosphate aldoalse B (AldoB), glycogen phosphorylase, muscle form (GPase), glutamate dehydrogenase 2 (GDH2), UDP-sugar transporter UST74c (UST), adenosylhomocystei-nase (AHC), ATP synthase, α chain (ATPα), glutamate dehydrogeadenosylhomocystei-nase 3.1 (GDH3), ubiquitin-conjugating enzyme E2 E1 (UCE), signal sequence receptor, γ subunit (SSR), peroxisomal multifunctional enzyme type 2/17-β-hydroxysteroid dehydrogenase 4 (PME2), apoli-poprotein A-I-1 (ApoAI1), PC2 glutamine/Q-rich-associated protein (PCQAP)
rafts and regulates the internalization of lipoproteins (Champagne et al.2005). Therefore, the up-regulation of these two genes suggests modulation of lipid metabolism through the winter season. The increase in adenosylho-mocysteinase gene expression over the winter months may also modulate lipid metabolism. This enzyme hydrolyzes adenosylmethionine, which is an inhibitor of adenosylmethionine-driven methylation reactions, and it therefore reduces the rate of AdoMet-dependent methyl-ation of phospholipids (Malanovic et al. 2008). The adenosylmethionine-dependent methyltransferases meth-ylate nuclear molecules including nucleic acids, histones, and lipids such as phosphatidylethanolamine, which is converted to phosphatidylcholine. Therefore, by removing the inhibitor of these enzymes, adenosylhomocysteinase can regulate multiple processes, most notably the synthe-sis of phosphatidylcholine (Malanovic et al. 2008). A further enzyme up-regulated in winter compared with fall is betaine-homocysteine methyltransferase (BHMT), which converts homocysteine to methionine. Induction of BHMT in rat hepatoma cells increases apolipoprotein B mRNA levels, which in turn leads to greater secretion of triacylglycerol and apolipoprotein B-based lipoproteins from hepatocytes (Sparks et al.2006). Thus, considerable modulation of lipid and triacylglycerol synthesis and transport appear to take place during winter in smelt liver, consistent with the response of carp liver to low temperature (Gracey et al.2004; Gracey2007).
The up-regulation of adenosylhomocysteinase and BHMT may also contribute to the production of amino acids that are required for AFP synthesis. Expression of the C-type lectin-like smelt type II AFP in liver follows a cycle that begins prior to the initial fall sampling (Liebscher et al.
2006), and the up-regulation of the two enzymes may contribute to the production of amino acids that are required for AFP synthesis. AFP mRNA levels remain elevated until April, suggesting that rapid synthesis of AFP is underway throughout the winter months. This type II AFP is rich in the sulfur amino acids compared with the average for proteins. The mole percentages of Met and Cys are 3.8% and 6.3%, respectively, in smelt AFP compared with averages in the SwissProt database of 1.8% and 3.3%, respectively. Therefore, Met and Cys would be incorporated into AFP at a considerable rate in hepatocytes, with the associated risk of their depletion over the winter. The elevated expression of BHMT in the winter microarray samples shown by qPCR analysis may reflect altered metabolism of the sulfur amino acids to accommodate accelerated AFP synthesis. The type II AFP also has an N-linked glycan (Ewart et al. 1992; Achenbach and Ewart
2002), and its synthesis and secretion would require rapid addition of carbohydrate, followed by processing and trimming. The winter up-regulation of the gene encoding
UDP-sugar transporter UST74c may facilitate this AFP processing. The UST74c transporter carries UDP-sugars, including UDP-GlcNAc from the cytoplasm into the lumen of the endoplasmic reticulum and/or Golgi com-partments of the cell where they become available for covalent attachment to nascent glycoproteins (Goto et al.
2001; Fortini2001; Selva et al.2001). The maintenance of UDP-GlcNAc levels in the Golgi is crucial to cell growth control because it modulates the extent of N-glycan branching of key growth factor receptors (Lau et al.
2007). Therefore, up-regulation of UST74c, and possibly related transporters not detected in this study, may be valuable in maintaining cell growth during high type II AFP synthesis.
The role of the up-regulated 17-β-hydroxysteroid dehydrogenase 4 gene during winter in smelt is not yet clear. The encoded protein comprises three enzymes in tandem, including a member of the short-chain alcohol dehydrogenase family, a hydratase, and a lipid carrier domain, which catalyze three consecutive steps in beta-oxidation (Breitling et al. 2001). The protein also has a role in the interconversion between the 17-ketosteroids such as androstenedione or estrone and their more active 17-β-hydroxysteroid counterparts such as testosterone and 17-β-estradiol (Brown et al.2004). Since the smelt spawn in the spring, a role for differential expression of this gene in reproduction is possible; however, in male brown trout, no seasonal variation was evident in its expression (Castro et al. 2009). Moreover, in yeast (S. cerevisiae), the orthologous FOX2 gene is up-regulated at low tempera-ture (4°C) and down-regulated at high temperatempera-ture (35°C), implying a specific role in cold adaptation (Homma et al.
2003). Since yeast do not produce steroid hormones, the beta-oxidation function appears to be the one that is relevant in the cold.
The positive cofactor 2 glutamine/Q-rich-associated protein gene, which was classified as down-regulated by microarray, was found to be up-regulated in the microarray samples when analyzed by qPCR. The expression pattern of this gene also showed a constant and substantial increase over the timeframe of the measurements rather than a seasonal cycle. The cofactor 2-associated protein C2 belongs to the mediator complex protein that functions as a co-activator function in RNA polymerase II-driven gene transcription (Berti et al. 2001). Its role in seasonal adaptation remains to be investigated.
Functional associations among the genes within this study were limited, partly because they were chosen to represent different pathways and processes. Nonetheless, four of the most highly up-regulated genes evident in the array study and subsequent qPCR analysis share a regulatory feature: modulation by cortisol. Glutamate dehydrogenase has been shown to be up-regulated by
cortisol in sea raven (Vijayan et al.1996) and mammalian liver (Timmerman et al.2003). Up-regulation of the aldolase B gene by dexamethasone was demonstrated in mammalian liver (Gomez et al.1994; Ito et al.1998). GPDH is similarly up-regulated by cortisol in differentiating mammalian adipo-cytes (Hauner et al. 1989) and glial cells (Cheng and de Vellis 2000). Two genes were identified as up-regulated during winter in the prior subtraction analysis of smelt liver transcripts, which encoded encoding FK506-binding protein 51 and the mitochondrial solute carrier 25 member 25, and both genes are known to be regulated by cortisol in mammals (Richards et al.2008). It is notable that in some of the mammalian studies, cortisol was added to high (pharmacological) levels that would not normally be ob-served in vivo. Nonetheless, the identification of multiple genes up-regulated in smelt during winter that are known to respond to cortisol in other species may suggest a role for cortisol in the regulation of winter adaptation of smelt. This would be consistent with the role of cortisol in low-temperature adaptation of killifish (F. heteroclitus; Schulte et al.2000).
The single gene confirmed as down-regulated in the microarray samples using qPCR encoded the γ subunit of the signal sequence receptor. This gene was not found to be significantly down-regulated over the winter season; how-ever, substantial variation within time points may have masked a seasonal down-regulation, and this deserves further study. The genes encoding the subunits of the signal sequence receptor, recently renamed translocon-associated protein, are up-regulated in endoplasmic reticulum stress (ER stress), and this protein is predicted to have a role in translocation of unfolded proteins from the ER for subsequent degradation (Nagasawa et al.2007). Therefore, the down-regulation of this gene evident in the qPCR analysis of microarray samples suggests diminished ER stress during winter in smelt. This would appear counter-intuitive considering the fact that proteins at these temper-atures are expected to be subject to cold denaturation and the accumulation of unfolded protein in the ER is a key trigger of ER stress. However, the presence of high glycerol in smelt during winter may counter ER stress by promoting general protein folding at low temperature or by interacting with specific ER stress regulators. Glycerol at 130 mM prevents ER stress-mediated apoptosis in human hepato-cytes treated with interferon-γ (Kanki et al. 2009). Since smelt accumulate glycerol during winter to levels that normally exceed that concentration, it is plausible that smelt liver cells are similarly protected. Thus, the role of glycerol in smelt during winter will need to be revisited as protection from protein denaturation and ensuing ER stress and cell death may be an important role of this adaptation. In summary, the current study reports on (1) the detection by microarray analysis of differential gene
regulation in fall and winter season, (2) an independent analysis of differential expression for a selection of gene identified by microarray in the fall and winter smelt samples using qPCR with statistical analysis, and (3) a further analysis of seasonal expression over the winter months for these genes. Together, the results confirm the universal role of some genes and processes in seasonal or cold adaptation across species, whereas they also reveal seasonal adaptations that appear more restricted in their distribution. A more thorough understanding of vertebrate cold adaptation may be instructive in ecology, environmen-tal physiology, and human health. In these contexts, it is important to begin identifying the general and more specific adaptations by comparative analysis.
Acknowledgments We thank Jason Williams (NRC Institute for Marine Biosciences; NRC-IMB). Matthew Rise (OSC), and Glenn Cooper (University of Victoria) for technical advice regarding hybridization to the cGRASP microarray. We are grateful to Suzanne Penny (NRC-IMB) for helpful discussion regarding data analysis and to Pung-Pung Huang (Academia Sinica) for sharing detailed microarray results from his laboratory. We also thank Stephen O’Leary (NRC-IMB) for review of the manuscript. This project was supported by NRC-IMB, Genome Canada, and Genome BC. WRD holds the Canada Research Chair in Marine Bioscience. This is NRC publication number 51736.
References
Achenbach JC, Ewart KV (2002) Structural and functional character-ization of a C-type lectin-like antifreeze protein from rainbow smelt (Osmerus mordax). Eur J Biochem 269:1219–1226 Berti L, Mittler G, Przemeck GK, Stelzer G, Gunzler B, Amati F,
Conti E, Dallapiccola B, Hrabe de Angelis M, Novelli G, Meisterernst M (2001) Isolation and characterization of a novel gene from the DiGeorge chromosomal region that encodes for a mediator subunit. Genomics 74:320–332
Brazma A, Hingamp P, Quackenbush J, Sherlock G, Spellman P, Stoeckert C, Aach J, Ansorge W, Ball CA, Causton HC, Gaasterland T, Glenisson P, Holstege FC, Kim IF, Markowitz V, Matese JC, Parkinson H, Robinson A, Sarkans U, Schulze-Kremer S, Stewart J, Taylor R, Vilo J, Vingron M (2001) Minimum information about a microarray experiment (MIAME)—toward standards for microarray data. Nat Genet 29:365–371
Breitling R, Marijanovic Z, Perovic D, Adamski J (2001) Evolution of 17beta-HSD type 4, a multifunctional protein of beta-oxidation. Mol Cell Endocrinol 171:205–210
Brown KA, Boerboom D, Bouchard N, Dore M, Lussier JG, Sirois J (2004) Human chorionic gonadotropin-dependent regulation of 17beta-hydroxysteroid dehydrogenase type 4 in preovulatory follicles and its potential role in follicular luteinization. Endocri-nology 145:1906–1915
Buckley BA (2007) Comparative environmental genomics in non-model species: using heterologous hybridization to DNA-based microarrays. J Exp Biol 210:1602–1606
Castro LF, Rocha MJ, Lobo-da-Cunha A, Batista-Pinto C, Machado A, Rocha E (2009) The 17beta-hydroxysteroid dehydrogenase 4: gender-specific and seasonal gene expression in the liver of brown trout (Salmo trutta f. fario). Comp Biochem Physiol B Biochem Mol Biol 153:157–164
Champagne KS, Sissler M, Larrabee Y, Doublie S, Francklyn CS (2005) Activation of the hetero-octameric ATP phosphoribosyl transferase through subunit interface rearrangement by a tRNA synthetase paralog. J Biol Chem 280:34096–34104
Chen Z, Cheng CH, Zhang J, Cao L, Chen L, Zhou L, Jin Y, Ye H, Deng C, Dai Z, Xu Q, Hu P, Sun S, Shen Y, Chen L (2008) Transcriptomic and genomic evolution under constant cold in Antarctic notothenioid fish. Proc Natl Acad Sci U S A 105:12944–12949
Cheng JD, de Vellis J (2000) Oligodendrocytes as glucocorticoid target cells: functional analysis of the glycerol phosphate dehydrogenase gene. J Neurosci Res 59:436–445
Chou MY, Hsiao CD, Chen SC, Chen IW, Liu ST, Hwang PP (2008) Effects of hypothermia on gene expression in zebrafish gills: upregulation in differentiation and function of ionocytes as compensatory responses. J Exp Biol 211:3077–3084
Cossins A, Fraser J, Hughes M, Gracey A (2006) Post-genomic approaches to understanding the mechanisms of environmentally induced phenotypic plasticity. J Exp Biol 209:2328–2336 Driedzic WR, Ewart KV (2004) Control of glycerol production by
rainbow smelt (Osmerus mordax) to provide freeze resistance and allow foraging at low winter temperatures. Comp Biochem Physiol B Biochem Mol Biol 139:347–357
Eddy SF, Storey KB (2008) Comparative molecular physiological genomics. Heterologous probing of cDNA arrays. Methods Mol Biol 410:81–110
Ewart KV, Rubinsky B, Fletcher GL (1992) Structural and functional similarity between fish antifreeze proteins and calcium-dependent lectins. Biochem Biophys Res Commun 185:335–340
Fletcher GL, Hew CL, Davies PL (2001) Antifreeze proteins of teleost fishes. Annu Rev Physiol 63:359–390
Fortini ME (2001) Sugar-coated pathways for developmental patterning. Nat Cell Biol 3:E229–E231
Goddard SV, Fletcher GL (2002) Physiological ecology of antifreeze proteins—a northern perspective. In: Ewart KV, Hew CL (eds) Molecular aspects of fish and marine biology, vol I: fish antifreeze proteins. World Scientific Publishing, Singapore, pp 17–60
Gomez PF, Ito K, Huang Y, Otsu K, Kuzumaki T, Ishikawa K (1994) Dietary and hormonal regulation of aldolase B gene transcription in rat liver. Arch Biochem Biophys 314:307–314
Goto S, Taniguchi M, Muraoka M, Toyoda H, Sado Y, Kawakita M, Hayashi S (2001) UDP-sugar transporter implicated in glycosylation and processing of Notch. Nat Cell Biol 3:816–822
Gracey AY (2007) Interpreting physiological responses to environmental change through gene expression profiling. J Exp Biol 210:1584– 1592
Gracey AY, Fraser EJ, Li W, Fang Y, Taylor RR, Rogers J, Brass A, Cossins AR (2004) Coping with cold: an integrative, multitissue analysis of the transcriptome of a poikilothermic vertebrate. Proc Natl Acad Sci U S A 101:16970–16975
Graham LA, Lougheed SC, Ewart KV, Davies PL (2008) Lateral transfer of a lectin-like antifreeze protein gene in fishes. PLoS ONE 3:e2616
Hauner H, Entenmann G, Wabitsch M, Gaillard D, Ailhaud G, Negrel R, Pfeiffer EF (1989) Promoting effect of glucocorticoids on the differentiation of human adipocyte precursor cells cultured in a chemically defined medium. J Clin Invest 84:1663–1670 Hayward SA, Murray PA, Gracey AY, Cossins AR (2007) Beyond
the lipid hypothesis: mechanisms underlying phenotypic plas-ticity in inducible cold tolerance. Adv Exp Med Biol 594:132– 142
Hirayama M, Ahsan MN, Mitani H, Watabe S (2008) CYR61 is a novel gene associated with temperature-dependent changes in fish metabolism as revealed by cDNA microarray analysis on a medaka Oryzias latipes cell line. J Cell Biochem 104:1297–1310
Homma T, Iwahashi H, Komatsu Y (2003) Yeast gene expression during growth at low temperature. Cryobiology 46:230–237 Ishiguro NB, Miya M, Nishida M (2003) Basal euteleostean
relation-ships: a mitogenomic perspective on the phylogenetic reality of the “Protacanthopterygii”. Mol Phylogenet Evol 27:476–488 Ito J, Kuzumaki T, Otsu K, Iuchi Y, Ishikawa K (1998) Hormonal
regulation of aldolase B gene expression in rat primary cultured hepatocytes. Arch Biochem Biophys 350:291–297
Ju Z, Dunham RA, Liu Z (2002) Differential gene expression in the brain of channel catfish (Ictalurus punctatus) in response to cold acclimation. Mol Genet Genomics 268:87–95
Kanki K, Kawamura T, Watanabe Y (2009) Control of ER stress by a chemical chaperone counteracts apoptotic signals in IFN-gamma-treated murine hepatocytes. Apoptosis 14:309–319
Kondo H, Kawazoe I, Nakaya M, Kikuchi K, Aida K, Watabe S (2001) The novel sequences of major plasma apolipoproteins in the eel Anguilla japonica. Biochim Biophys Acta 1531:132– 142
Lau KS, Partridge EA, Grigorian A, Silvescu CI, Reinhold VN, Demetriou M, Dennis JW (2007) Complex N-glycan number and degree of branching cooperate to regulate cell proliferation and differentiation. Cell 129:123–134
Lewis JM, Ewart KV, Driedzic WR (2004) Freeze resistance in rainbow smelt (Osmerus mordax): seasonal pattern of glycerol and antifreeze protein levels and liver enzyme activity associated with glycerol production. Physiol Biochem Zool 77:415–422 Liebscher RS, Richards RC, Lewis JM, Short CE, Muise DM, Driedzic
WR, Ewart KV (2006) Seasonal freeze resistance of rainbow smelt (Osmerus mordax) is generated by differential expression of glycerol-3-phosphate dehydrogenase, phosphoenolpyruvate car-boxykinase, and antifreeze protein genes. Physiol Biochem Zool 79:411–423
Malanovic N, Streith I, Wolinski H, Rechberger G, Kohlwein SD, Tehlivets O (2008) S-adenosyl-L-homocysteine hydrolase, key enzyme of methylation metabolism, regulates phosphatidylcholine synthesis and triacylglycerol homeostasis in yeast: implications for homocysteine as a risk factor of atherosclerosis. J Biol Chem 283:23989–23999
Malek RL, Sajadi H, Abraham J, Grundy MA, Gerhard GS (2004) The effects of temperature reduction on gene expression and oxidative stress in skeletal muscle from adult zebrafish. Comp Biochem Physiol C Toxicol Pharmacol 138:363–373
Martin SA, Blaney S, Bowman AS, Houlihan DF (2002) Ubiquitin-proteasome-dependent proteolysis in rainbow trout (Oncorhynchus mykiss): effect of food deprivation. Pflugers Arch 445:257–266
Nagasawa K, Higashi T, Hosokawa N, Kaufman RJ, Nagata K (2007) Simultaneous induction of the four subunits of the TRAP complex by ER stress accelerates ER degradation. EMBO Rep 8:483–489
Pfaffl MW, Tichopad A, Prgomet C, Neuvians TP (2004) Determination of stable housekeeping genes, differentially regulated target genes and sample integrity: BestKeeper-Excel-based tool using pair-wise correlations. Biotechnol Lett 26:509–515
Podrabsky JE, Somero GN (2004) Changes in gene expression associated with acclimation to constant temperatures and fluctuating daily temperatures in an annual killifish Austrofundulus limnaeus. J Exp Biol 207:2237–2254
Raymond JA (1992) Glycerol is a colligative antifreeze in some northern fishes. J Exp Zool 262:347–352
Raymond JA (1998) Trimethylamine oxide and urea synthesis in rainbow smelt and some other northern fishes. Physiol Zool 71:515–523
Raymond JA, Driedzic WR (1997) Amino acids are a source of glycerol in cold-acclimatized rainbow smelt. Comp Biochem Physiol B 118:387–393
Renn SC, Aubin-Horth N, Hofmann HA (2004) Biologically meaningful expression profiling across species using heterologous hybridization to a cDNA microarray. BMC Genomics 5:42
Richards RC, Achenbach JC, Short CE, Kimball J, Reith ME, Driedzic WR, Ewart KV (2008) Seasonal expressed sequence tags of rainbow smelt (Osmerus mordax) revealed by subtractive hybridization and the identification of two genes up-regulated during winter. Gene 424:56–62
Rise ML, Jones SR, Brown GD, von Schalburg KR, Davidson WS, Koop BF (2004a) Microarray analyses identify molecular biomarkers of Atlantic salmon macrophage and hematopoietic kidney response to Piscirickettsia salmonis infection. Physiol Genomics 20:21–35
Rise ML, von Schalburg KR, Brown GD, Mawer MA, Devlin RH, Kuipers N, Busby M, Beetz-Sargent M, Alberto R, Gibbs AR, Hunt P, Shukin R, Zeznik JA, Nelson C, Jones SR, Smailus DE, Jones SJ, Schein JE, Marra MA, Butterfield YS, Stott JM, Ng SH, Davidson WS, Koop BF (2004b) Development and application of a salmonid EST database and cDNA microarray: data mining and interspecific hybridization characteristics. Genome Res 14:478–490
Rise ML, Douglas SE, Sakhrani D, Williams J, Ewart KV, Rise M, Davidson WS, Koop BF, Devlin RH (2006) Multiple microarray platforms utilized for hepatic gene expression profiling of GH transgenic coho salmon with and without ration restriction. J Mol Endocrinol 37:259–282
Rozen S, Skaletsky H (2000) Primer3 on the WWW for general users and for biologist programmers. Methods Mol Biol 132:365–386 Schulte PM, Glemet HC, Fiebig AA, Powers DA (2000) Adaptive variation in lactate dehydrogenase-B gene expression: role of a stress-responsive regulatory element. Proc Natl Acad Sci U S A 97:6597–6602
Selva EM, Hong K, Baeg GH, Beverley SM, Turco SJ, Perrimon N, Hacker U (2001) Dual role of the fringe connection gene in both heparan sulphate and fringe-dependent signalling events. Nat Cell Biol 3:809–815
Simon P (2003) Q-Gene: processing quantitative real-time RT-PCR data. Bioinformatics 19:1439–1440
Sparks JD, Collins HL, Chirieac DV, Cianci J, Jokinen J, Sowden MP, Galloway CA, Sparks CE (2006) Hepatic very-low-density lipoprotein and apolipoprotein B production are increased following in vivo induction of betaine-homocysteine S-methyltransferase. Biochem J 395:363–371
Tai SL, Daran-Lapujade P, Walsh MC, Pronk JT, Daran JM (2007) Acclimation of Saccharomyces cerevisiae to low temperature: a chemostat-based transcriptome analysis. Mol Biol Cell 18:5100– 5112
Timmerman M, Wilkening RB, Regnault TR (2003) Induction of glutamate dehydrogenase in the ovine fetal liver by dexamethasone infusion during late gestation. Exp Biol Med (Maywood) 228:100– 105
Treberg JR, Wilson CE, Richards RC, Ewart KV, Driedzic WR (2002) The freeze-avoidance response of smelt Osmerus mordax: initiation and subsequent suppression of glycerol, trimethylamine oxide and urea accumulation. J Exp Biol 205:1419–1427 Vijayan M, Mommsen T, Gl E, Met H, Moon T (1996) Metabolic
effects of cortisol treatment in a marine teleost, the sea raven. J Exp Biol 199:1509–1514
von Schalburg KR, Rise ML, Cooper GA, Brown GD, Gibbs AR, Nelson CC, Davidson WS, Koop BF (2005) Fish and chips: various methodologies demonstrate utility of a 16,006-gene salmonid microarray. BMC Genomics 6:126
von Schalburg KR, Leong J, Cooper GA, Robb A, Beetz-Sargent MR, Lieph R, Holt RA, Moore R, Ewart KV, Driedzic WR, ten Hallers BF, Zhu B, de Jong PJ, Davidson WS, Koop BF (2008) Rainbow smelt (Osmerus mordax) genomic library and EST resources. Mar Biotechnol (NY) 10:487–491
Walter JA, Ewart KV, Short CE, Burton IW, Driedzic WR (2006) Accelerated hepatic glycerol synthesis in rainbow smelt (Osmerus mordax) is fuelled directly by glucose and alanine: a1H and13C nuclear magnetic resonance study. J Exp Zoolog A Comp Exp Biol 305:480–488