Automatic Service Selection in Dynamic Wireless
Networks
by
George J. Lee
B.S., University of California, Berkeley (2000)
Submitted to the Department of Electrical Engineering and Computer
Science
in partial fulfillment of the requirements for the degree of
Master of Science in Computer Science and Engineering
at the
MASSACHUSETTS INSTITUTE OF TECHNOLOGY
September 2003
@
Massachusetts Institute of Technology 2003. All rights reserved.
A uthor ...
...
Department of Electrical En
eering and Computer Science
September 2, 2003
Certified by
...
John Wroclawski
Research Scientist
Thesis Supervisor
-- 01 -'7Accepted by....
...
Arthur C. Smith
Chairman, Department Committee on Graduate Students
MASSACHU-SETTS INSTITUTE OF TECHNOLOGY
Automatic Service Selection in Dynamic Wireless Networks
by
George J. Lee
Submitted to the Department of Electrical Engineering and Computer Science on September 2, 2003, in partial fulfillment of the
requirements for the degree of
Master of Science in Computer Science and Engineering
Abstract
We consider the use of machine learning agents to autonomously and continually select among wireless access services available to a user. The work in this thesis is part of the Personal Router project; a technical research program aimed at reshaping the wireless net-work access market towards greater competition and diversity [11]. A critical function within the PR vision is that of service selection. The Personal Router, acting on behalf of its user, must intelligently, intuitively, and autonomously select from among the available services the one that best meets its user's needs. It must do this transparently, without involving, bothering, or distracting its user. Previous approaches to wireless service selec-tion, including static policies and manual selecselec-tion, do not adequately address individual user preferences.
Instead, we explore a machine learning approach, in which an intelligent agent learns user preferences and makes selections automatically on behalf of the user with minimal user involvement. We developed an agent model based on a partially observable Markov decision process (POMDP) abstractly describing the challenges and goals of service selec-tion. Next we devised a service selection architecture providing the framework for an agent that can learn from user feedback and accurately select services even when the set of avail-able services changes. Our approach uses ideas from reinforcement learning to estimate the quality and cost of services, and neural networks to predict the value of new services. We implemented a software prototype of the PR using this architecture and evaluated it with user experiments.
Our experimental results show that our approach can effectively estimate the user per-ceived quality and cost of services even when the set of available services changes for high bandwidth web browsing. They suggest that compared to manual selection, the PR requires less interaction to select a good service and can provide more consistent performance. Thesis Supervisor: John Wroclawski
Acknowledgments
I would like to thank my thesis advisor John Wroclawski for his feedback, support, and
guidance. Steven Bauer contributed much of the implementation framework, helped in the design and architecture of the Personal Router, and gave valuable feedback. Many of the machine learning and user modeling ideas and techniques used in this paper arose from discussions with Peyman Faratin. Xiaowei Yang helped me better understand network traffic profiling. I am grateful to Georgios Theocharous, Kurt Steinkraus, and Yu-Han Chang for their advice in designing the POMDP model. Many thanks go to those who participated in the user experiments.
Contents
1 Introduction
2 The Service Selection Problem
2.1 Network Services . . . .. 2.2 User Behavior . . . .. 2.3 Related Work . . . .. 3 Agent Model 3.1 States S . . . . 3.2 Observations Z . . . . 3.3 Actions A . . . . 3.4 Transitions . . . . 3.5 Objective . . . . 4 Architecture 4.1 User Interface . . . . 4.2 Service Evaluator . . . . . 4.3 Change Controller . . . . . 4.4 Service Value Predictor . . 5 Approach 5.1 User Interface . . . . .. . . . .. 5.2 Service Evaluator .. ... 5.3 Change Controller... ... . 9 11 11 13 16 19 19 20 21 22 23 25 26 28 29 29 31 31 33 34 . . . . . . . . . . . . . . . . . . . . . . . .
5.4 Service Value Predictor . . .. . . . 36 6 Results 39 6.1 User Experiments . . . 39 6.1.1 Network. . . . 39 6.1.2 User Groups . . . 40 6.1.3 Procedure . . . 40 6.2 Evaluation Results . . . 41
6.2.1 Learning Quality and Cost . . . 42
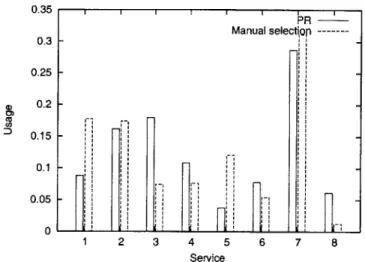
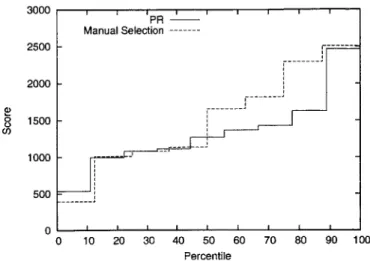
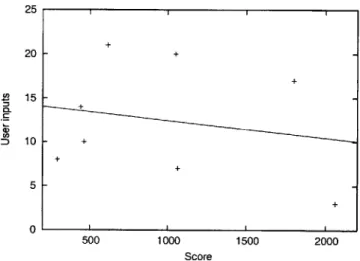
6.2.2 PR vs. Manual Selection . . . 44
Chapter 1
Introduction
This thesis considers the use of machine learning agents to autonomously and continually select among wireless access services available to a user. Our context is the Personal Router (PR) project; a technical research program aimed at reshaping the wireless network access market toward greater competition and diversity [11]. By allowing potential suppliers to easily advertise service offerings in a given area, and allowing users to transparently and continually discover, negotiate terms for, and switch between available network services, we aim to greatly lower the barriers to entry in the wireless service market, creating a rich ecosystem of large and small service providers with different offerings, capabilities, and business models.
A critical function within the PR vision to enable user choice is that of service
selec-tion. The Personal Router, acting on behalf of its user, must intelligently, intuitively, and
autonomously select from among the available services the one that best meets its user's needs. It must do this transparently, without involving, bothering, or distracting its user. Its task is difficult-acceptable service choice depends not only on the features and cost of the service, but also on the network and user context, including such dynamic variables as the applications the user is running and the user's higher level goals. Beyond this, the set of available services may change rapidly with time and the user's location, requiring the PR to choose new services frequently. Without the automatic selection capability granted
by the PR, users could not possibly respond to the constantly changing set of services and
Previous approaches to wireless service selection, including static policies and manual selection, are inadequate. Static policies [38, 16, 34] cannot accommodate individual user preferences and do not adapt to changing user goals and contexts. Manual selection is unappealing because of users' reluctance to constantly interact with a user interface while engaged in a network activity, particularly in rapidly changing and complicated wireless service environments.
These considerations motivate us to explore a machine learning approach, in which an intelligent agent learns user preferences and makes selections automatically on behalf of the user with minimal user involvement. We developed an agent model abstractly de-scribing the challenges and goals of service selection. Next we devised a service selection architecture providing the framework for an agent that can learn from user feedback and accurately select services even when the set of available services changes and service fea-tures are not completely known. We implemented a software prototype of the PR using this architecture and evaluated it with user experiments.
This thesis presents our work in five parts. In Chapter 2, we give an overview of the challenges, complexity, and importance of the service selection problem and the assump-tions we make about the network and user. Secondly, we outline our agent model and clearly define the functions and goals of our agent in Chapter 3. Next in Chapter 4 we present our architectural framework for service selection in the PR and describe how its components operate in terms of the agent model. In Chapter 5, we present the details of our software implementation. Finally we illustrate the performance of our system with user experiments in Chapter 6.
Chapter 2
The Service Selection Problem
To address the problem of service selection, the PR requires accurate models of the network and user. The PR needs to know which services are available from the network and which services users prefer in their current context. Below we describe the research challenges involved in these network and user interactions and the assumptions we make about them.
2.1 Network Services
We can imagine many different mechanisms for selecting services. Users could
spec-ify their requirements and negotiate with providers for a service. Alternatively, service
providers could advertise the quality levels they offer and sell network service to users in an auction. They may also simply advertise their offerings and allow users to choose among them.
We abstractly represent the set of services available to the PR with the variable D. This set of available services may change as the user moves to new locations or service offerings change. Each of the available services x E D has an associated service profile
p(x) describing its features, including both quality and cost.
An ideal definition of a service profile is one for which the user's perception of a service is based solely on the features in its profile in a particular context. That is, two services with the same service profile would be perceived as equivalent to the user in that context. If this were the case, then the PR could make accurate selections based only on the features in the
service profile. In reality, however, it is not possible to capture all the variables that affect the user's perception of a service. Therefore in choosing which features to include in the profile, we have two considerations. First, service providers should be able to accurately describe services in terms of their profile features and ensure that services conform to their profiles. Providers may wish to advertise certain attributes instead of others, however, depending on marketing, business, and other considerations. Secondly, for the profiles to be relevant, these features must be related to the user's perception of a service.
To describe the quality of a service, we choose to use a two bucket profile [40], describ-ing a service in terms of its short term and long term burst characteristics. A two bucket profile consists of a token rate p, a burst size 0, and a refill interval Tre fill (calledforced-off
in [40]) after which the bucket is refilled if it is empty. This type of profile can describe a wide variety of services, including high and low bandwidth services and burstiness over different time scales. These characteristics are also more likely to correspond to the qual-ity features perceived by users for common activities such as web browsing that exhibit an on/off heavy-tailed traffic distribution. In addition, this system is similar to the well-studied token bucket traffic profiles [27].
Along with quality attributes, service profiles contain information about the cost of a service. In the simplest case, the cost may just be the price per unit time of a service pro-file given by the service provider. In general, however, service providers may advertise complex profiles with different initial costs or pricing depending on congestion, for exam-ple. Though it is possible to model services with time-varying quality and cost using a Markov decision process, the additional state space required greatly increases the time to learn service values. Therefore in our work, we choose to consider just two cost attributes, price per minute cmin and price per kilobyte Ckb, enabling providers to advertise services
using different pricing plans. The total cost ctotal of a service to the user is calculated by applying these cost attributes to the duration of usage t and the quantity of data transferred
y according to the equation:
Ctotal = Cmint + CkbY (2.1)
(p, 0, Tref ill, Cmin, Ckb) for a service s.
Service providers might not advertise services accurately and truthfully, however. For instance, a service provider may overstate the quality of their service to attract more cus-tomers, or the quality of a service may degrade for reasons outside their control. If adver-tised service profiles are incorrect, the PR can attempt to determine the true service profiles in several ways. It can passively monitor network traffic to construct a profile, but this requires time and may not be accurate. Alternatively it can attempt to actively measure the properties of the service [28, 23], but this also takes time and consumes bandwidth. Also, characteristics such as burst size are difficult to measure directly. If other users have expe-rienced the service before, the PR can use information collected from other users about the service or provider to guide its decisions [24]. Another possibility is to structure the mar-ketplace in such a way that providers have an incentive to advertise accurate service profiles [14]. Obtaining accurate service profiles is beyond the scope of this thesis, however. In the present work, we assume that services can be accurately described by the service profiles proposed and that providers advertise services truthfully. We also assume that the PR can seamlessly switch between available services without disruption using a mobility solution
such as mobile IP [30].
2.2
User Behavior
Users do not evaluate services purely in terms of service profiles. Instead, a user's prefer-ences depends on many factors, including their context, goals, perception of services, and willingness to explore. A user perceives services subjectively in terms of quality and cost. This perceived quality and cost may depend on the user's goals and context, including the user's activity and their current weighting between quality and cost. For example, a user may consider a high bandwidth, high latency service to have high quality for bulk file trans-fer but low quality for videocontrans-ferencing. Similarly, a service that charges by the byte may be low cost for email but high cost for streaming video.
To accurately select services, we must identify the user's context. The correct service for the user depends on what applications are running and their network requirements. Just
as users cannot state precisely what type of service they desire, however, it is infeasible for application designers to specify detailed network requirements for most applications. Furthermore, since the proper service depends on individual preferences and how the ap-plication is used, such apap-plication specified requirements have limited usefulness.
User context depends on more than just the application; it also depends on the activity of the application. If there are multiple applications and activities running at the same time or if they change very quickly, it may be unclear how to set the activity. Furthermore, a single application may perform many very different activities. For instance, a web browser can be used for bulk file transfer as well as streaming video. User applications or the operating system can make this information available to the PR.
Though our learning agent can function with very detailed definitions of user context and take into account several simultaneously running applications and activities, the addi-tional state space would slow the learning rate. In order to make the space of user contexts manageable and to improve performance, we only take note of the currently active ap-plication in our approach. We assume that a user usually only cares about the network performance of the current foreground application and define a user context g as this appli-cation. If we find that this definition is inadequate, we can change how context is defined without affecting the rest of the agent model.
Another factor that influences user decisions is their goals. If the user just wants to surf the web and read the news, then perhaps they prefer a low cost service. On the other hand, if they urgently need to transfer a large file, then they may want a high quality service even if it has high cost. Even if a user's perception of the quality and cost of a service remains unchanged, the service they prefer may depend on their changing goals and situations. One of the primary effects of changing user goals is a change in their trade-off between quality and cost, the two attributes of a service that users ultimately care about. To enable the PR to correctly select services when this quality/cost trade-off changes, we model this trade-off with a weighting w E [0, 1], where w = 0 means the user only cares about
cost, w = 1 means the user only cares about quality, and values in between represent intermediate weightings.
the user needs to complete an urgent task and requires the highest quality service available immediately, they probably do not want a randomly chosen service. In other situations, the user may be more willing to try out new services when they become available. The PR models this with a variable e E [0, 1] to allow users to express their changing tolerance for exploration, where e = 0 corresponds to minimal exploration while e = 1 represents high
tolerance for exploration.
We make several assumptions about user preferences. First, it is reasonable to assume that users evaluate services based on subjective quality and cost in a given context. That is, any two services which they perceive to have the same quality and cost in that context are perceived as equivalent. We assume that their orderings of services over quality and cost are complete-given any two services, the user can decide which one has higher quality or that they are indifferent. Similarly users can decide which of two services has higher cost or if they are indifferent. Additionally, users' cost and quality preferences are transitive-if service A has higher quality than service B, and B has higher quality than C, then they per-ceive A to have higher quality than C. Without these assumptions, user preferences would not be well-defined, making it impossible to specify which service a user prefers. These assumptions allow us to represent their perceptions of the quality and cost of a service s in context g with quality and cost functions q(g, s) and c(g, s), representing the user's or-derings over quality and cost. The user perceives service si to have higher quality than s, in context g if and only if q(g, si) > q(g, sj), and similarly if si is cheaper than sj, then
c(g, si) > c(g, sj). We choose to model a user's preference for services as a function of
the quality q(g, s) and cost c(g, s) of the current service s in the current context g and their current quality/cost weighting w, allowing us to model user preferences for services with a utility function u(q(g, s), c(g, s), w). This efficiently represents user preferences and en-ables the agent to reason about the quality and cost of services in different contexts with different user quality/cost trade-offs.
As mentioned earlier, the service profile does not capture all the factors that influence user perceived quality and cost. A user's perception of a service may depend also on other features not accessible to the agent, such as service provider reputation, end-to-end network delay to particular hosts in the network, or financial incentives not in the service profile.
For example, even if two services have identical service profiles, a user may perceive one to have higher quality because it has a shorter network round-trip time to MIT's web server, a feature not captured in the service profile. Similarly, if a user receives external compen-sation in the form of free pizza for using the service in a pizza shop, they may consider that service to have lower cost than the profile would indicate. For this reason, the agent cannot rely on service profiles alone to make its decisions.
Service profiles are still useful for estimating service value if we assume the service profile features are partially correlated with q(g, s) and c(g, s), however. In other words, if two services have similar profiles, they are likely to be perceived as having similar quality and cost. This assumption allows the PR to use service profiles to predict the quality and cost of services not yet experienced by the user based on previous observations.
2.3 Related Work
Our work in network service selection spans several fields of research, including mobile and wireless networks, network quality of service (QoS), intelligent agents, machine learning, and user modeling. Our research synthesizes ideas from these fields to produce a novel machine learning service selection approach.
Previous service selection researchers have developed systems that use an agent to se-lect network services for the user, but they do not attempt to learn user preferences with a simple and unobtrusive interface. In [2], the authors describe a mechanism for users to manually choose among a fixed number of priority-level/price pairs. They study the simu-lated behavior of multiple users on the load and performance of such a network. Their work assumes that users can accurately and rapidly choose the appropriate priority level as the observed network performance changes. In this thesis, services are described by features more complex than a fixed set of priority levels and prices. Furthermore, our focus is not on the efficiency of the network but on ease of use and user satisfaction.
The authors of [24] propose a user agent to select among services in a diverse network environment. They describe the framework for an agent that selects services based on user expectations and application requirements, measures the performance of the current
ser-vice, rates services, and shares this information with other agents. They do not implement this system, describe the user interface, or give detailed algorithms for selection and rating, however.
There has been previous research in wireless and mobile networks on deciding how and when to switch network service. While the 802.11 specifications [33] do not specify a pro-cedure for when handoffs should occur, a variety of common approaches are taken. These include STA initiated handoffs based upon signal strength information. Access points may also initiate handoffs based upon their load. Commercial products employing multi-mode wireless access technologies typically just prioritize the radios and employ the highest pri-ority radio at any point in time [26]. Prior research has suggested that handoff between wireless technologies ("vertical handoff") [34] and systems employing a variety of wire-less networks and technologies [19] are feasible. In [38] the authors argue the need for policy-enabled handoffs across such heterogeneous wireless networks. [36] describes a measurement based prioritization scheme for handovers in mobile cellular networks. In Cellular IP [8], handoff is partly based on clients' signal strength measurements. In Mobile IP [29] handoff decisions are based upon foreign agent advertisements. Katz has stud-ied mobility in wireless overlay networks [18, 19]. Research on seamless and transparent handoffs is similarly voluminous, [4, 9, 13, 30, 32, 37]. Software radios have a similar type of problem of determining which radio configuration to employ [10]. None of these
approaches account for user preferences, however.
In this thesis we employ several well-studied user modeling techniques. The authors of [41] give an overview of different ways to model and predict user behavior, including a discussion of content-based and collaborative learning, linear models, Markov models, neural networks, and Bayesian networks. In [39], the authors discuss the challenges of machine leaning for user modeling, including the need for large data sets, the need for la-beled data, concept drift, and computational complexity. Most of these approaches require a great deal of explicit feedback from the user, however. In order to make our system un-obtrusive and easy to use we do not explicitly ask for ratings from the user and use implicit rating instead, as described in [25]. Nichols examines methods for implicitly learning user preferences from their behavior. We also incorporate aspects of previous approaches to
measuring user perceived quality that make use of feature-based models. The authors of
[1, 31] describe several methods to make recommendations based on the features of items
users previously rated.
We make use of Al techniques to learn user preferences. The traditional approaches to modeling user utility include conjoint analysis, in which users are asked to specify their preferences over different goods [20, 21]. We reject this approach since users are unable to accurately evaluate a service based on a description of their features; they must experience it before they can determine its utility. Instead we use ideas from reinforcement learning to learn user preferences based on their behavior. Kaelbling gives an overview of the field in
[17]. Sutton and Barto provide an excellent reference for reinforcement learning in [35].
We abstractly model our service selection agent using a partially observable Markov decision process (POMDP) [7, 6]. This gives us a framework to reason about nondeter-minism and unobservability in the network and user and allows us to take advantage of the previous work in reinforcement learning with Markov models.
Chapter 3
Agent Model
The service selection problem has the property that the agent's decisions depend on the possibly changing state of the network and user. Both fully observable Markov decision processes (FOMDPs)[7] and partially observable Markov decision processes (POMDPs)[6] are commonly used to represent these problems in which an intelligent user agent must learn the values of different states and actions while making selections to maximize the reward it receives [17]. A Markov model captures the nondeterminism of user and network states and enables the agent to estimate the value of actions in these states. In this thesis we choose to use a POMDP model because it can capture the inherent inaccessibility of the complete network and user states; the agent cannot observe the entire state of the network, nor does it have access to the user's intentions and goals.
A POMDP can be described as a set of states S, a transition probability function 6
S x A x S - [0, 1], a set of agent actions A, and a set of observations Z. Below we
describe the elements of this model in detail.
3.1
States S
In the most general model, the state space would comprise all variables that influence the set of available agent actions and transition probabilities. For instance, the length of time the current service has been in use may affect when the user wants to switch services. The amount of money in the user's bank account could influence the amount they are willing
to pay. The set of available services could be correlated with the day of the week and when the user is at home or at work, and so on. Our agent model can function correctly with such a large state space, but including all these variables would quickly make the problem intractable; the greater the number of states, the longer it takes for the agent to learn. As a reasonable compromise, we choose to define a state x = (D, g, s, w) as a set of available services D, the current service in use s, the user's current activity g, and the user's quality/cost weighting w. By factoring the state space into these four components, we can keep the model to a manageable size while still allowing the agent to reason about its actions based on the available services and the user's context and goals.
We do not attempt to model services with changing quality or cost; instead we assume that network services themselves do not have state and always deliver the same level of service. This enables us to represent services much more compactly and greatly simplifies the evaluation of states.
Note that since we do not place any restrictions on the set of available services D, and since w is a real number, this state space is infinite. Furthermore, since D consists of a set of services, the state space is potentially exponential in terms of the number of unique services. We will address these issues in Section 3.5.
3.2 Observations Z
Even in this simplified state space, the agent does not have access to all the state variables. It can only observe the set of available services D, the service profile p(s) of each service
s, the user's activity g, and the user's most recent feedback r. The agent does not know the
user's quality/cost weighting w. This partial observability means that the agent must infer
w based on its observations.
The user can express three types of feedback r about the current service: satisfac-tion r = sat); dissatisfaction with quality and a request for a higher quality service (r = better); and dissatisfaction with cost and a request for a lower cost service (r = cheaper). The probabilities of each of these actions are functions of the user's utility, perceived qual-ity, and perceived cost, respectively.
Since users may mentally aggregate their perception of recently used services when deciding what feedback to give, we can model their behavior using a delayed reward model in which a r = better input may express dissatisfaction with the previously used service and not the current one [35]. Though this model is appealing, it makes it more difficult for the agent to identify the service for which the user is providing feedback. Thus we assume that their behavior depends only on the current service and context, and not previous states.
If this assumption is not appropriate, we can amend the reward model. We explain how
users express their inputs using the user interface in Section 4.1.
In a more sophisticated POMDP model, the service profiles themselves may not be ob-servable. If that were the case, the agent would have to infer service profiles based on user behavior, network traffic measurements, or other data. Similarly, in a more general model, the user's context could be more complex and unobservable. This module assumes that accurate service profiles and user context are available. Inferring the true characteristics of inaccurate service profiles is beyond the scope of this thesis.
3.3 Actions A
There are many possible models of agent actions we could employ, depending on the se-lection mechanism. If service providers allowed negotiation, for instance, then an agent action could be to make an offer stating how much it is willing to pay for a service. Al-ternatively, the agent could state the type of service it wanted and ask all providers for a bid. The agent actions also depend on how users use network services. If a user has two network interfaces, then they could select different services for each interface. In this case, the agent would have to make two selections.
Though our model can accommodate these mechanisms using additional state variables and transitions, we choose to adopt a system that closely corresponds to the current market for wireless network access in which service providers advertise all the services they offer and the agent chooses among them. This type of model has the advantage that the agent actions depend only on the set of available services and not on a negotiation process, which would require additional state variables to model the process of negotiation. In addition,
agent actions do not cause the set of available services to change, which would be the case if the agent could negotiate a service with a provider.
Let A = {bi, b2, ..
}
be the set of all agent actions, where action bi is to select servicesi. The PR may choose from any of the available services in D, hence the set of available
agent actions is {biIsi E D}.
3.4
Transitions J
In general the probability of transition between different activities may depend on the cur-rent service and the services available. For instance, if there are no high speed network services in the area, then the user is unlikely to engage in high bandwidth videoconfer-encing. In addition, changes in the set of available services are likely to be related to the geographic locations of base stations and service providers. To keep the problem tractable, however, we decide to treat changes in D, g, and w as exogenous and do not attempt to model or predict them. Furthermore, we assume that the agent always gets the service it re-quested. We let the transition probability 6(xi, b, xj) of going from state xi = (D, g, si, w) to Xj = (D, g, sj, w) on action b be 1 if b = bj selecting service sj. Otherwise it is 0. A more sophisticated model would allow the agent to reason about changing activities and available services, but we assume that in the short-term time frame in which users select services, the set of available services usually remains the same, the user is performing the same activity, and the user's goals are unchanged. If these variables change the agent can make selections based on the new state, but it does not attempt to predict these changes. These assumptions allow the agent to base its selection decisions solely on the current service and context.
Another question is when transitions occur. The agent may be able to better explore the space of available services and learn user preferences better if it switches services without external input. If service quality or cost can change with time, then the agent should be able to switch services in response to such changes. We found that in our preliminary user experiments that users do not want to worry about their service changing unexpectedly, however. In order to provide a predictable user experience, the agent only switches services
in response to user input or changing state. Therefore in our model transitions occur only when the user provides feedback or if the state changes exogenously, though the agent can still make selections stochastically to explore the space of available services.
3.5
Objective
Given this model, the task of the agent is to maximize user satisfaction as measured by the frequency of positive user feedback. Since we do not model state transitions in the set of available services or user state, the agent's objective is simply to identify and select the service that provides the greatest expected reward, where reward is 1 for a r = sat input and 0 otherwise. Like the well-known k-armed bandit problem in reinforcement learning [5], the agent must choose among a set of actions so that its expected reward is maximized. Unlike the the k-armed bandit problem, however, the agent's state may change. To deal with changes in the state of the network and user, the PR attempts to use previously learned information to help it make decisions.
As alluded to earlier, the state space is potentially infinite, requiring us to make some simplifying assumptions to keep the problem tractable. First, we assume that the utility of a service depends only on the perceived quality and cost of a service and the user's quality/cost weighting, and not on what other services are available. This causes the state space to be linear in the number of services instead of exponential. Secondly, the agent can address the problem of a real valued quality/cost weighting by treating it as a parameter in its action value function. We describe this approach in Chapter 4.
When the state changes, the agent attempts to initialize its action estimates of new ser-vices based on the observations made in previous states. If a new service is encountered, the PR can attempt to predict its value by comparing its service profile to the service profiles of previously seen services. We assume that services with similar profiles will be perceived similarly. When the user's quality/cost weighting changes, the PR can recalculate its ac-tion values according to its estimated user utility funcac-tion. If the user's activity changes, the agent could also attempt to compare the new activity to previous activities to initial-ize action values. This would require a priori knowledge about the relationships between
activities or quantitative activity descriptions, however, so we do not perform this type of prediction in our model.
As in other reinforcement learning problems, the agent faces the challenge of balancing exploration and exploitation [3]. In order to discover the service with the greatest expected reward, it must explore different services even if they may be suboptimal. Once it finds the best service, however, it should use it as much as possible to maximize its reward.
The agent model described precisely defines the service selection problem and outlines the tasks and functionality of an agent to address this problem. Even with the simplifying assumptions we make about the agent's state space, transitions, and action value estimation, the agent's task is still very difficult.
Chapter 4
Architecture
The service selection problem as described above can be broken down into four subprob-lems:
1. Devising an intuitive and effective user interface to elicit feedback useful for agent
decision-making.
2. Accurately evaluating services in terms of their user perceived characteristics to help learn the value of the agent's actions.
3. Deciding when to change services and which service to select based on the user's
preferences, context, and goals.
4. Correctly predicting the value of actions in new states based on previous observa-tions.
To address these subproblems, we built an agent consisting of four modular components corresponding to the subproblems described. These components are the user interface, a service evaluator, a service change controller, and a service value predictor. Figure 4-1 illustrates the relationship between these components. Together, these components allow the PR to learn the value of services from user feedback, adapt to changing user needs, and also estimate the value of new services. This modular architecture allows different parts of the PR to be developed independently and allows us to easily change its behavior
by selecting different implementations of these components. In this chapter we outline
the requirements and functionality of these components. In Chapter 5 we give a detailed description the implementation of these components in the PR.
s: current service Vq(g,s): quality estimate
g: user context V (g,s): cost estimate
Ac: change in cost estimate
Aq: change in quality estimate F q(g,s): quality prediction
Aw: change in quality/cost weighting F (g,s): cost prediction
Ae: change in exploration level
e: evaluator exploration level
s, g, Ac, Aq Service Profiles p(D)
Predictr F q(g,s),F,(g,s) rUser In tfae V (g, s), VF(g, s), e
e
RequestServices, g, Aw, Ae, Chag
ContrDo1 er
tAvailable Services D
Figure 4- 1: Agent Architecture
4.1 User Interface
For the user interface to be effective, the user inputs must be intuitive and unobtrusive. Users should not have to spend much time and effort thinking about how to interact with the interface. This means that the UI should not require frequent user involvement and that the inputs should be easy to understand. At a minimum, the user must be able to provide feedback about their satisfaction with the current service and to indicate whether they desire a higher quality or a lower cost service. In addition, to help guide the PR's decisions we also allow them to indicate their tolerance for trying new services.
A simple approach is to only have two inputs: satisfaction or dissatisfaction with the
current service. This has the advantage of making service evaluation easier since the PR would not need to track quality and cost separately, but fails to capture the user's dynamic
quality/cost weighting. Thus we allow the user to not only express whether or not they are satisfied with the current service, but also whether they desire a higher quality or lower cost service.
If the user is dissatisfied with a service, it is either because it has low quality or high
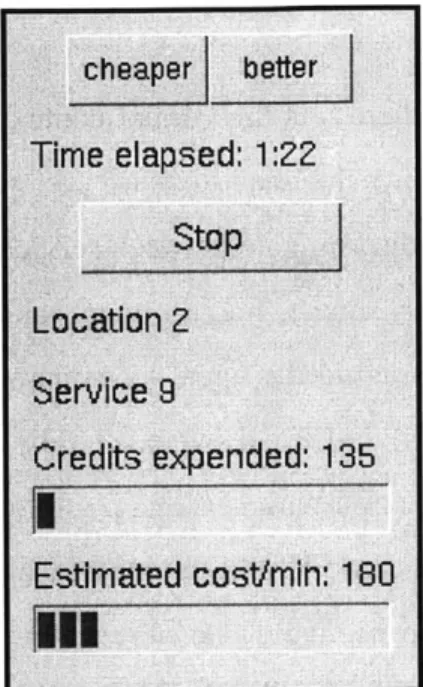
cost. Therefore the UI provides two buttons for feedback about the current service: a better button to indicate r = better, expressing dissatisfaction with the current service's qual-ity level and requesting a higher qualqual-ity service; and a cheaper button for r = cheaper, expressing dissatisfaction with the current service's cost and requesting a lower cost ser-vice. If the user is satisfied with a service, they need not do anything. Users are unwilling to constantly interact with the PR just to express their satisfaction with the current ser-vice, so instead we assume that they are implicitly expressing satisfaction with the service
(r = sat) if they do not press any buttons for some time. We assume that the longer the user waits before pressing a button, the more likely they are to be satisfied they with the quality and cost of that service.
If the user inputs r = better, it is due to one or both of the following two reasons: either the perceived quality of the service q is lower than the PR's estimate, or the user's quality/cost weighting w increased. To the extent that the button press is due to low q, the evaluator needs to update its quality estimate for the service. To the extent that w has increased, the change controller must choose higher quality services. Similar reasoning applies to r = cheaper.
The user's willingness to explore may change as well. The UT may provide a means for the user to express this change via explore more and explore less buttons, a slider, or attempt to infer it from their behavior. Therefore from an input r the UT needs to generate four outputs, Aq, Ac, Aw, and Ae, the amount to change the quality estimate, cost estimate, quality/cost weighting, and exploration level, respectively.
To help the user make their decisions, the UT also needs to give feedback to the user about the current service and available services to enable the user to quickly determine the relative quality and cost of a service. Too much feedback is detrimental; giving detailed technical information about each service is likely to distract and confuse the average user. On the other hand, without any feedback at all the user has no basis on which to compare
services and decide which one they prefer out of the choices available.
The user must be able to at least identify which service is currently in use and how much it costs. The current service may be indicated using a name, description, or other identifier. There are many possible ways to give feedback about cost, including cumulative cost, estimated cost per unit time, and estimated cost per byte.
4.2 Service Evaluator
To accurately make service selection decisions, the PR must have information about ser-vices. As mentioned earlier, evaluation based simply on a static function of network char-acteristics and price is inadequate because different users have different preferences. The agent's selections should ultimately be based on the user's subjective perception of ser-vices, so we choose to evaluate services in terms of user perceived cost and quality. This evaluator must be able to learn individual user preferences under many different contexts based on user feedback.
Under the assumptions we make about user behavior, utility is a function of the user's quality/cost weighting and the perceived quality and cost of the current service under the current activity. The task of the evaluator is to estimate this perceived quality and cost for each service and activity. For each service s and user context g experienced by the PR, the evaluator maintains quality and cost estimates VY(g, s) and V(g, s). These estimates range from 0 to 1, where 0 corresponds to the worst possible quality or cost (slow or expensive) and 1 is the best (fast or cheap). Since these estimates should be based purely on the user's perception of the service, they are calculated from the Aq and Ac UI outputs and not on
any information in the service profile. This allows the evaluator to learn user perceived quality and cost regardless of the user's quality and cost functions. Furthermore this makes the system robust to inaccurate or incomplete service profiles. Since the evaluator uses learning, its estimates improve as it receives more user feedback. We allow it to communi-cate its confidence in its estimates with an exploration value e, allowing it to request more exploration when untried services exist and less exploration when it has greater confidence in its estimates.
4.3
Change Controller
The role of the change controller is to decide when to switch services and which services to select based on information from the service evaluator and from the user interface. It is not optimal to always select the service with the greatest estimated value; if the evaluator's estimates are inaccurate or new services are available it may be better to try a different service. When to switch and the correct service to select depend on the user's context, the user's weighting between quality and cost, as well as the amount of exploration the user will tolerate.
Since user utility is a function of perceived quality and cost and a quality/cost weighting
w, the change controller must have an estimate of w and an approximate utility function to select services. The change controller estimates the quality/cost weighting based on Aw inputs and then applies its utility function to the perceived quality and cost of each available service. It then makes selections based on a stochastic function of these utilities.
The change controller may occasionally select a service with lower estimated utility in order to improve the evaluator's estimates. Some amount of exploration accelerates the learning process, but too much exploration results in suboptimal selections [3]. The PR must strike a balance between exploring and exploiting the highest utility service. The exploration level of the service evaluator and Ae from the UI affect this balance.
4.4
Service Value Predictor
Using the evaluator allows the agent to learn the value of individual service profiles, but does not help it select from services the user has not yet experienced. Using just the service evaluator, the PR can only estimate the value of a service based on the feedback it receives when it is in use. Therefore to improve performance when new services are encountered, the PR forms a model of user utility to predict the value of new services based on the Aq and Ac outputs from the UT and the current service profile. Estimating the value of services based only on a mapping from service profile features in this manner is insufficient because their perceived quality and cost may depend on features not in the service profile, however.
Thus the evaluator uses the predictor to initialize its estimates, but its estimates are updated based solely on user feedback.
The task of the predictor can be viewed as an approximation problem, where the goal is to approximate user perceived quality and cost as closely as possible given a limited number of observations about their behavior and service profiles. This assumes that there exist functions fq(g, p(s)) and fc(g, p(s)) correlated with the user perceived quality q(g, s)
and cost c(g, s) of a service s. The predictor attempts to approximate these functions fq and f, based on previous observations. Since the predictor is only used for the initial estimate, predictions need not be completely accurate. As long as its estimates allow the PR to make better than random selections, the predictor can improve performance.
The standard approaches to this type of approximation problem include linear regres-sion, single layer perceptrons, and multilayer neural networks [22, 15]. We reject linear regression and single layer perceptrons because they are incapable of learning nonlinear functions. Of the possibilities outlined, multilayer neural networks are the most general and flexible, are straightforward to train and compute, and can approximate the broadest range of utility functions. Therefore in our implementation, when it encounters new services the PR attempts to approximate the user's utility function using a two-layer feed-forward neural network.
The PR trains the predictor on the Aq and Ac UI outputs, the current service profile, and the current activity. As the neural network receives more training data, its predictions will improve. Since the neural network requires a substantial amount of training data before it becomes useful, the PR does not use it until it has accumulated enough observations. Once the predictor is activated, the evaluator can use it to initialize its quality and cost estimates for a given service and activity.
Chapter
5
Approach
We now address the challenges described above in dealing with the network and the user. We describe our implementation of the architecture described above.
5.1 User Interface
The user interface (UI) needs to translate user inputs into the control signals used by the other components. Our primary considerations for the behavior of the U1 are that it be intuitive, predictable, and easy to use while providing enough information for the other components to operate effectively. The user should receive feedback about the relative cost and quality of a service, and it should be possible to switch services with a minimal amount of button presses.
The UI must collect user feedback about the quality and cost of the current service as well as information about the user's quality/cost weighting. One way to elicit this informa-tion is to provide separate buttons for indicating satisfacinforma-tion or dissatisfacinforma-tion with quality and cost, and buttons for indicating increases or decreases in the quality/cost weighting. We believe that users would have difficulty deciding which button to press if presented with too many options, however, and so we only include two buttons in the user interface,
a better button corresponding to r = better and a cheaper button for r = cheaper. An input of r = better expresses dissatisfaction with the quality of the current service and a desire for a higher quality service. This causes the UI to generate Aq = -1 and
Aw = +0.05 signals, decreasing the quality estimate of the current service and moving
the quality/cost weighting toward quality. The magnitudes of Aq and Ac are arbitrary; the evaluator just needs to be able to distinguish between positive and negative feedback. The value of Aw was chosen empirically; we found that Aw = 0.05 allowed the agent to
account for a changing quality/cost weighting without excessively influencing its decisions. Since users expect to get a different service when they press a button, if another service is available it continues to generate these signals until the change controller selects a different service. Similarly, if the user inputs r = cheaper, the UI sets Ac = -1 and Aw = -0.05
until another service is selected. If the user does not press any buttons, the PR assumes that they are satisfied with the current service. Every 15 seconds, the UI generates a r = sat signal, setting Aq = +1 and Ac = +1 to indicate this implicit satisfaction. Fifteen seconds
allows the user enough time to initially evaluate the service and decide whether or not they are satisfied while still being short enough to sufficiently reward the agent for selecting high utility services. We choose not to implement the exploration level inputs in the present work because it is not essential to the operation of the PR. This feature could easily be added at a later time if desired.
This system requires no interaction from the user if they receive a satisfactory service, minimizes the amount of interaction needed to select a new service, and allows the evalua-tor to form estimates of the quality and cost of services. Other reward models are possible; for instance, the satisfaction signals could be generated based on whether the network has been in use to account for idle time. We do not adopt these approaches due to the complex-ity they add.
To allow the user to determine the cost of the current service, the UI also displays the estimated marginal cost of a service based on the current network usage and the cost per minute and cost per kilobyte of the service. In addition, a meter shows the user's total cumulative expenditure. These enable the user to quickly evaluate the relative cost of dif-ferent services. Other forms of feedback are possible as well, such as a list of the available services and the agent's estimates of them. We choose not to present this information to keep the interface simple.
implementation also includes a start/stop button to turn on and off the agent and a timer to track the duration of usage. In an implementation intended for regular users, the user interface would be slightly different.
Figure 5-1: User interface for experiments
5.2
Service Evaluator
The service evaluator uses reinforcement learning techniques to form quality and cost es-timates. The PR maintains a table of quality and cost for each service and user context. It updates these quality and cost estimates based on the Aq and Ac signals from the UT. These updates are done using an exponentially weighted moving average with optimistic initial estimates [35], calculated based on the most recent user feedback about a service in a given context.
For each service s and user context g that the PR observes, it maintains estimated qual-ity and cost values Vq(g, s) and V(g, s) between 0 and 1. Since we do not have delayed rewards, it is sufficient to just update the value of the current state. The estimated qual-ity and cost are calculated by averaging the previous Aq and Ac inputs according to the
exponential weighted average update rules
Vq(g, s) + a 2 + (1
-
a)V4(g, s) (5.1)Ac+ 1
V(g, s) a 2 + (1 - a)VC(g, s) (5.2)
with learning rate a = 0.1, where g is the current context and s is the currently selected
service. This learning rate allows the agent to learn preferences reasonably quickly while retaining enough precision to discriminate between services with different quality or cost.
If the PR's predictor has not yet been trained, then values of V4 and V are initialized optimistically with 0.9, encouraging the agent to try new services. Otherwise, they are initialized to the values Fq(g, s) and Fe(g, s) predicted by as described in section 5.4. As users implicitly express satisfaction with services by not pressing the better and cheaper buttons, these update rules will cause V and V to increase for services perceived as having higher quality or lower cost, respectively. Conversely, low quality and high cost services will receive lower values of V and V when users express dissatisfaction.
We do not currently implement the evaluator exploration value in our approach. By op-timistically initializing estimates, the PR already has a natural tendency to explore untried services, however.
5.3 Change Controller
Given a set of service profiles and estimates of their value, the agent needs to decide when to switch and which one to select to maximize the long-term average reward. The con-troller has two tasks: estimating service value based on quality, cost, and the quality/cost weighting; and choosing a service based on these utility estimates.
Because the services available to the agent do not depend on the current service in use, it is not necessary to consider the possible actions the agent may take in the next state. Furthermore, since we do not have delayed rewards temporal difference learning is unneeded. If these conditions were to change, then we could use other techniques to estimate action values, such as Sarsa or Q-learning [35].
The change controller estimates service value with an action value function in terms of the quality and cost estimates from the service evaluator and its estimate of the user's quality/cost weight. The quality/cost weight w is updated on user input according to the rule
w <- w + A w and constrained so that 0 < w < 1. The agent's action value function should order services as closely as possible to the user's utility function. We assume that the users prefer higher quality services to lower quality ones and cheaper services to more expensive ones. By definition, as their quality/cost weighting increases they place more weight on quality, and as it decreases they weight cost greater. In general the value function may be nonlinear and depend on the current activity, but since we do not know users' actual utility functions we choose to simply use a linear action value function v(g, s, w) as a starting point:
v(g, s, w) = wV(g, s) + (1 - w)V(g, s) + Cmitch (5.3)
where Csmitch = 0.1 if s is the currently selected service and 0 otherwise. We introduce the variable Cjmitch to account for switching costs in the system, which we will explain below.
Given these action value estimates, the change controller must then decide which ser-vice to select. Many possible selection methods exist, including c-greedy, softmax, rein-forcement comparison, and pursuit methods [35]. Previous work [12] has show that both E-greedy and softmax methods exploit high value actions well while retaining the ability to effectively learn long term state values. Other options may also yield good results, but in this thesis we choose to use a softmax selection policy because it can make selections based on the magnitude of estimates and not just their relative ordering.
The change controller selects a service stochastically based on a Gibbs softmax distri-bution of the estimated utility of the available services, where the probability of selecting a service si with value v(s) from the set of available services S is given by the expression
ev(s)/T
y (5.4)
.,,S ev(x)/T 5.4
The exploration level of the service evaluator and the user's willingness to explore affect the the temperature parameter T, changing the frequency with which the PR randomly switches
services. We set the initial temperature to r = 0.05. This distribution causes the change
controller to select services based on the relative value of available services. We chose this type of selection policy because it can effectively balance the need to explore untried
services with the desire to select the highest valued services.
In order to maintain predictability and consistency, the change controller only switches services when the set of available services changes or when the user presses a button. To account for switching costs, we add a constant Cswitch to v for the current service. This will cause the PR to only switch services when the difference in estimated utility exceeds this threshold, preventing oscillation and excessive switching. This also ensures that each time the service changes, the user will receive a service that the agent believes is significantly better than the current one. Note that in this model the switching cost is the same for all services. To model variable switching costs, the agent could set Cswitch differently for different services.
5.4
Service Value Predictor
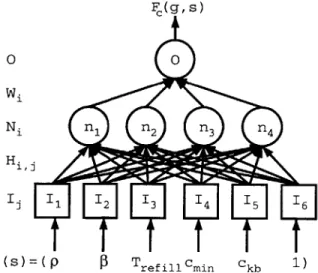
F(g, S) 00 Wi Ni ni n2 n3 n4 Hil I 1 12 13 14 15 16 P (S)= P 0 Tref illin Ck 1 )
Figure 5-2: Cost prediction neural network
The PR uses neural networks (NN) [15] to predict the value of services. The PR main-tains two separate NN for each user context g, one for quality and one for cost. Figure 5-2 depicts the cost NN; the quality NN is similar. The NN for quality has four inputs Ij, one
for each service profile quality feature (p,
f,
and Tefill) and a constant bias of 1. The NN for cost has six inputs Ij, one for each service profile feature and a bias of 1. The bias allows the NN to generate nonzero outputs when its inputs are all 0; the value of the bias does not matter as long as it is nonzero. Since total cost depends on the amount of data transferred, the NN for cost must take the quality features into account as well.Both NN have four hidden neurons ni with input weights Hij; and an output o with weights Wi. It is not known how to accurately determine the optimal number of hidden neurons to use in a NN, so we tried several different choices ranging from two to ten neurons. The fewer the number of neurons, the faster it can learn. A greater number of neurons enables the NN to approximate more complex quality and cost functions, however. We decided to use four neurons in the hidden layer because we find that it can accurately and rapidly learn many common utility functions.
The activation function a(.) applied to the output of each neuron is the sigmoid function
a(x) = _ , where x is a neuron's output value. This commonly used activation function allows the predictor to finely discriminate between services within certain feature ranges. The outputs Ni of the hidden layer and the final output 0 are Ni = a (Ej HijIj) and
O = a (Ei WiNi).
The predicted quality and cost values of a service Fq(g, s) and Fe(g, s) are obtained by setting the inputs I of the respective NN to the appropriate service profile features along with a bias of 1. The outputs 0 of the NN are then calculated using the learned weights. The NN is updated every time the PR receives a reward. For quality, the PR first computes the error Eq = Vq(gt, st) - Fq(gt, st) and then attempts to set the weights H and W to
reduce this error according to a gradient descent rule:
Wi- Wi + a Eg'(x)Ni (5.5)
Hij Hij + aEg'(x)IW, (5.6)
where a'(x) is the derivative of the sigmoid function. We choose to use learning rate a =
0.7 because it enables the NN to learn fairly rapidly It follows a similar process to update
the PR does not use the NN for prediction until it has received at least 40 inputs. Based on our simulation and experimental results, this provides enough data to do substantially better than random selection.
Chapter 6
Results
We implemented a software prototype of the PR and conducted exploratory user ments to determine how well our system performs with real users. We describe our experi-ment design, results, and conclusions below.
6.1 User Experiments
The experiments have two objectives. The first is to determine if the PR performs its func-tion correctly, learning user preferences and selecting appropriate network services when services stay the same and when they change. We evaluate this objective by comparing the PR's estimates and predictions with the actual network features. Secondly, we assess the usefulness of automatic service selection by giving users a specific task and measuring the performance of PR users against users selecting services manually.
6.1.1
Network
The network environment in our experiment is chosen to evaluate the performance of the PR when many different services are available. We also test the ability of the PR to predict the value of new services by changing the set of available services during the experiment.
The set of available services are generated using traffic shaping in a software router. In these experiments we choose to use only three features from the service profile described