Publisher’s version / Version de l'éditeur: Applied Energy, 108, pp. 100-107, 2013-04-02
READ THESE TERMS AND CONDITIONS CAREFULLY BEFORE USING THIS WEBSITE.
https://nrc-publications.canada.ca/eng/copyright
Vous avez des questions? Nous pouvons vous aider. Pour communiquer directement avec un auteur, consultez la première page de la revue dans laquelle son article a été publié afin de trouver ses coordonnées. Si vous n’arrivez pas à les repérer, communiquez avec nous à [email protected].
Questions? Contact the NRC Publications Archive team at
[email protected]. If you wish to email the authors directly, please see the first page of the publication for their contact information.
NRC Publications Archive
Archives des publications du CNRC
This publication could be one of several versions: author’s original, accepted manuscript or the publisher’s version. / La version de cette publication peut être l’une des suivantes : la version prépublication de l’auteur, la version acceptée du manuscrit ou la version de l’éditeur.
For the publisher’s version, please access the DOI link below./ Pour consulter la version de l’éditeur, utilisez le lien DOI ci-dessous.
https://doi.org/10.1016/j.apenergy.2013.02.051
Access and use of this website and the material on it are subject to the Terms and Conditions set forth at Screening microalgae strains for their productivity in methane following anaerobic digestion
Frigon, Jean-Claude; Matteau-Lebrun, Frédérique; Hamani Abdou, Rekia; McGinn, Patrick J.; O'Leary, Stephen J. B.; Guiot, Serge R.
https://publications-cnrc.canada.ca/fra/droits
L’accès à ce site Web et l’utilisation de son contenu sont assujettis aux conditions présentées dans le site LISEZ CES CONDITIONS ATTENTIVEMENT AVANT D’UTILISER CE SITE WEB.
NRC Publications Record / Notice d'Archives des publications de CNRC:
https://nrc-publications.canada.ca/eng/view/object/?id=1f20d484-b155-4fc2-bc2a-2d2cd5e16a54 https://publications-cnrc.canada.ca/fra/voir/objet/?id=1f20d484-b155-4fc2-bc2a-2d2cd5e16a54
Elsevier Editorial System(tm) for Applied Energy
Manuscript Draft
Manuscript Number: APEN-D-12-01685R2
Title: Screening microalgae strains for their productivity in methane following anaerobic digestion
Article Type: Original Paper
Keywords: anaerobic digestion; methane; microalgae; biofuel; bioenergy; Scenedesmus
Corresponding Author: Dr. Serge R Guiot, Ph.D.
Corresponding Author's Institution: National Research Council Canada First Author: Jean-Claude Frigon, M.Sc.
Order of Authors: Jean-Claude Frigon, M.Sc.; Frédérique Matteau-Lebrun, B.Sc.; Rekia Ganda Bachir, M. Sc.; Patrick J McGinn, Ph.D.; Stephen J O'Leary, Ph.D.; Serge R Guiot, Ph.D.
Abstract: Interest in the use of microalgae for the production of
biofuels has grown in recent years. Biomethane is a biofuel that can be obtained with high efficiency from anaerobic digestion of various organic feedstocks. In this study, a selection of freshwater (n=15) and marine (n=5) microalgae were tested in order to identify a microalgal strain that could be used as a model for large scale production of methane. Analysis of pH, volatile suspended solids and ammonium at the end of the assay ranged between 6.98- 7.66, 16.0- 25.9 g/L and 495- 1622 mg/L
respectively. No significant differences in these values were detected between freshwater and marine strains. There was no significant
difference in the methane yield from freshwater microalgae (329 ± 43 mLCH4/gTVS) and marine microalgae (298 ± 83 mLCH4/gTVS) although it varied greatly within the tested strains. A statistical analysis of the microalgae grown under two different culture media showed that the type of medium was more determinant than the type of microalgae (freshwater or marine) for the methane yield, with 310 ± 35, 365 ± 25 and 303 ± 77
mLCH4/gTVS for the freshwater microalgae grown in Bold's-3NV, f/2 and marine microalgae grown in f/2 media, respectively. The strains
Scenedesmus sp.-AMDD, Isochrysis sp. and Scenedesmus dimorphus displayed the best methane yield with 410 ± 6, 408 ± 4 and 397 ± 10 mLCH4/gVS, respectively. The strain Scenedesmus sp.-AMDD was chosen as a model strain for future work development with continuously fed digesters.
February 13th, 2013
Dear Editor,
Please find enclosed a revised version #2 of the manuscript entitled "Screening
microalgae strains for their productivity in methane following anaerobic digestion", that we wish to submit to Applied Energy. Each comment from the first revision was
answered in a note written in blue, while modifications in the manuscript were written in red (manuscript marked). We also added a clear version of the revised manuscript. We like to thank again your reviewers for their efforts in such extensive and meticulous revision which certainly helped at improving the article. We hope that we were able to answer the reviewer concerns at his satisfaction.
Sincerely,
Serge R. Guiot, Ph.D
Group Leader, Bioengineering __________
Energy, Mining and Environment National Research Council Canada
6100 Royalmount, Montreal, Quebec, H4P 2R2 Tel (514) 496-6369 | Fax (514) 496-6265 [email protected]
Reviewers' comments:
There are still a few errors to be corrected before final acceptance.
The comments from the reviewer were all taken into considerations and modifications of the manuscript was made accordingly.
Reviewer #1:
1. Abstract line 29 please give range for quoted values of specific methane yield
The range was added in the abstract as requested.
2. Line 39 The statement that micro-algae offer higher areal biomass productivity is contentious as this has yet to be demonstrated on a year-round basis at large scale. It should be qualified in some way, e.g. by adding the word 'potentially' here or in the preceding line.
We agree with the reviewer that higher areal biomass productivity is still not fully demonstrated and we added "potential" before "advantages" as requested (line 35).
3. Lines 77-83 Phaeodactylum tricornutum was not fully degraded under the
conditions applied, but this does not mean that the only possible approach is to look for a strain which degrades better. The points in this section are not well expressed.
The authors did not intend to assert that the only approach to partial degradation of an algal strain is to look for a strain that can be better hydrolyzed. However, we believe that looking for a strain that can be degraded and converted into methane at a higher rate is certainly a valid approach. The purpose behind finding a better strain was clarified in the text (optimize biofuel production per kg of initial biomass).
4. Lines 128-9 The samples were received and tested over a 2-year period. Was any positive control used in the BMP test procedure to ensure that the results are
comparable? This may be specified in the test protocol, but should be stated here as the reference given is not readily available.
There is no positive control per se for a BMP test. The protocol specifies that an inoculum containing active anaerobic biomass should be used for the digestion of the tested substrate. In our case, granulated sludge was periodically collected at a full-scale anaerobic digester to start the different series of incubation. This digester is operating with great stability for the past 20 years on the same substrate. While it is not possible to know the exact composition of the inoculum (it is a consortium of several hundreds of bacterial species), this inoculum was also used in our laboratory for other purposes and its fermentative and methanogenic activities were measured and maintained over time. A line was added in the manuscript to add this information (lines 138-140). Detailed Response to Reviewers
5. Line 155 The method used for gas collection means that the headspace is pressurized and it is likely that some carbon dioxide remained dissolved in the digestate liquor. As the methane yield only is reported this should not greatly affect the results, but it should be noted that this can affect the conditions of the test itself.
Thank you for the comment. Indeed, there is an equilibrium between dissolved CO2 and
gaseous CO2. Our modified BMP test is performed in bottles with large headspace
(over 400 mL) and we collect the biogas production regularly to minimize the pressurization of the biogas in the headspace.
6. Lines 191 - 194 This covers the same points as lines 198-200 but is incorrect and looks as if it may have been left in from an earlier revision.
The reviewer is correct and the lines were removed from the manuscript.
7. Line 202 Results are reported in terms of VSS, but no method is given in the section on analytical methods. Is the use of VSS = volatile suspended solids correct, or should this be e.g. total volatile solids as in the methods section? VSS is also used in the introduction (line 73) before it has been defined.
The analysis performed at the end of the incubation for each test bottles included VSS (volatile suspended solids). The methodology number was added in section 2.3. Also, VSS was defined in the introduction.
8. Lines 216-229 The statement made in lines 221-224 cannot be supported by the experimental methodology used, for the reasons given by the authors themselves in lines 224-226. If the average concentration of ammonium at the end of the assay was 883 mg/l and the quantity of micro-algae added was 1 g VS in 100 ml, it would be just as reasonable to argue that the ammonium released into the medium represents 8.8% of the total algal VS. This in turn may represent quite a high degree of protein hydrolysis, based on typical literature values for the nitrogen content of algal biomass. Without knowing the nitrogen content of the samples tested it is difficult to say either way. The authors also do not tell us the ammonium content of the inoculum-only control sample at the end of the test, which would provide a useful comparison - although it could be argued that more ammonium might be released by the inoculum-only controls if unfed inoculum biomass has died and cell lysis has occurred. It is generally quite difficult to deduce anything from the nutrient concentration at the end of a batch test of this type especially where the amount of inoculum VS added is greater than that of the sample, as in the present case. The authors either need to make a much stronger quantitative case to support their statement, e.g. based on mass balance and comparison, or to delete the sentence in lines 221-224 and re-write the rest of the section.
The reviewer is correct about conflicting statements of lines 221-224 and 224-226. Most of the revised manuscript section was added during the first revision of the manuscript. The ammonium concentration were measured mostly to insure that no
inhibitive concentrations were found at the end of the assays and a discussion more focused to that point is provided in revision #2. The average concentration of ammonium measured at the end of the assays for the controls was added in the manuscript (lines 216-224).
9. To avoid confusion over units when considering the breakdown of organic nitrogen-containing materials, ammonium is often reported in terms of its nitrogen content. Can the authors clarify whether the ammonium concentrations quoted are in mg NH4/l or mg N/l? This applies throughout the paper including tables
The authors expressed their results in mg NH4/L, and this was specified in the
methodology section (lines 175-176).
10. Line 314 The methane production from three Chlorella strains ranged from 263 to 302 mL CH4/gVS. The highest methane production from Chlorella appears to be 361 mL CH4/gVS, with 309 and 331 CH4/gVS from Chlorella sp. -RB1a and Chlorella sorokiniana. If there is a reason for selecting the other values and omitting these, this should be made clear here.
The authors were simply suggesting an hypothesis for the low methane production values for some of the Chlorella strains tested. The sentence was modified in the manuscript to better reflect the author's intention (lines 307-310).
11. Line 342 - 348 In statistical terms, the comparison is not meaningful due to the low number of replicates: the tests used are unsuitable for triplicate results with such wide variability. Equally importantly, the difference between the mean values for the two samples is 28 ml CH4/gVS. This difference in methane yields is large enough in itself to be of commercial significance; the average values for three other species
(Porphyridium aeruginosa, Micractinium and Chlorella vulgaris) lie between those for the two B. braunii samples. This is not a criticism of the results themselves: carrying out replicated comparative tests of this type is difficult and very demanding in terms both of materials and of equipment, and in general the agreement between triplicates is good - it is unfortunate that the first B. braunii sample has a slightly higher relative standard deviation than most of the others. But unless the authors are implying that the difference between 342 and 370 mL CH4/gVS is itself of no importance, the data here only confirm that yields may vary for a number of reasons. They cannot be used to support the argument that the methane yields are similar in similar conditions, and this section should therefore be modified or deleted.
The authors thank the reviewer for the comment and his acknowledgment of the work carried in this study and inherent variability of the test. As this study is a preliminary screening at a modest scale, the authors are not convinced that commercial argument can be made at this point. In the case of B. braunii, the 28 ml CH4/gTVS did not result in a statistical significant difference in the methane production between the 2 set of triplicates. At this point of the investigation, the authors do not think that too much
focus should be put on the difference between 342 and 370 mL CH4/gTVS, as the final objective is to identify the most promising algae strain and clearly B. braunii does not meet that objective, either at 342 or 370 mL CH4/gTVS, If the statistical analysis is discarded due to the low number of replicates, it is believed that the difference in methane production between the two sets of samples should not be considered
significant either. The manuscript was modified to remove the statistical aspect of the discussion as requested by the reviewer (lines 335-340).
12. Line 367 - 371 This seems to conflict with the newly added lines 363-365 - has something been inadvertently left in the revised text?
The reviewer is correct and the lines were removed from the manuscript.
13. Lines 423 - 437 This section needs to be moved to the end of section 3 Results and discussion, as it is not a conclusion from anything that has been presented in the paper so far.
The reviewer is correct and the lines were moved to a new section 3.5 of the manuscript (lines 391-406).
14. Table 2 and 3 Names of microalgal species are inconsistent and in some cases misspelled e.g. Porphyridium aerugineum /Phorphyridium aeruginosa, Thalassiosira weisfloggi/ Thalassiosira weissflogi)
The authors thank the reviewer for spotting these accidental misprints. The names of the microalgal species were corrected in the Table.
15. The text is full of small grammatical errors and turns of phrase that could easily be corrected by a native English speaker.
The text was revised as requested and the authors hope that it is now in an acceptable form.
Dr. Nicolas Bernet
Laboratoire de Biotechnologie de l'Environnement - INRA Narbonne, France
Dr. Sonia Heaven
School of Civil Engineering and the Environment, University of Southampton, UK
Professor Roger Ruan
Department of Bioproducts and Biosystems Engineering University of Minnesota, USA
Screening microalgae strains for their productivity in methane following anaerobic digestion
Highlights
There were no significant differences in the methane potential from freshwater or marine microalgae.
Freshwater microalgae showed higher methane production when cultured in f/2 medium compared to Bold's 3N.
Methane production of up to 408 mL CH4/gVS could be achieved when
anaerobically digesting microalgae.
The strain Scenedesmus sp. AMDD was chosen as a model strain for future work. highlights.docx
Screening microalgae strains for their productivity in methane following anaerobic 1
digestion 2
3
Jean-Claude Frigona, Frédérique Matteau-Lebruna, Rekia Ganda Bachira, Patrick J. 4
McGinnb, Stephen J.B. O’Learyb, and Serge R. Guiota,* 5
a
Energy, Mining and Environment, National Research Council Canada. 6100 Royalmount, Montreal,
6
Canada, H4P 2R2
7
b
Aquatic and Crop Resources Development, National Research Council of Canada. 1411 Oxford St,
8
Halifax, Canada, B3H 3Z1
9
*
corresponding author; Tel: 514-496-6181; Fax: 514-496-6265; e-mail address:
10 [email protected] 11 12
ABSTRACT
13 14Interest in the use of microalgae for the production of biofuels has grown in recent years. Biomethane is a
15
biofuel that can be obtained with high efficiency from anaerobic digestion of various organic feedstocks. In
16
this study, a selection of freshwater (n=15) and marine (n=5) microalgae were tested in order to identify a
17
microalgal strain that could be used as a model for large scale production of methane. Analysis of pH,
18
volatile suspended solids and ammonium at the end of the assay ranged between 6.98- 7.66, 16.0- 25.9 g/L
19
and 495- 1622 mg/L respectively. No significant differences in these values were detected between
20
freshwater and marine strains. There was no significant difference in the methane yield from freshwater
21
microalgae (329 ± 43 mLCH4/gTVS) and marine microalgae (298 ± 83 mLCH4/gTVS) although it varied
22
greatly within the tested strains. A statistical analysis of the microalgae grown under two different culture
23
media showed that the type of medium was more determinant than the type of microalgae (freshwater or
24
marine) for the methane yield, with 310 ± 35, 365 ± 25 and 303 ± 77 mLCH4/gTVS for the freshwater
25
microalgae grown in Bold's-3NV, f/2 and marine microalgae grown in f/2 media, respectively. The strains
26
Scenedesmus sp.-AMDD, Isochrysis sp. and Scenedesmus dimorphus displayed the best methane yield with
27
410 ± 6, 408 ± 4 and 397 ± 10 mLCH4/gVS, respectively. The strain Scenedesmus sp.-AMDD was chosen 28
as a model strain for future work development with continuously fed digesters.
29 30
KEYWORDS
31anaerobic digestion; methane; microalgae; biofuel; bioenergy; Scenedesmus 32
33
*Manuscript - MARKED
1.
INTRODUCTION
34
There is a growing interest in the use of microalgae for the production of biofuels in 35
recent years [1], as algal biomass offers several potential advantages compared with other 36
feedstocks, including higher areal biomass productivity, high lipid content and higher 37
value products [2]. Although past efforts were mainly engaged in the development and 38
processing of microalgae strains for the production of biodiesel [3, 4], conversion of algal 39
biomass into biomethane is drawing increasing attention [5, 6]. The use of the whole 40
microalgae for methane production as a biofuel has been suggested and verified in a life 41
cycle analysis (LCA) [7], which showed that methane compares favourably with other 42
biofuel production scenario. Although it is not yet clear what the most effective process 43
for biofuel production from microalgae is, anaerobic digestion and methane production is 44
certainly the least complex one [5]. Some authors are more assertive, and suggest that the 45
production of methane via anaerobic digestion (AD) is the most feasible and cost-46
effective route to an energy product [8]. This is supported by Harun et al [9] who 47
demonstrated that more energy could be generated from the production of methane from 48
microalgae (14.04 MJ/kg), rather than biodiesel (6.6 MJ/kg) or ethanol (1.79 MJ/kg) 49
where their unit "kg" is assumed to be "kg of dry weight algae". Furthermore, up to 65% 50
of the chemical energy stored in the algal biomass can be potentially recovered through 51
AD to methane [10]. 52
53
Anaerobic digestion is already successfully applied to the conversion of a wide variety of 54
organic substrates to methane, such as the organic fraction of municipal solid wastes [11], 55
waste activated sludge [12], and energy crops [13]. Recent studies are increasing our 56
knowledge about anaerobic digestion of microalgae. Theoretical calculations [14] as well 57
as bottle and digester experiments [15] have shown the great potential of anaerobically 58
digesting microalgae for methane production which can be further converted into a clean 59
and renewable biofuel. 60
61
Microalgae macromolecular distribution and cell walls renders anaerobic digestion 62
efficiency strain –specific [5]. This was emphasized by Mussgnug et al. [15] who 63
from their phylogenetic classification. Biomethane potential assays were performed on 65
microalgal biomass, and showed a wide spectrum of methane yields. For example, 66
Zamalloa et al. [16] showed 0.36 and 0.24 L CH4 g−1 volatile solids (VS) for
67
Phaeodactylum tricornutum and Scenedesmus obliquus, respectively. A conversion 68
efficiency of 51% was obtained from P. tricornutum in a continuous digestion in a hybrid 69
flow-through reactor. A similar performance was observed during the digestion of 70
Chlorella vulgaris in a 1L digester at 24d HRT, where 51% inlet COD degradation for 71
240 mL CH4/g volatile suspended solid (VSS) added was obtained [17]. Fed-batch
72
assays confirmed that the limiting step for algae digestion was the hydrolysis. Recent 73
studies performed in an anaerobic membrane bioreactor with P. tricornutum have 74
confirmed that around 50% of the tested microalgal biomass was not degraded into 75
methane [18], thus emphasizing the interest in identifying a potential strain more easily 76
hydrolyzed thus yielding more methane per kg VS, i.e. a higher biofuel production per kg
77
of initial substrate. Alternatively, high lipid content would theoretically improve the 78
methane potential of whole microalgae. However, the cultivation parameters involved 79
(high light intensity, nutrient starvation for example) which would increase the 80
accumulation of lipid in the cells, would come at the expense of microalgae biomass 81
productivity. It is not clear if this particular cultivation mode would result in a higher
82
methane yield and an optimal scenario for microalgae biomass and lipid productivity has 83
still to be determined. 84
85
Fermentation of marine microalgae could be inhibited because of high levels of sodium 86
[14]. However, it seems that marine algae are more prone to disintegration when mixed 87
with anaerobic fermenter sludge [15] resulting in the release of more intracellular 88
material which could theoretically enhance methane production. It is not clear which 89
species of freshwater or marine microalgae would be best suited for optimal methane 90
production. 91
92
Although there have been recent developments in the field of biomethane production 93
from microalgae, there is still a need to screen multiple strains to identify one that could 94
combine as many of the desired traits as possible: ease of cultivation, high biomass 95
yields, high protein and/or lipid content and ease of anaerobic biodegradation. The 96
purpose of this study was thus to evaluate the methane potential from a selection of 97
freshwater and marine microalgae grown on two culture media. The final objective was 98
to identify a microalgal strain that could be used as a model for future work and upscaled 99
experiments for biomethane production. 100
101
2.
MATERIALS AND METHODS
102 103
2.1 Growth and culture conditions
104
The freshwater strains Neochloris oleoabundans, Chlorella vulgaris, Scenedesmus 105
dimorphus, Porphyridium aerugineum and Botrycoccus braunii were obtained from the 106
University of Texas Culture Collection (strain ids 1185, 265, 1237, 2618 and 572, 107
respectively). The other freshwater strains used in this study but not obtained from the 108
UTEX collection were isolated from the Canadian province of Saskatchewan as 109
described in Park et al. [8]. Some of these strains including Scenedesmus sp.-AMDD, 110
Scenedesmus PN2, Chlamydomonas debaryana-AMB1, Chlamydomonas sp.-111
AMLS1b, Chlorella sorokiniana, Chlorella sp. Island-R, Chlorella vulgaris and 112
Micractinium sp.-RB1b were isolated from soil samples. All of these isolates were 113
photoautotrophically cultivated in Bold's-3NV (B3NV) medium as shown in Table 1 [8]. 114
The marine strains Phaeodactylum tircornutum, Nannochloropsis gaditana, 115
Thalassiosira weisflogii, Glossomastix chrysoplasta and Isochyrsis spp. (strain ids 1327, 116
525, 1336, 1537, and 462, respectively) were obtained from the National Centre for 117
Marine Algae and Microbiota (formerly the Provasoli-Guillard Culture Collection of 118
Marine Protozoa), East Boothby, Maine. All marine strains were cultivated in Pasteurized 119
seawater in f/2 media [19] as detailed in Table 1. Table 2 shows the different strains 120
tested for their methane potential along with the specific medium in which they were 121
cultivated and their total solids (TS) content after harvesting by centrifugation and total 122
volatile solids (VS) after combustion. The microalgal biomass was collected by 123
centrifugation (CEPA Z101 process centrifuge; 15,000 x g) at a processing rate of 20 124
L/min for a typical duration of 30 minutes. Table 2 also lists the strains as either 125
127
2.2 Preparation of the methane potential assays
128
Biomass samples of the microalgae strains listed in Table 2 were received and tested 129
between September 2009 and November 2011. The methane potential assays were 130
prepared based on the Biochemical Methane Potential (BMP) assay for wastewater [20]. 131
A few modifications were made to adapt the test to high solid samples [21]. The assays 132
were performed using an inoculum to microalgae ratio of 2:1, based on the VS 133
concentration, to ensure better kinetic constants [22]. The inoculum consisted of 20 g of 134
granular biomass (wet weight) collected from a full scale upflow anaerobic sludge 135
blanket (UASB) digester treating apple processing wastewater (Lassonde Inc., 136
Rougemont, QC, Canada; 45°25’52.71” N, 73°03’12.15” W), with a moisture content of 137
90%. The inoculum was starved for 48 hours prior to the start-up of the assays, by 138
incubation at 35°C and at agitation at 150 rpm with no substrate. Altough the assays were
139
performed at different times over the two year period of this study, the methanogenic
140
activity of the inoculum was maintained over time.
141 142
Triplicate bottles (500 mL) were prepared anaerobically under a constant flow of a gas 143
mix (80% N2, 20% CO2) for each experimental digestion. Before sealing, the pH was
144
adjusted to 7.0, if necessary, when the bottles were ready. A typical bottle contained one 145
gVS of the tested microalgae, 2 gVS of inoculum, two mL of defined media, two ml of 146
bicarbonate buffer and 0.5 ml of 1.25% Na2S-cysteine solution. The recipes for the
147
different solutions and the procedure for their preparation are detailed elsewhere [21]. 148
The final volume was adjusted to 100 mL for all bottles using boiled demineralized 149
water. The bottles were incubated at 35°C with an agitation of 150 rpm. Control bottles 150
were prepared to correct for endogenous methane production from the assays. The 151
control bottles were identical to the test bottles, excepted that the microalgal suspension 152
was replaced with the same volume of deoxygenated water. The assays were conducted 153
until the methane production became negligible (< 3 ml d-1) which typically occurred 154
between 34 and 50 days of incubation. 155
156
2.3 Analytical methods
The biogas production was released from the bottles at regular interval, generally four 158
times in the first week of incubation, and twice weekly afterward, using a water-159
displacement system built from a volumetric glass burette, graduated every 0.2 ml. The 160
bottles were allowed to equilibrate by displacing water from the burette to a connected 161
Erlenmeyer flask, which required around 20 seconds to perform. A gas sample (0.3 ml) 162
was then taken from the headspace of the bottles using a model 1750 gas-tight syringe 163
(Hamilton, Reno, USA) and analyzed for H2, N2, CH4 and CO2 by gas chromatography
164
(GC) as described in Frigon et al [21]. All gas or methane volumes presented in this study 165
are described at standard temperature and pressure, of 273.15 K and 100 kPa pressure. 166
167
A few parameters were monitored on the algae paste and at the end of the incubation for 168
each set of assays, including total solids (TS), total volatile solids (VS), volatile
169
suspended solids (VSS), pH, soluble chemical oxygen demand (sCOD), ammonium
170
(NH4) and volatile fatty acids (VFA), namely acetate, propionate and butyrate. The pH
171
was measured on an Accumet AP61 portable pH meter equipped with a micro probe 172
(Fisher, Fairlawn, USA) directly on the recovered sample, within one minute of 173
sampling. The TS, VS, VSS and sCOD concentration were determined according to 174
Standard Methods [23] using methods 2540B, 2540D, 2540E and 5220D, respectively. 175
The ammonium and VFA were analyzed by GC [21]. The ammonium concentration was
176
expressed as mg NH4/L throughout the manuscript.
177 178
2.4 Statistical analysis
179
As a first step, the homogeneity of variance was tested using Levene's F-test [24]. This 180
test provides a significance value (P-value). If P is greater than the significance level of 181
0.05 (alpha), the group variances can be treated as equal. Otherwise (P < 0.05), we have 182
unequal variances. Then a Student's t-test was performed to determine whether there was 183
a statistically significant difference between the means in the two groups when variances 184
were equal. Otherwise, a Welch's t-test was used [25]. In both t-tests, the means from the 185
two unrelated groups were considered as not significantly different (null hypothesis) 186
when the P-value was greater than the significance level of 0.05 (alpha). All statistical 187
tests were performed using Microsoft Excel (Microsoft Corporation, Redmond, 188
Washington). 189
190
3.
RESULTS AND DISCUSSION
191 192
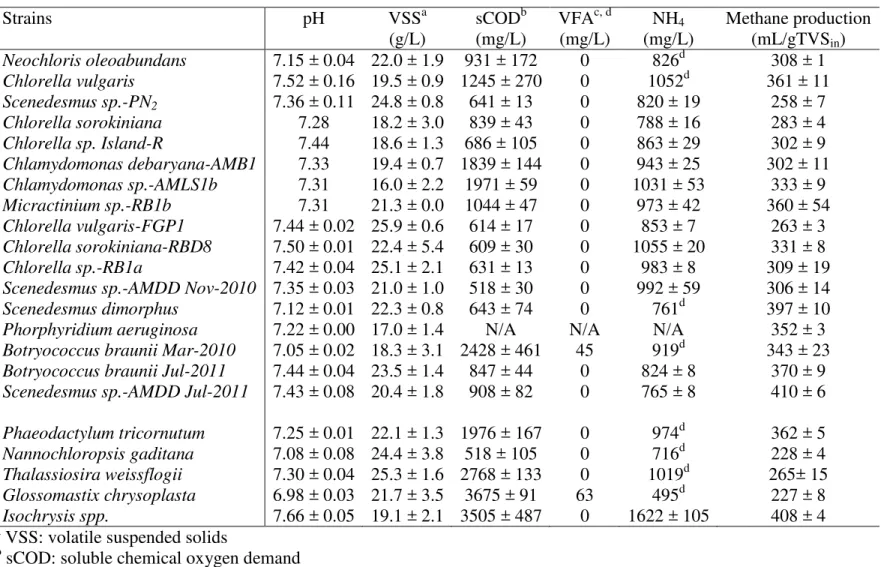
3.1 Results for the physico-chemical parameters for all methane potential assays 193
Methane potential assays were performed in triplicate for 15 freshwater and 5 marine 194
microalgae strains. Table 3 presents the results obtained at the end of the incubation 195
period for all tested strains. The pH was measured at the end of each assay and varied 196
between 6.98 ± 0.03 and 7.66 ± 0.05. In parallel to a neutral pH, there was no VFA 197
accumulation at the end of the incubation period for almost all of the assays reported. The 198
VFA concentration was low for the two strains with reported VFA, B. braunii Mar-2010 199
and G. chrysoplasta. The neutral pH and the absence of VFA accumulation are thus 200
indications that no irreversible inhibition occurred and conditions were satisfactory by the 201
end of the test. 202
203
Table 3 presents results for the volatile suspended solids (VSS), sCOD and VFA 204
concentration obtained at the end of the methane potential assays. Although it can be 205
presumed that a high level of microalgae degradation in the assays would result in lower 206
VSS concentration at the end of the incubation, there were no strong correlation between 207
the final VSS concentrations in the assays and the methane production for either the 208
freshwater (coefficient of correlation (R = 0.322) and marine (R = 0.535) microalgae. 209
This could be related to the high amount of inoculum which contributed to 2/3 of the 210
initial VSS content in the bottles. The final soluble COD concentration can give an 211
indication of the amount of substrate hydrolyzed but recalcitrant to further mineralization 212
toVFA and then methane and CO2. The sCOD concentration were low in general for the
213
freshwater strains but rather high for the marine strains. It can be presumed that the high 214
sCOD concentration represented recalcitrant or non biodegradable material. 215
216
The average final ammonium (NH4) concentration was 351 ± 16 mg/L in the control
217
bottles containing only inoculum. Not including Isochrysis sp., an average final 218
ammonium concentrations of 883 ± 140 mg/L was observed for all tested strains. The 219
final ammonium concentration in digestions containing Isochyrsis sp. was 1622 ± 105 220
mg/L, which was considered an outlier. These concentrations were well below those 221
considered inhibitory [26]. These values are further indications of the proper conditions
222
in the assays, and shows that the digestion of the microalgae at low initial VSS 223
concentration would greatly reduces the potential of ammonia for feedback inhibition on 224
methanogenesis as reported by Heaven et al. [27].
225 226
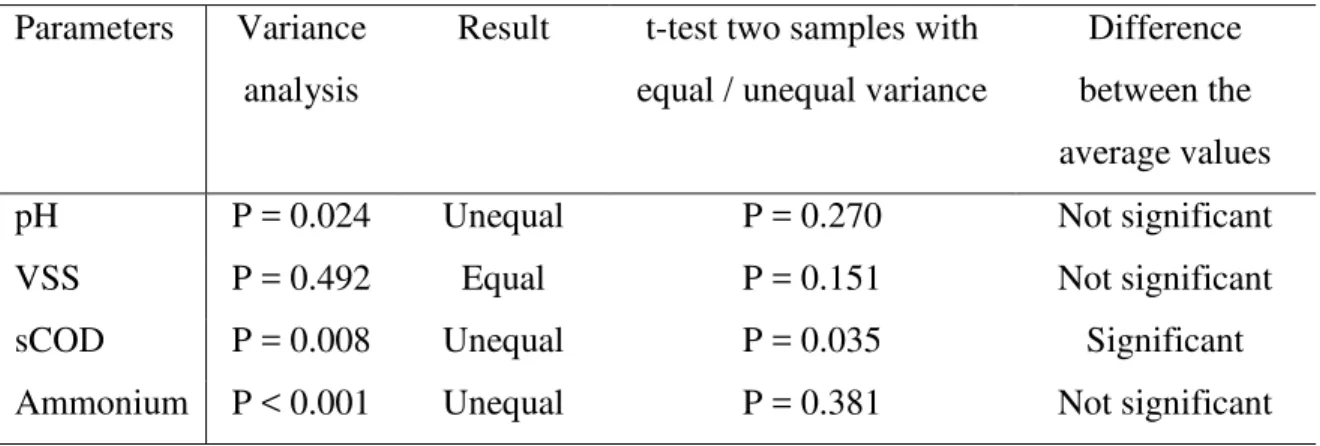
The variances of the average pH, VSS, sCOD and ammonium concentrations for the 227
freshwater and marine microalgae were compared, followed with a t-test, in order to 228
determine whether the means of the physico-chemical parameters were significantly 229
different for the two groups of microalgae (Table 4). The resulting P values were 0.270, 230
0.151, 0.035 and 0.381 for pH, VSS, sCOD and ammonium, respectively. Therefore, 231
there were no significant differences between the final pH, VSS and ammonium 232
concentration between the freshwater and marine microalgae at the end of the digestion 233
assays. However, the sCOD concentration were significantly higher in the case of the 234
marine microalgae, except for N. gaditana. 235
236
3.2 Overview of the methane production for all assays 237
The methane production for all tested strainsvaried between 227 -410 mL CH4/gTVS.
238
Representative time-courses showing the kinetics of methane accumulation from 239
digestion of five microalgae strains over time are shown in Figure 1. The onset of 240
methane production appeared to take place without delay in the assays, probably due to 241
the fast initial transformation of soluble biodegradable matter. Initial methane production 242
(day 0 – 3) was significantly different for the tested strains and reached 19, 23.5, 23.3, 243
23.8 and 37.5 mL CH4/gVSSinoculum.d for C. sorokiniana, Chlorella sp. Island-R, C.
244
debaryana-AMB1, C. sp.-AMLS1b and Micractinium sp., respectively. While 245
Micractinium sp. displayed the highest initial methane production for all tested strains, 246
Thalassiosira weisflogii showed the lowest methane production at 8.3 mL 247
CH4/gVSSinoculum.d. This could be due to the presence of the silica frustules which might
have impeded digestibility. Micractinium sp., which showed the highest initial methane 249
production, also yielded more methane than the other strains from Figure 1. 250
251
A decrease in the methane production kinetic was observed after the first four days in 252
almost all of the anaerobic digestion assays performed in this study, and persisted until 253
days 14 to 17 of incubation. This latency could be related to high lipid content and partial 254
inhibition from long chain fatty acids (LCFA) [28]. However, the inflection in the 255
methane production kinetic could be caused more simply by a physical barrier such as 256
potentially recalcitrant algal cells impeding hydrolysis and preventing the release of 257
soluble biodegradable compounds. There was no such inflection in the methane 258
production for Micractinium sp. (Figure 1), as well as in Scenedesmus dimorphus, 259
Isochrysis sp., Glossomastix chrysoplasta and SK-RB1a (data not shown). Isochrysis sp 260
and Scenedesmus dimorphus had the 2nd and 3rd highest final methane yields out of 20 261
strains tested. 262
263
It is possible to estimate a theoretical methane yield from microalgae biomass based on 264
an average elemental formula of C2.11H3.93ON0.26 [27]. The maximal CH4 yield would
265
then be 0.55 Nm3 CH4/kgTVS, although this can probably not be achieved in practice due
266
to recalcitrant material that is always present in any organic matter. This generic 267
stochiometric value could also underestimate the methane yield achievable from lipid-268
rich microalgae. For instance, microalgae containing 40% lipids, 20% carbohydrates and 269
28% proteins would have a theoretical yield as high as 0.68 Nm3 CH4/kgTVS. This
270
highlights the importance of using actual assayed values of methane production from 271
algal biomass rather than theoretical estimates. The final methane production from 272
Scenedesmus sp.AMDD-Jul 2011 and Isochrysis spp. represented between 60 and 75 % 273
of the theoretical methane yields predicted from the high-lipid and average elemental 274
stochiometries mentioned above, respectively.. The relatively high methane yields 275
obtained from Scenedesmus sp.-AMDD and Isochrysis sp. indicates they may be good 276
candidates for large-scale production. 277
Previous studies have discussed the similarities and differences of microalgal 278
biomass and waste activated sludge (WAS) regarding their composition and anaerobic 279
degradation potential [17, 29]. In this study, it was shown that methane production from 280
microalgae was a relatively fast process, with digestion times that were comparable to 281
what is required for municipal sludge (20-40 days) [30]. The methane yield was over 330 282
Nm3 CH4/kgTVS for 50% of the microalgae strains tested (Table 1), representing a
283
conversion efficicency of 60% using the stochiometric formula detailed above, and this 284
would suggest better amenability to biodegradation than WAS [12]. 285
286
One factor that could have contributed to the high methane yields obtained in this study 287
could be the freezing of the microalgae paste for storage prior to shipment between 288
collaborating laboratories. This can be considered a form of pretreatment that may to 289
some extent disintegrate the microalgae prior to digestion. Freeze thaw cycling is known 290
to cause a decrease in the volatile solids (TVS) of mixed sewage sludge simultaneously 291
with an increase of the soluble COD and VFAs, thereby improving biogas yield [31]. 292
This is consistent with the results of Harith et al [32], who showed that freezing the 293
marine diatom Chaetoceros calcitrans at -20°C for 2 weeks decreased its viability upon 294
thawing. Another positive aspect of the present study is our use of wet algal biomass. The 295
use of dried algae biomass has been shown to reduceits digestibility compared to wet 296
material [33]. 297
298
Some of the microalgal strains tested in this study have been reported to contain high oil 299
content (% dry wt): Botryococcus braunii 75), Chlorella (28-32), Isochrysis sp. (25-300
33), Nannochloropsis sp. (31-68), Neochloris oleoabundans (35-54), Phaeodactylum 301
tricornutum (20-30) (extracted from Table 2 in [4]). Their methane production ranged 302
from very low (228 mL CH4/gTVS for Nannochloropsis gaditana) to high (408 mL
303
CH4/gTVS for Isochrysis sp., Table 3). The low yield obtained for Nannochloropsis
304
could be related to its tough cell wall, caused by the presence of sporopollenin polymers 305
[34]. The high methane production from the digestion of B. braunii (343-370 mL 306
CH4/gTVS) could be due to the presence of anexternal lipid biofilm matrix thatholds the
307
fan-shaped colonies of B. braunii together [35]. Six different strains of Chlorella were
308
tested in this screening study and their methane yields were lower than in previous
309
recalcitrant cellulosic cell walls [36]. Among the strains listed above, Isochrysis sp. 311
showed the highest methane production (408 mL CH4/gTVS). Isochrysis sp. is known to
312
synthesize high amounts of lipids, mainly polyunsaturated fatty acids (PUFAs) [37]. 313
Furthermore, the absence of a tough cell wall makes this strain an interesting prospect for 314
biofuel production. 315
316
The highest methane yield (410 6 mL/gTVSin) was obtained with wastewater-grown
317
Scenedesmus sp.-AMDD, despite previous reports that Scenedesmus are supposed to be 318
highly recalcitrant to digestion due to a tough polysaccharide-based cell wall [15, 38]. 319
This is in contrast to the findings of Mussgnug et al [15] where a relatively low methane 320
yield of 287 mL/gVS was reported from Scenedesmus obliquus. Light microscopy photos 321
even showed intact cells after prolonged anaerobic incubation, and their hypothesis for 322
methane production within the digester included methane from debris transferred with the 323
culture or biodegradable metabolites provided by the activity of Scenedesmus within the 324
digester. Presumably, the specific inoculum used in our BMP assays had a stronger 325
cytolytic activity than inocula from other studies. A higher cellulase activity in the assay 326
would favor the disruption of the cell wall and membrane of the microalgae [39], thus 327
allowing a higher methane production. 328
329
However, the Scenedesmus sp.-AMDD strain yielded significantly less methane (306 ± 330
14 mL CH4/gTVS) when growing in the Bold's 3N medium as compared with
331
wastewater. In a related study, an average methane production yield of 340 mL/gTVS 332
(for a 56% conversion efficiency) was obtained with Scenedesmus sp.-AMDD grown on 333
a different municipal wastewater [10]. The difference observed for the three experiments 334
with S. sp-AMDD supports the view that factors such as the culture medium and growth 335
conditions could have a significant impact on the specific methane yield. Methane yields 336
from digestions of specific algae strains grown in the same medium are generally less 337
variable than when grown in different media. For instance, the methane production from
338
two Botryococcus braunii assays grown in f/2 medium fifteen months apart reached 342
339
± 23 and 370 ± 10 mL CH4/gTVS, respectively.
340 341
3.3. Comparison of the methane production results from the freshwater and marine strains 342
One of the objectives of this study was to compare the methane production potentials 343
obtained from freshwater versus marine microalgae. It is interesting to note that both 344
freshwater (Scenedesmus sp.-AMDD, 410 mL CH4/gTVS ) and marine (Isochrysis sp.,
345
408 mL CH4/gTVS) microalgae have the potential to generate high yields of methane
346
after anaerobic digestion. Figure 2 presents the methane produced for all screened strains, 347
grouped between freshwater and marine microalgae. The average methane production 348
from the freshwater microalgae was 329 ± 43 mL CH4/gTVS, compared with 298 ± 83
349
mL CH4/gTVS for the marine strains. It can be clearly seen from the size of the boxes
350
and the standard deviations, that the methane production varied greatly, in particular for 351
the marine strains. The data from both groups were processed through an F-test resulting 352
in unequal variances (P = 0.027), followed by a t-test showing no significant difference 353
(P = 0.229) between the methane yields obtained from freshwater or marine microalgae. 354
The choice of a microalgal strain for methane production will therefore have to be made 355
considering the different aspects of the culture of the model strain (productivity, use of 356
land, harvesting). 357
358
3.4. Comparison of the methane production results as a function of the cultivation 359
medium 360
All the marine strains tested in this study, along with four freshwater strains, were grown 361
on f/2 medium. Figure 3 shows the methane production results, grouped with respect to 362
the growth medium, and with a further separation between B3NV and f/2 media for the 363
freshwater strains. The average methane production from the freshwater microalgae was 364
310 ± 35 and 365 ± 25 mL CH4/gTVS with B3NV and f/2 media, respectively. The
365
average methane production for the marine microalgae grown on f/2 medium reached 298 366
± 83 mL CH4/gTVS. As mentioned in Section 3.3, the methane production seemed to
367
vary more for the marine strains. 368
369
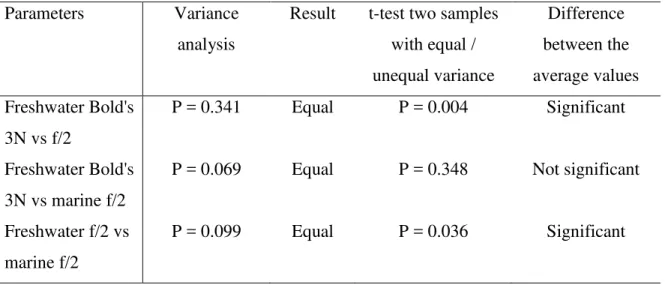
The three groups of data were processed through an F-test for variance, followed by a t-370
test assuming equal / unequal variances to evaluate if their means were equal or 371
the average values from the triplicates, i.e. performed on 12, 4 and 5 values for the B3NV 373
and f/2 media for freshwater microalgae and f/2 medium for marine microalgae, 374
respectively. There was a significant difference (P = 0.004) in the methane production 375
results for the freshwater strains between B3NV and f/2 media. A comparison between 376
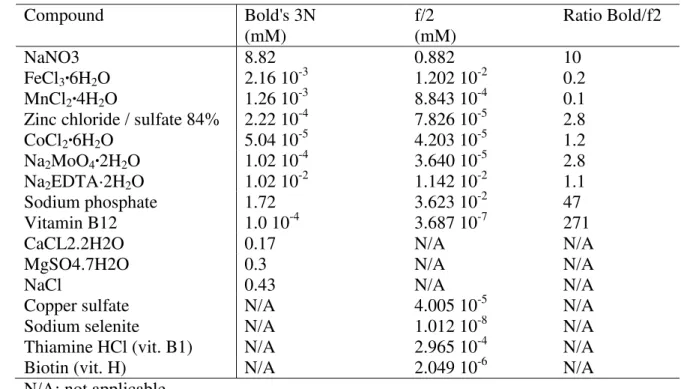
B3NV and f/2 medium revealed that the B3NV medium is significantly richer in nutrients 377
with 10 times more nitrates and 47 times more phosphates (Table 1). The f/2 medium 378
could have promoted the accumulation of lipids in the algae strains which would have 379
resulted in higher methane production after anaerobic digestion (Figure 3). B3NV 380
medium also contained much more cobalamin (vitamin B12). However, the exact role of 381
cobalamin in the microalgae metabolism is still unknown and around half of the 382
microalgae species can synthetize their own cobalamin [40]. Therefore the potential 383
benefits of a higher cobalamin dose could not be confirmed as the capacity of each of the 384
tested micro-algae for B12 synthesis is unknown.
385 386
There was also a significant difference (P = 0.036) in the methane production results for 387
the freshwater and marine strains grown on f/2 media, although the low number of 388
samples from which the means were obtained could limit the statistical significance of 389
the test. 390
391
3.5. Cost aspects of producing methane from microalgal biomass
392
A recent cost analysis [41] concluded that methane production and cogeneration from
393
microalgal biomass would become profitable from a feed-in tariff (FIT) of €0.133/kWh
394
for both heat and electricity on an equal basis and a carbon credit of €30/t eCO2, although
395
the latter would only represent 4% of the revenue. The analysis assumed that the algal
396
culture in raceway ponds can have a minimal productivity of 90 dry t/ha.yr, be
397
concentrated up to 20–60 dry kg/m3 at the harvest, which is estimated to represent a
398
feedstock cost of €86–€124/dry t, and that the algal concentrate can be processed in an
399
anaerobic reactor at a loading rate of 20 kg VS/m3.d with a conversion efficiency of 75%.
400
Our results show that a number of microalgal strains have a methane potential near or
401
above 0.4 Nm3/kg VS (i.e. corresponding to a conversion efficiency of ca. 75%), which
402
would match or even lower the minimum FIT for profitability in the above case study. A
variety of pre-treatment techniques could certainly improve the methane production from
404
microalgal biomass, and accordingly increase the revenue [6]. But the addition of a
pre-405
treatment stage would also increase the capital and operation costs, which may not be
406
offset by the gain in methane.
407 408
4.
CONCLUSIONS
409
The identification of a particular microalgae strain as a model for biofuel production 410
represents a challenge considering that many parameters such as high biomass and lipid 411
yields, which are often mutually exclusive, have to be taken into account. The approach 412
that was favored in this study was to target strains with a high dry weight to culture 413
volume ratio. 414
415
In this study, a screening of the methane production potential of freshwater and marine 416
microalgae was performed in order to identify the most promising strain for further work 417
development. Specifically, the highest methane production was obtained from 418
Scenedesmus dimorphus, Scenedesmus sp. AMDD and Isochrysis sp., among the 20 419
tested strains. Some interesting outcomes were derived from these assays, such as the 420
demonstration that high methane production can be obtained from previously reported 421
hard to digest microalgae strains, without any preliminary pretreatment aside from the 422
potential impact of freezing / thawing, with unadapted anaerobic inoculum. Also, the 423
impact of the growth medium on the resulting methane production from the microalgae 424
was shown to be significant, independant of the type of water in which the microalgae are 425
grown. 426
427
Among the three highest methane yielding strains, Scenedesmus sp. AMDD was chosen 428
for further study, for practical reasons, as it is robust, easy to cultivate and generates high 429
biomass yields on municipal wastewater. Future work will include continuous digestion 430
of microalgal biomass in lab-scale digesters, and the use of thermal and chemical 431
pretreatments in order to increase the methane production. 432
ACKNOWLEDGEMENTS 434
435
The authors are grateful to Caroline Roy and Maryse Charlebois for their help with the 436
monitoring of some methane potential assays. The authors also wish to thank M. A. 437
Corriveau for analytical assistance with the VFA and ammonium determination. This 438
work was supported by the AAFC-NRCan-NRC's National Bioproducts Program on 439
Microalgae Biofuels. This is NRC publication no. xxxxx. 440
441
REFERENCES 442
[1] Konur O. The scientometric evaluation of the research on the algae and bio-energy. 443
Applied Ener, 2011;88:3532-40. 444
[2] McGinn, PJ, Dickinson KE, Bhatti S, Frigon JC, Guiot SG, O’Leary SJB. Integration 445
of microalgae cultivation with industrial waste remediation for biofuel and bioenergy 446
production: opportunities and limitations. Photosynth. Res., 2011;109(1-3):231-47. 447
[3] Mata TM, Martins AA, Caetano NS. Microalgae for biodiesel production and other 448
applications: A review. Renew Sust Energ Rev, 2010;14:217-32. 449
[4] Chisti Y. Biodiesel from microalgae. Biotechnol Adv 2007; 25:294-306. 450
[5] Gonzalez-Fernandez C, Sialve B, Bernet N, Steyer JP. Impact of microalgae 451
characteristics on their conversion to biofuel. Part II: Focus on biomethane production. 452
Biofuel, Bioprod Biorefin, 2012;6(2):205-18. 453
[6] Guiot SR, Frigon JC. Anaerobic digestion as an effective biofuel production 454
technology. In Hallenbeck PC editor. Microbial Technologies in Advanced Biofuels 455
Production. New York, Springer Publisher, 2011, p. 143-164. 456
[7] Collet P, Hélias A, Lardon L, Ras M, Goy RA, Steyer JP. Life-cycle assessment of 457
microalgae culture coupled to biogas production. Biores Technol 2011;102:207-14. 458
[8] Park KC, Whitney C, McNichol JC, Dickinson KE, MacQuarrie S, Skrupski BP et al. 459
Mixotrophic and photoautotrophic cultivation of 14 microalgae isolates from 460
Saskatchewan, Canada: potential applications for wastewater remediation for biofuel 461
production. J Appl Phycol, 2012;339-48. 462
[9] Harun R, Davidson M, Doyle M, Gopiraj R, Danquah M, Forde G. Technoeconomic 463
analysis of an integrated microalgae photobioreactor, biodiesel and biogas production 464
facility. Biomass and Bioenergy, 2011;35:741-7. 465
[10] McGinn PJ, Dickinson KE, Park KC, Whitney CG, MacQuarrie SP, Black FJet al. 466
2012. Assessment of the bioenergy and bioremediation potentials of the microalga 467
Scenedesmus sp. AMDD cultivated in municipal wastewater effluent in batch and 468
continuous mode. Algal Res, 2012;1(2):155-65. 469
[11] Mata-Alvarez J. Anaerobic digestion of the organic fraction of municipal solid 470
waste: a perspective; In: Biomethanization of the organic fraction of municipal solid 471
wastes. Mata-Alvarez J editor, Cornwall, IWA publishing, 2003, p. 91-109. 472
[12] Parkin GF, Owen WF. Fundamentals of anaerobic digestion of wastewater sludge, J 473
Environ Eng Div Am Soc Civil Eng,1986;122,867-920. 474
[13] Frigon JC, Roy C, Guiot SR. Anaerobic co-digestion of dairy manure with mulched 475
switchgrass for improvment of the methane yield. Bioprocess Biosyst Eng, 476
2012b;35:341-9. 477
[14] Sialve B, Bernet N, Bernard O. Anaerobic digestion of microalgae as a necessary 478
step to make microalgal biodiesel sustainable. Biotechnol Adv, 2009;27:409-16. 479
[15] Mussgnug JH, Klassen V, Schlüter A, Kruse O. Microalgae as substrates for 480
fermentative biogas production in a combined biorefinery concept. J Biotechnol, 481
2010;150(1):51-6. 482
[16] Zamalloa C, Boon N, Verstraete W. Anaerobic digestibility of Scenedesmus 483
obliquus and Phaeodactylum tricornutum under mesophilic and thermophilic conditions, 484
Appl Ener, 2012a;92:733-8. 485
[17] Ras M, Lardon L, Sialve B, Bernet N, Steyer JP. Experimental Study on a coupled 486
process of production and anaerobic digestion of Chlorella vulgaris. Biores Technol, 487
2011;102:200-6. 488
[18] Zamalloa C, De Vrieze J, Boon N, Verstraete W. Anaerobic digestibility of marine 489
microalgae Phaeodactylum tricornutum in a lab-scale anaerobic membrane bioreactor, 490
Appl Microbiol Biotechnol, 2012b;93(2):859-69. 491
[19] Guillard RRL 1975. Culture of phytoplankton for feeding marine invertebrates. In 492
Smith WL, Chanley MH, editors. Culture of Marine Invertebrate Animals. NewYork, 493
Plenum Press, 1975, p. 26-60. 494
[20] Cornacchio L, Hall ER, Trevors JT. Modified serum bottle testing procedures for 495
industrial wastewaters. In: Technology transfer workshop on laboratory scale anaerobic 496
treatability testing technique, Wastewater Technology Center, Environment Canada. 497
1986. 498
[21] Frigon JC, Mehta P, Guiot SR. Impact of mechanical, chemical and enzymatic 499
pretreatments on the methane yield from the anaerobic digestion of switchgrass. Biomass 500
Bioener, 2012a;36(1):1-11. 501
[22] Raposo F, Fernández-Cegrí V, De la Rubia M, Borja R, Béline F, Cavinato C et al. 502
Biochemical methane potential (BMP) of solid organic substrates: evaluation of 503
anaerobic biodegradability using data from an international interlaboratory study. J Chem 504
Technol Biotechnol, 2011;86(8):1088-98. 505
[23] APHA, AWWA, WEF. Standard methods for the examination of water and 506
wastewater. 21st edition, Eaton AD, Clesceri LS Rice EW and Greenberg AE eds, 507
Washington, DC, USA. 2005. 508
[24] Levene H. Robust tests for equality of variances. In: Contributions to Probability and 509
Statistics; Essays in Honor of Harold Hotelling. Olkin I, Ghurye SG, Hoeding W, Madow 510
WG, Mann HB editors; Stanford University Press, 1960; p. 278–292. 511
[25] Welch BL. 1947. The generalization of "Student's" problem when several different 512
population variances are involved. Biometrika, 1947;34(1–2):28–35. 513
[26] Hansen KH, Angelidaki I, Ahring BK. Anaerobic digestion of swine manure: 514
inhibition by ammonia. Water Res, 1998;38:5–12. 515
[27] Heaven S, Milledge J, Zhang Y Comments on ‘Anaerobic digestion of microalgae as 516
a necessary step to make microalgal biodiesel sustainable’. Biotech Adv, 2011;29(1):164-517
7. 518
[28] Lalman JA, Bagley DM. Anaerobic degradation and inhibitory effects of linoleic 519
acid. Wat Res, 2000;34(17):4220-28. 520
[29] Gonzalez-Fernandez C, Riaño-Irazabal B, Molinuevo-Salces B, Blanco S, Garcia-521
Gonzalez MC. Effect of operational conditions on the degradation of organic matter and 522
development of microalgae-bacteria consortia when treating swine slurry. Appl Microbiol 523
Biotechnol, 2011;90:1147-53. 524
[30] Bolzonella D, Pavan P, Battistoni P, Cecchi F. Mesophilic anaerobic digestion of 525
waste activated sludge: influence of the solid retention time in the wastewater treatment 526
process. Proc Biochem, 2005; 40:1453–1460. 527
[31] Montusiewicz A, Lebiocka M, Rożej A, Zacharska E, Pawłowski L. 528
Freezing/thawing effects on anaerobic digestion of mixed sewage sludge. Biores Tech, 529
2010;110(10), 3466–73. 530
[32] Harith ZT, Yusoff FM, Shariff M, Ariff AB. Effect of different separation 531
techniques and storage temperatures on the viability of marine microalgae, Chaetoceros 532
calcitrans, during storage. Biotechnol, 2010;9:387–91. 533
[33] Asinari Di San Marzano CM, Legros A, Naveau H, Nyns EJ. Biomethanation of the 534
marine algae Tetraselmis. Int J Sustain Energy1981; 1(4):263–72. 535
[34] Sarokin DJ, Carpenter EJ. Ultrastructure and taxonomic observations on marine 536
isolates of the genus Nannochloris (Chlorophyceae), Bot Mar, 1982;25:483-92. 537
[35] Wolf FR, Nonomura AM, Bassham JA. Growth and branched hydrocarbon 538
production in a strain of Botryococcus braunii (Chlorophyta). J Phycol, 1985;21(3):388-539
96. 540
[36] Okuda K. Structure and phylogeny of cell coverings. J Plants Res, 2002;115:283-8. 541
[37] Renaud SM, Thinh LV, Parry DL. The gross chemical composition and fatty acid 542
composition of 18 species of tropical Australian microalgae for possible use in 543
mariculture, Aquaculture, 1999;170:147-59. 544
[38] Takeda H. Cell wall sugars of some Scenedesmus species. Phytochemistry, 545
1996;42:673-5. 546
[39] Hungate RE. The anaerobic mesophilic cellulolytic bacteria. Bacteriol Rev., 547
1950;14(1):1-49. 548
[40] Croft MT, Lawrence AD, Raux-Deery E, Warren MJ, Smith AG. Algae acquire 549
vitmin B12 through a symbiotic relationship with bacteria. Nature, 2005;438:90-93. 550
[41] Zamalloa C, Vulsteke E, Albrecht J, Verstraete W. The techno-economic potential of 551
renewable energy through the anaerobic digestion of microalgae. Biores Tech, 552
2011;102(2):1149-58. 553
554 555
Figure captions 556
557
Figure 1. Typical time courses of methane production from anaerobic digestion of five 558
microalgae strains. The cumulative methane production for each of the strain is expressed 559
in mL of methane produced per gram of total volatile solids of microalgae added in the 560
test bottles. The methane production shown is a net production, e.g. with endogenous 561
control removed. 562
563
Figure 2. Comparison of the amount methane produced from freshwater versus marine 564
microalgae strains. The methane production for each category of microalgae is expressed 565
in mL of methane produced per gram of total volatile solids of microalgae added in the 566
test bottles. The box plot can be described as follow: the lower and upper limit of the box 567
represents the lower (25%) and upper quartile (75%) for the data distribution. In other 568
words, 50% of the methane production values are comprised within the box. The line 569
inside the box represents the median value (50%). The whiskers represent the minimum 570
and the maximum values for each category of microalgae. 571
572
Figure 3. Comparison of the amount methane produced from the microalgae strains as a 573
function of the culture growth medium. The methane production for each category of 574
microalgae is expressed in mL of methane produced per gram of total volatile solids of 575
microalgae added in the test bottles. The box plot can be described as follow: the lower 576
and upper limit of the box represents the lower (25%) and upper quartile (75%) for the 577
data distribution. In other words, 50% of the methane production values are comprised 578
within the box. The line inside the box represents the median value (50%). The whiskers 579
represent the minimum and the maximum values for each category of microalgae. 580
581 582
Table 1. Comparison between the composition of the Bold's 3N and f/2 media 583 584 Compound Bold's 3N (mM) f/2 (mM) Ratio Bold/f2 NaNO3 8.82 0.882 10 FeCl3·6H2O 2.16 10-3 1.202 10-2 0.2 MnCl2·4H2O 1.26 10-3 8.843 10-4 0.1
Zinc chloride / sulfate 84% 2.22 10-4 7.826 10-5 2.8
CoCl2·6H2O 5.04 10-5 4.203 10-5 1.2
Na2MoO4·2H2O 1.02 10-4 3.640 10-5 2.8
Na2EDTA·2H2O 1.02 10-2 1.142 10-2 1.1
Sodium phosphate 1.72 3.623 10-2 47
Vitamin B12 1.0 10-4 3.687 10-7 271
CaCL2.2H2O 0.17 N/A N/A
MgSO4.7H2O 0.3 N/A N/A
NaCl 0.43 N/A N/A
Copper sulfate N/A 4.005 10-5 N/A
Sodium selenite N/A 1.012 10-8 N/A
Thiamine HCl (vit. B1) N/A 2.965 10-4 N/A
Biotin (vit. H) N/A 2.049 10-6 N/A
N/A: not applicable. 585
586 587 588
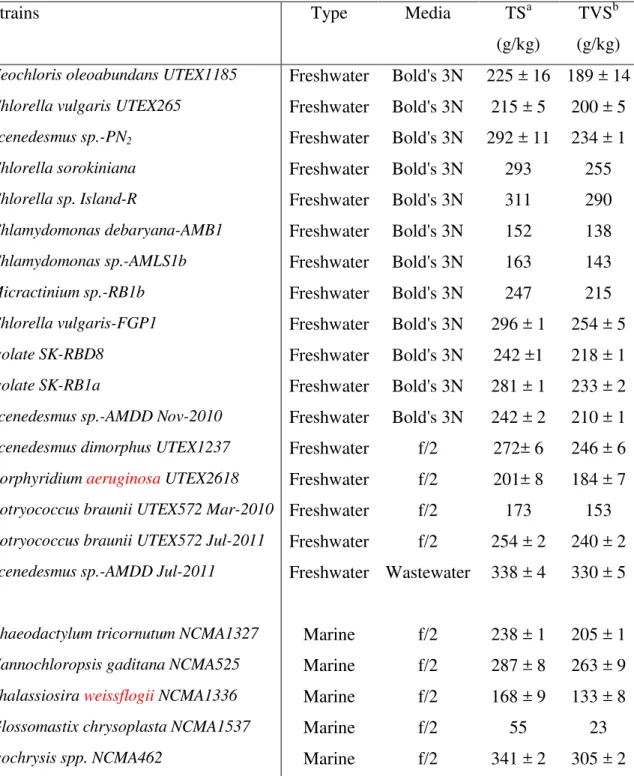
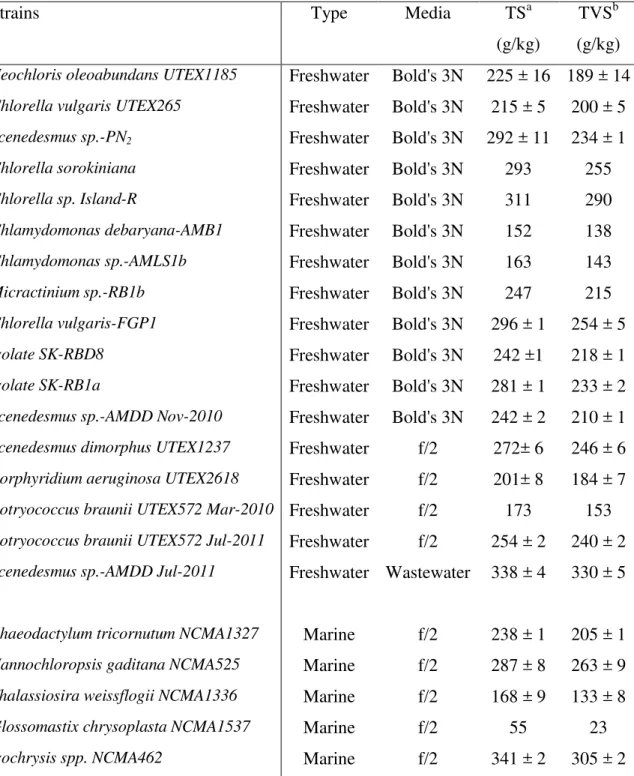
Table 2. Listing of the strains of microalgae tested for methane potential
Strains Type Media TSa
(g/kg)
TVSb (g/kg)
Neochloris oleoabundans UTEX1185 Freshwater Bold's 3N 225 ± 16 189 ± 14
Chlorella vulgaris UTEX265 Freshwater Bold's 3N 215 ± 5 200 ± 5
Scenedesmus sp.-PN2 Freshwater Bold's 3N 292 ± 11 234 ± 1
Chlorella sorokiniana Freshwater Bold's 3N 293 255
Chlorella sp. Island-R Freshwater Bold's 3N 311 290
Chlamydomonas debaryana-AMB1 Freshwater Bold's 3N 152 138
Chlamydomonas sp.-AMLS1b Freshwater Bold's 3N 163 143
Micractinium sp.-RB1b Freshwater Bold's 3N 247 215
Chlorella vulgaris-FGP1 Freshwater Bold's 3N 296 ± 1 254 ± 5
Isolate SK-RBD8 Freshwater Bold's 3N 242 ±1 218 ± 1
Isolate SK-RB1a Freshwater Bold's 3N 281 ± 1 233 ± 2
Scenedesmus sp.-AMDD Nov-2010 Freshwater Bold's 3N 242 ± 2 210 ± 1
Scenedesmus dimorphus UTEX1237 Freshwater f/2 272± 6 246 ± 6
Porphyridium aeruginosa UTEX2618 Freshwater f/2 201± 8 184 ± 7
Botryococcus braunii UTEX572 Mar-2010 Freshwater f/2 173 153
Botryococcus braunii UTEX572 Jul-2011 Freshwater f/2 254 ± 2 240 ± 2
Scenedesmus sp.-AMDD Jul-2011 Freshwater Wastewater 338 ± 4 330 ± 5
Phaeodactylum tricornutum NCMA1327 Marine f/2 238 ± 1 205 ± 1
Nannochloropsis gaditana NCMA525 Marine f/2 287 ± 8 263 ± 9
Thalassiosira weissflogii NCMA1336 Marine f/2 168 ± 9 133 ± 8
Glossomastix chrysoplasta NCMA1537 Marine f/2 55 23
Isochrysis spp. NCMA462 Marine f/2 341 ± 2 305 ± 2
a
Total solids (TS). Initial TS concentration of the paste collected after centrifugation.
b
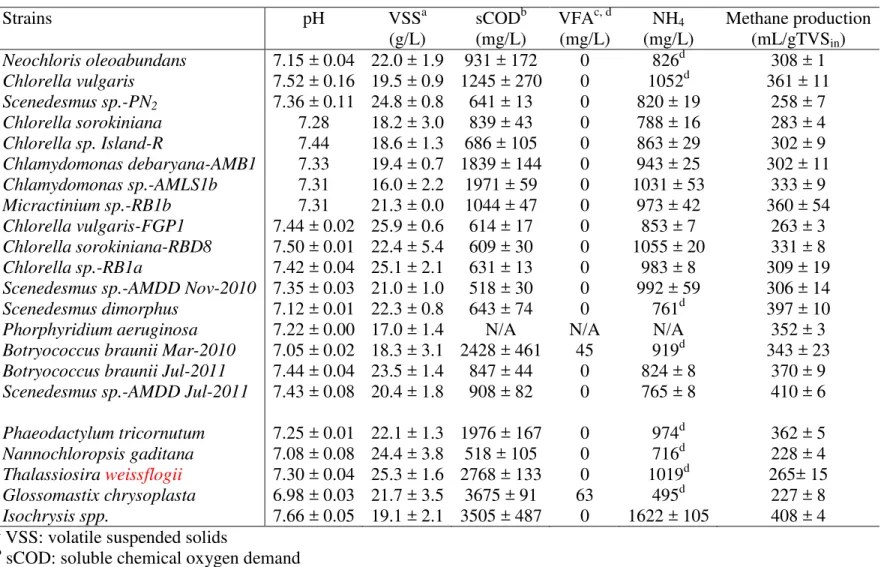
Table 3. Final results from the methane potential assays for all tested microalgae strains
Strains pH VSSa sCODb VFAc, d NH4 Methane production
(g/L) (mg/L) (mg/L) (mg/L) (mL/gTVSin) Neochloris oleoabundans 7.15 ± 0.04 22.0 ± 1.9 931 ± 172 0 826d 308 ± 1 Chlorella vulgaris 7.52 ± 0.16 19.5 ± 0.9 1245 ± 270 0 1052d 361 ± 11 Scenedesmus sp.-PN2 7.36 ± 0.11 24.8 ± 0.8 641 ± 13 0 820 ± 19 258 ± 7 Chlorella sorokiniana 7.28 18.2 ± 3.0 839 ± 43 0 788 ± 16 283 ± 4 Chlorella sp. Island-R 7.44 18.6 ± 1.3 686 ± 105 0 863 ± 29 302 ± 9 Chlamydomonas debaryana-AMB1 7.33 19.4 ± 0.7 1839 ± 144 0 943 ± 25 302 ± 11 Chlamydomonas sp.-AMLS1b 7.31 16.0 ± 2.2 1971 ± 59 0 1031 ± 53 333 ± 9 Micractinium sp.-RB1b 7.31 21.3 ± 0.0 1044 ± 47 0 973 ± 42 360 ± 54 Chlorella vulgaris-FGP1 7.44 ± 0.02 25.9 ± 0.6 614 ± 17 0 853 ± 7 263 ± 3 Chlorella sorokiniana-RBD8 7.50 ± 0.01 22.4 ± 5.4 609 ± 30 0 1055 ± 20 331 ± 8 Chlorella sp.-RB1a 7.42 ± 0.04 25.1 ± 2.1 631 ± 13 0 983 ± 8 309 ± 19 Scenedesmus sp.-AMDD Nov-2010 7.35 ± 0.03 21.0 ± 1.0 518 ± 30 0 992 ± 59 306 ± 14 Scenedesmus dimorphus 7.12 ± 0.01 22.3 ± 0.8 643 ± 74 0 761d 397 ± 10 Phorphyridium aeruginosa 7.22 ± 0.00 17.0 ± 1.4 N/A N/A N/A 352 ± 3 Botryococcus braunii Mar-2010 7.05 ± 0.02 18.3 ± 3.1 2428 ± 461 45 919d 343 ± 23 Botryococcus braunii Jul-2011 7.44 ± 0.04 23.5 ± 1.4 847 ± 44 0 824 ± 8 370 ± 9 Scenedesmus sp.-AMDD Jul-2011 7.43 ± 0.08 20.4 ± 1.8 908 ± 82 0 765 ± 8 410 ± 6 Phaeodactylum tricornutum 7.25 ± 0.01 22.1 ± 1.3 1976 ± 167 0 974d 362 ± 5 Nannochloropsis gaditana 7.08 ± 0.08 24.4 ± 3.8 518 ± 105 0 716d 228 ± 4 Thalassiosira weissflogii 7.30 ± 0.04 25.3 ± 1.6 2768 ± 133 0 1019d 265± 15 Glossomastix chrysoplasta 6.98 ± 0.03 21.7 ± 3.5 3675 ± 91 63 495d 227 ± 8 Isochrysis spp. 7.66 ± 0.05 19.1 ± 2.1 3505 ± 487 0 1622 ± 105 408 ± 4 a
VSS: volatile suspended solids
b
sCOD: soluble chemical oxygen demand
c
VFA: volatile fatty acid
d
Table 4. Statistical analysis to compare the physico-chemical parameters of the freshwater and marine microalgae at the end of the methane production assays
Parameters Variance analysis
Result t-test two samples with equal / unequal variance
Difference between the average values
pH P = 0.024 Unequal P = 0.270 Not significant
VSS P = 0.492 Equal P = 0.151 Not significant
sCOD P = 0.008 Unequal P = 0.035 Significant
Ammonium P < 0.001 Unequal P = 0.381 Not significant alpha: 0.05
Table 5. Statistical analysis to compare the methane production of freshwater and marine microalgae grown in Bold's 3N or f/2 media
Parameters Variance
analysis
Result t-test two samples with equal / unequal variance Difference between the average values Freshwater Bold's 3N vs f/2 P = 0.341 Equal P = 0.004 Significant Freshwater Bold's 3N vs marine f/2
P = 0.069 Equal P = 0.348 Not significant
Freshwater f/2 vs marine f/2
P = 0.099 Equal P = 0.036 Significant
alpha: 0.05 1