HAL Id: hal-03085723
https://hal.archives-ouvertes.fr/hal-03085723
Submitted on 21 Dec 2020HAL is a multi-disciplinary open access archive for the deposit and dissemination of sci-entific research documents, whether they are pub-lished or not. The documents may come from teaching and research institutions in France or abroad, or from public or private research centers.
L’archive ouverte pluridisciplinaire HAL, est destinée au dépôt et à la diffusion de documents scientifiques de niveau recherche, publiés ou non, émanant des établissements d’enseignement et de recherche français ou étrangers, des laboratoires publics ou privés.
Operando decoding of chemical and thermal events in
commercial Na(Li)-ion cells via optical sensors
Jiaqiang Huang, Laura Albero Blanquer, Julien Bonefacino, E. Logan, Daniel
Alves Dalla Corte, Charles Delacourt, Betar Gallant, Steven Boles, J. Dahn,
Hwa-Yaw Tam, et al.
To cite this version:
Jiaqiang Huang, Laura Albero Blanquer, Julien Bonefacino, E. Logan, Daniel Alves Dalla Corte, et al.. Operando decoding of chemical and thermal events in commercial Na(Li)-ion cells via optical sensors. Nature Energy, Nature Publishing Group, 2020, 5 (9), pp.674-683. �10.1038/s41560-020-0665-y�. �hal-03085723�
1
Operando monitoring of chemical and thermal events in
commercial Na(Li)-ion cells via optical sensors
Jiaqiang Huang1,2, Laura Albero Blanquer1,2,3, Julien Bonefacino4, Eric R. Logan5, Daniel Alves Dalla
Corte1,2, Charles Delacourt7, Betar M. Gallant8, Steven T. Boles4, Jeff R. Dahn5,6, Hwa-Yaw Tam4 and
Jean-Marie Tarascon1,2,3,*
1 Collège de France, Chimie du Solide et de l'Energie - UMR 8260 CNRS, 11 Place Marcelin Berthelot, 75005 Paris,
France
2 Réseau sur le Stockage Electrochimique de l’Energie (RS2E) - FR CNRS 3459, 80039 Amiens Cedex, France 3 Sorbonne Université – UPMC Paris 06, 4 Place Jussieu, 75005 Paris, France
4 Photonics Research Centre, Department of Electrical Engineering, The Hong Kong Polytechnic University, Hung Hom,
Kowloon, Hong Kong SAR, China
5 Department of Physics and Atmospheric Science, Dalhousie University, Halifax, Nova Scotia, Canada B3H 3J5 6 Department of Chemistry, Dalhousie University, Halifax, Nova Scotia, Canada B3H 4R2
7 Laboratory of reactivity and chemistry of solids, LRCS, CNRS UMR 7314, Amiens, France
8 Department of Mechanical Engineering, Massachusetts Institute of Technology, Cambridge, MA 02139, United States
* Corresponding author:
2
Abstract
Monitoring the dynamic chemical and thermal state of a cell during operation is crucial to making meaningful advancements in battery technology as safety and reliability cannot be compromised. Here we demonstrate the feasibility of incorporating optical fiber Bragg grating sensors inside commercial 18650 cells. By adjusting fiber morphologies, wavelength changes associated with both temperature and pressure are decoupled with high accuracy, and this allows for tracking of chemical events such as solid electrolyte interphase formation and structural evolution. Additionally, we demonstrate how multiple sensors can function as a microcalorimeter to monitor the heat generated by the cell. Resolving this heat in detail is not possible with conventional isothermal calorimetry and the importance of assessing the cell’s heat capacity contribution is presented. Collectively, these findings offer a scalable solution for screening electrolyte additives, rapidly identifying the best formation processes of commercial batteries, and designing thermal battery management systems with enhanced safety.
Introduction
Rechargeable batteries, as one of the most versatile energy storage technologies, play a central role in the ongoing transition from fossil fuels to renewable energy.1 They are essential in a broad range of
strategic industries including automotive, power grid, aerospace, robotics, and consumer electronics. We are now at the early stage of a new, connected, and green era relying on autonomous vehicles, smart cities, drone surveillance, etc., all of which make battery reliability and lifetime performance immensely more important than ever before. These examples underscore our increasing dependence on batteries, and with it, the need to accurately monitor their functional status. This calls for the development of non-invasive
operando techniques that could inject smart sensing functionalities into these dynamic electrochemical
devices.2
Battery sensing is not something new (Supplementary Fig. 1). It traces back to 1887 when hydrometers were used to measure the electrolyte density in lead-acid batteries to estimate their state of charge (SOC).3 Since then, the field has witnessed the development of sophisticated diagnostic tools relying
on the use of thermocouples, thermistors, pressure gauges, acoustic probes, differential thermal analysis, and other devices.4-8 These efforts have redoubled in intensity over the last decade with the ingress of
numerous on-board electrochemical impedance spectroscopy (EIS) devices together with the developments of sophisticated battery management systems (BMS), allowing for the determination of the battery’s state of health (SOH), but with limitations.9,10 These constraints stem from ill-defined parameters, namely,
temperature, pressure, strain, which impacts the nature, kinetics, and dynamics of the solid and solid-liquid interfaces that govern cell lifetime. In today’s electrical vehicles (EVs), temperature is, for instance, solely measured at the module level, while it is indirectly determined via EIS estimation at the cell level.11
The literature is rich with approaches combining theoretical and electrochemical models to predict battery properties.12 An approach developed by Forgez et al.13 consists of designing a simplified thermal
model which enables estimation of the internal temperature of the battery from surface temperature measurements determined by thermocouples and under different operating conditions. Although straightforward, implementing such approach has drawbacks. Aside from the use of shielded thermocouples
3
and its limited accuracy in estimation, this method solely provides temperature and limited heat-related information, which are crucial in designing or adjusting cooling/heating systems. Moreover, it relies on the use of sensors outside, rather than inside, the batteries. Hence, knowledge of essential internal chemical/physical parameters is limited. Therefore, fundamental advancements are sorely needed to allow for the development of implanted sensors within cells that can measure (with time and space resolution) multiple parameters such as temperature, pressure, and strain, all with high sensitivity.
Pioneering work in this direction was made by Pinto et al. in 2013 as evidenced by their introduction of optical sensing devices within the field of batteries, with special attention to fiber Bragg grating (FBG) sensors.14 Such sensors, are presently used in a broad range of applications including
construction/assembling/infrastructure sectors (e.g., bridges, aircraft, railways) for detecting cracks/fractures. These sensors operate by correlating the wavelength dependence of the emitted signal with local temperature (T), pressure (P) and strain (ε), which are essential parameters for improving battery monitoring. Based on implanted FBG sensors within a battery, researchers could achieve pouch-cell temperature imaging and relate the monitored signals to some battery events, including short-circuit, SOC, and SOH estimations, while pushing further the physics of such sensors to effectively decouple thermal and strain effects.14-19 However, in spite of the benefits of the established correlations from a physics point of view, the
analysis remains orphaned of chemical inputs, hence a missing critical link.
Herein, we close this gap and show that collected optical sensing signals are rich with chemical information that is particularly insightful to understanding parasitic reactions, interfacial growth dynamics. Additionally, we demonstrate the benefit of combining multiple optical fibers for performing heat flow measurements, which allowing for probing cell heat capacity contributions. As proof of concept, we have initially focused on 18650 cells produced by TIAMAT, based on Na-ion Na3V2(PO4)2F3/hard carbon
(NVPF/HC) chemistry prior to generalizing our approach to other electrolytes and battery chemistries to secure the robustness of our findings.
Cell electrochemistry unaffected by FBGs
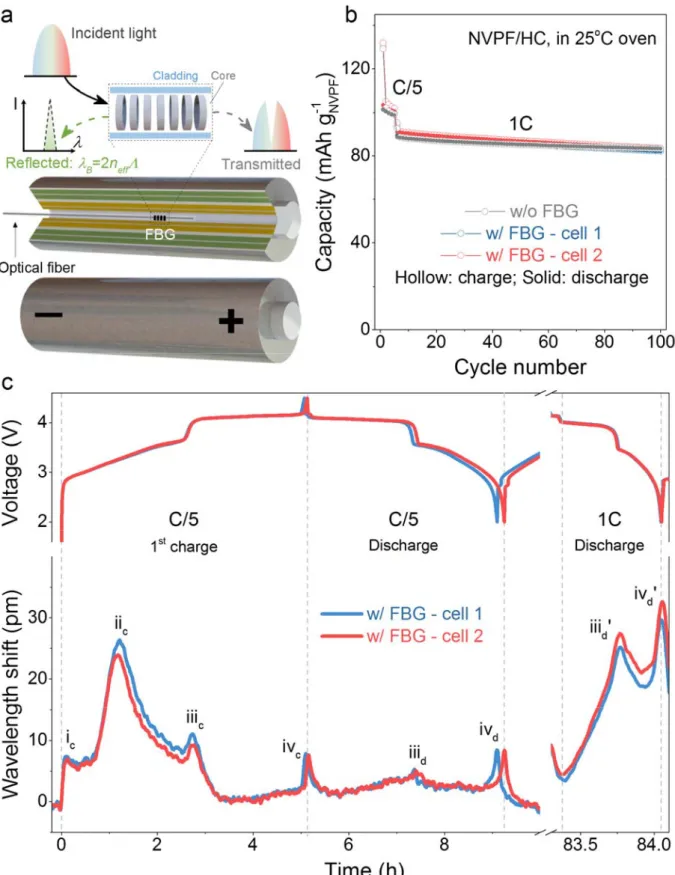
Fig. 1a shows the scheme of a FBG sensor inscribed in a single-mode optical fiber (SMF-FBG), which contains a periodic refractive index modification in the fiber core over a short distance (<1 cm). This segment acts as a reflector for a specific wavelength, defined by λB = 2neff Λ (with λB being the Bragg wavelength, neff being the effective refractive index of the grating, and Λ being the Bragg grating period which is also referred as grating pitch).14 The wavelength shifts of the reflected peak (ΔλB) results from changes in neff and Λ, both
of which depend upon local temperature (T), pressure (P) and strain (ε) changes in the FBG surrounding environment. In a typical measurement, the SMF-FBG is placed into the central void of a pre-drilled 18650-jelly roll with the hole being occasionally used to inject various electrolytes. The hole is then hermetically sealed with an epoxy resin that resists to temperatures and pressures as high as 65 °C and 15 bars. Fig. 1b compares the capacity retention up to 100 cycles of pristine and modified 18650 cells, which look nearly identical, indicating that the FBG sensors do not affect the cell electrochemical properties until at least 100 cycles, independent of the rate used (C/5 or 1 C). Moreover, the overlapping of the retention curves for two different modified cells indicates further the reproducibility and robustness of the sensor mounting protocol.
The variation of the wavelength shift (ΔλB) of the FBG optical signal (Fig. 1c, bottom) as a function of the time-resolved voltage (Fig.1c, top) for two modified cells (blue and red) is collected in an operando
4
mode. Remarkably, the voltage and ΔλB profiles of two cells nearly superimpose with each other, indicating the repeatability of the cell fabrication process together with the reliability of the sensing detection signals. Interestingly, the ΔλB profiles during charging and discharging are full of information, as conveyed by the presence of four peaks during the first charge as opposed to two peaks during the first discharge (Fig. 1c left). Moreover, the amplitudes of the peaks change with increasing the cycling rate since they are much higher at 1 C than at C/5. Consequently, at this stage, the fundamental information behind these optical signals needs to be rationalized and understood. This task is complex because ΔλB is a convolution of several physical variables, including temperature (T), pressure (P) and strain (εeach with different linear variations/responses.
5
Fig. 1 | Concept of optical fiber sensing inside the battery. a, Schematic illustration of the integration of
6
formed at C/5 for five cycles and cycled at 1 C for another 95 cycles in a 25 oC oven. A 5-min rest was set
between charge and discharge. c, The time-resolved voltage of the cell (top) and wavelength shift of the FBG (bottom) in the above two cells at the 1st cycle at C/5 (left) and at the later discharge at 1 C (right). The peaks
of wavelength shift were labelled, for example, by “ic” to “ivc” corresponding to the 1st charge at C/5. The
wavelength shift is relative to the wavelength at time = 0 h. One internal SMF-FBG was used for each cell. Extracting physical parameters from FBG wavelength responses
We measured individually the ΔλB rate constant response (k) to changes in T, Pand ε, and found values of ~+10 pm oC-1 (kT), ~–0.3 pm bar-1 (kP), and ~+0.8 pm μ-1 (kε), respectively (see Supplementary Fig. 2). To
simplify the treatment of the cell measured wavelength shift (ΔλB),we first experimentally eliminated the term
ε by injecting the ~150 μm SMF-FBG into the large central void (~1500 μm) of the jelly roll without being fixed,
as it is required to measure strain. Thus, the variation of ΔλB,SMF. as a function of P and T can be recast and
defined as ΔλB,SMF = kT,SMFΔT + kP,SMFΔP, with this equation being unsolvable because of two remaining unknowns (ΔT, ΔP). Decoupling these two parameters, which have opposite effects on ΔλBvariation, is difficult because of the low pressure sensitivity (–0.3 pm bar-1) of the FBG in single-mode fiber and the
resolution of today’s commercially available optical interrogators (1 pm). This is likely the reason why pressure has yet to be monitored by FBG sensors inside batteries.
This difficulty is eliminated by using a FBG written in a microstructured optical fiber (MOF-FBG). By virtue of its very high air filling fraction (AFF) (Fig. 2a), it is highly sensitive to hydraulic pressure with a rate constant kP,MOF of –2.7 pm bar-1 as opposed to –0.3 pm bar-1 for kP,SMF (while kT,MOF and kT,SMF remain similar, Supplementary Fig. 2), hence ΔλB,MOF = kT,MOFΔT + kP,MOFΔP.15 The signatures of the ΔλB. responses to voltage changes for the SMF (orange) and MOF (purple) fibers both injected into a single NVPF/HC 18650 cell (~800 mAh) are shown in Fig. 2b. Note in both cases, as showed previously in Fig. 1, the appearance of four peaks during the first charge process. The variations of ΔT and ΔP as functions of the time-resolved voltage can be mathematically deduced from these two curves by solving the two sets of equations associated with ΔλB,MOF and ΔλB,SMF. The resulting temperature (middle) and pressure (bottom) profiles (Fig. 2c) for the first charge (solid, red) and discharge (solid, blue) are shown in Fig. 2c. The temporal evolution of internal ΔT exhibits four peaks denoted as ic, iic, iiic, and ivc for the first charge out of which solely two, namely,
iiid and ivd, still persist on the following discharge and subsequent charges/discharges. Note the clear
reversibility of peak iiic (iiid) that can be associated with a structural change pertaining to NVPF, based on the
direct correlation between its appearance and the onset of the sharp jump in the voltage composition curve (as discussed later). Moreover, note that the peak iic of the largest amplitude in the first charge totally
disappears on subsequent charges. This behaviour is nicely mirrored by the temporal evolution of ΔP, which shows at the same time a steep rise in charge, indicative of gas generation. Interestingly, neither of these features remains during subsequent cycling, unambiguously indicating an irreversible phenomenon. This phenomenon is well known within the field of Li(Na)-ion batteries and it is associated to the formation of the solid electrolyte interface, commonly referred to as SEI, that results from the self-limited partial catalytic decomposition of the electrolyte at the electrode surfaces for potentials beyond its range of thermodynamic stability. The endo-/exothermic character of decomposition reactions, usually accompanied by substantial gas formation, drastically increase T and P as experimentally observed.
7
Fig. 2 | Probing temperature and pressure dynamics inside batteries and its implications on SEI. a,
The cross-section SEM images of SMF (left) and MOF (right). The polyimide coating was removed before the cut for a flat cross section. b, The measurements of time-resolved voltage (red) and wavelength shifts (ΔλB) of SMF-FBG (orange) and MOF-FBG (purple) during the first charge of a single NVPF/HC cell at C/10
2 3 4 0 3 6 9 -6 0 6 12 2 3 4 0.0 0.5 1.0 0 3 6 9 0 1 2 3 15 18 21
NP30, in a 25
oC oven
Coreb
Core Single mode fiber(SMF)
70 m
a
Cladding Ringsc
Volt age (V) OCV MOF W a v e lengt h s h if t (pm) Time (h) SMF Discharge Charge OCViv
c Volt age (V)iii
c 1st charge NVPF/HC, NP30Solid: 1
stcycle
Dash: 2
ndcycle
Microstructuredoptical fiber (MOF)
T ( o C) P (bar) Time (h)
i
cii
civ
diii
d8
with NP30. c, The temporal voltage (top), internal temperature change (ΔT, middle), and pressure change (ΔP, bottom) during the first (solid) and second (dash) charge/discharge of NVPF/HC at C/10 and 25°C with NP30. Note that 4-hour rests were allowed between the charge and discharge to separate crossed contributions. For a straightforward comparison, the time of the second charge/discharge was shifted so that the end of charges/discharges of two cycles were aligned. Moreover, to facilitate the pressure variation upon cycling, whose raw data is reported in Supplementary Fig. 3a, we took the pressure after the second discharge rest cycle as Po and report ΔP measured through the second charge cycle as Pmeasured – Po. In
contrast to the first charge, the ΔPvariations after the second charge are tiny and periodically increasing and decreasing by 0.1 bar upon charge and discharge, respectively, reflecting the breathing of the electrodes (see Supplementary Fig. 4).
At this stage, taking advantage of the near absence of gassing-related pressure evolution from the second cycle onward, the sensing protocol can be simplified: From now on, SMF-FBGs can be used exclusively to monitor temperature changes in cells that have been cycled more than 5 times. With such protocols established, an increase in the maximal internal T from 26 oC to 65 oC of a NVPF/HC 18650 cell
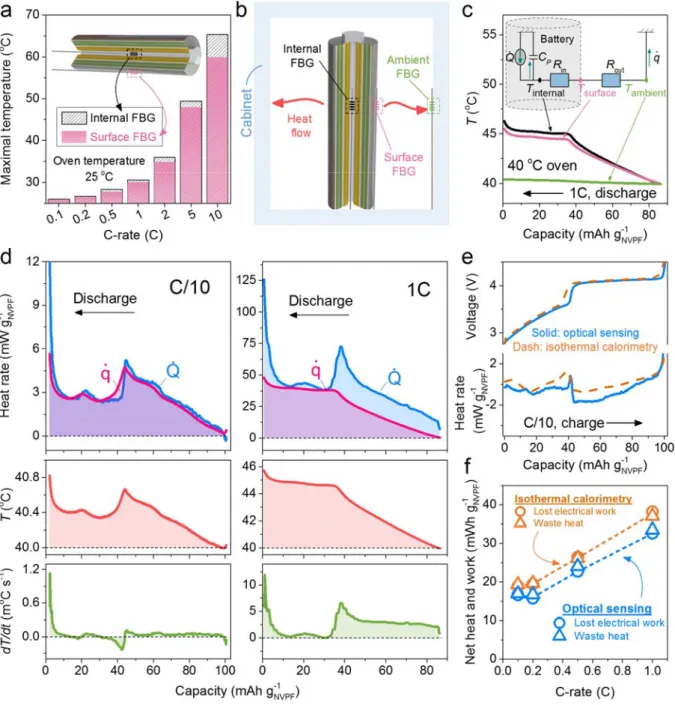
was measured as the cycling rate from C/10 to 10 C, while the temperature difference between the inside of the cell and the surface was found to vary from 0.2 oC to 5.4 oC(Fig. 3a). Besides, the non-equilibrium
temperature gradient was also seen in the longitudinal directions with always a greater temperature near the terminals as expected (Supplementary Fig. 5). Accurate knowledge of such values is critical for improving BMS systems.
Measurement and deconvolution of the optical signals in these FBG sensor enable identification of electrochemically driven thermal and pressure variations linked to parasitic (electro-)chemical reactions (e.g., SEI) and structural changes due to Na extraction/insertion. However, it is worth recalling that SEI formation, which shapes a cell’s lifetime, is a critical and expensive step in cell manufacturing, rendering the protocols as trade secrets among the manufacturers. Increasing knowledge about SEI growth/formation is therefore a need that could be fulfilled with deeper insights into its (electro-)chemical origins. Collecting thermal events is solely important if their relationship to chemical events can be unfolded by tracking the associated heat. Moreover, knowing in real time the exact heat generated and dissipated from the cell is critical for improving the thermal management of batteries. Thus, the need to establish a viable and scalable method for operando calorimetry is clear.
Converting temperature from FBG into heat generation
Conventional calorimetry has been widely used in the battery field to access information about heat generation and dissipation with the drawback of being cumbersome space-wise and low-throughput, in a situation quite different from batteries in real-world operating conditions. Hence, we explore the feasibility of using optical sensing to perform operando calorimetry on a NVPF/HC 18650 cell by employing three FBGs (with rapid and accurate temperature determination, ± 0.1 °C), that are placed inside the cell, on the cell surface, and in the air-ambient environment (see Fig. 3b). Temperature variations of the FBG sensors are monitored during cell cycling with the collected data being transformed into heat using simplified thermal-circuit models. Various models have been proposed to emulate the thermal behaviours of batteries with different degrees of diversity where capacitances feature heat capacities and resistances feature inverse of
9
heat transfer coefficients. We used, as a start, a simple zero-dimensional model (Fig. 3c, inset) capable of being extended to multiple dimensions for heat mapping. Within this model, the rate of heat generated by the cell, , is given by
(1) where M, CP, and T represent the mass, specific heat capacity and spatially averaged temperature of the
cell (see Supplementary Note 1), respectively, with t being the time and being the heat flow rate from the cell to the ambient. Note that this equation can also be derived from the energy balance for battery.20
According to this model, the inside and outside heat flow rate conservation equations are
Tsurface Tambient Rout or
Tinternal Tsurface
Rin (2)
where Tsurface, Tinternal, and Tambient are the temperatures at the surface, the interior of the cell, and the ambient environment, respectively, is the equivalent thermal resistance between the cell surface and the ambient, and is the equivalent thermal resistance between the centre and surface of the cell. The temperatures Tinternal, Tsurface, and Tambient are experimentally obtained via the three SMF-FBGs placed accordingly (Fig. 3c). Nevertheless, three parameters , Rout, and Rin are still missing in order to quantify . To determine them, we have used a method, as previously reported by Forgez et al,13 which
consists of sending an alternate galvanostatic pulse to the cell (i.e., a known ∮ while monitoring the temperature as a function of time (Supplementary Fig. 6). Two time-temperature variation regimes denoted as “transient state” and “steady state” are observed and from which Rout and Rin can be extracted according to equation (2) and can be determined by recasting equation (1) as
, respectively. Bearing in mind that these values are to some extent temperature-dependent, a calibration curve was previously established for better accuracy. Having defined these parameters, the temperatures of NVPF/HC 18650 cells can be used to derive the variations of both and under any electrochemical conditions, as opposed to conventional isothermal calorimetry in which the accumulated heat is neglected ( ), placing constraints on cell size and operating current to ensure cell temperature across the cell is uniform.21 To examine the validity of this assumption, Fig. 3d shows and for a NVPF/HC
18650 cell discharged at C/10 and 1 C (see Supplementary Fig. 7 for other C-rates). Remarkably, the results reported in Fig. 3d indicate that is similar to at C/10 (left) but markedly larger than at 1 C (right). This insight illustrates that the cell’s accumulated heat ( ), neglected in conventional isothermal calorimetry, can be an important part of the energy stored within a cell, particularly at high rates ( at 1 C is one order magnitude higher than that at C/10, Fig. 3d). Hence, the need to consider its contribution is clear when cells are used under aggressive power/rate conditions and the importance of fully accessing by optical sensing is evident. Shortly, in doing calorimetry via optical fibers, we are no longer restricted to the constraints of isothermal calorimetry with regard to cell size and current conditions, (e.g., C/20),22 at the expense ofmore
parameters to be determined, but with the overall gain of being able to monitor the heat production of 18650 cells in real operation and to decouple the heat transfer from the heat accumulation.
10
Fig. 3e (blue) shows the evolution of , as deduced from optical sensing, when a NVPF/HC 18650 cell is charged at C/10 in a 40 oC oven. Note the presence of two major thermal events occurring at the NVPF
structural transition and towards the end of charge. To validate and verify our measurements of the heat deduced from optical sensing, isothermal calorimetry at 40 °C on a NVPF/HC coin cell (~2 mAh) was also performed (an identical 18650 cell (~800 mAh) could not be tested due to the limited size of the isothermal calorimetry chamber). The obtained shape of heat rate from isothermal calorimetry is shown in Fig. 3e, (orange dash). It mirrors the one obtained by optical sensing, but with some noticeable differences in resolution and magnitude. To further establish the relevance of determining heat rate by optical sensing, measurements were taken of the lost electrical work (∮ ) per cycle (from current-potential measurements on coin and 18650 cells), and of the waste heat (∮ ) per cycle (as deduced by isothermal calorimetry and optical sensing) at various C-rates, see the methodology in Supplementary Fig. 8. Remarkably, as shown in Fig. 3f, the lost electrical work and waste heat values neatly superimpose for both coin and 18650 cells, but the values obtained by optical sensing of 18650 designs are lower. This, together with the observed difference in Fig. 3e, is simply related to matters of cell configuration, with a larger polarization and lower rate capability for coin cells as compared to 18650 ones (Supplementary Fig. 9).
11
Fig. 3 | Methodology of the optical sensing calorimetry and its benchmark with isothermal calorimetry. a, The measured maximal temperature with the C-rates in a 25 oC oven. Inset: the schematic showing that
two positions were measured, namely, the inside and the surface of the cell. The maximal temperatures shown were obtained by an average of at least three cycles. For those C-rates higher than 1 C, the charge was done at C/2 to make sure the full charge of the cell, because the highest temperatures were always recorded at the end of discharge. b, Schematic showing the setup of the optical sensing calorimetry. c, The thermal equivalent circuit (inset) and the measured variables including the internal (Tinternal), the surface (Tsurface), and the ambient (Tambient) temperatures as a function of time at a discharge rate of 1 C. d, The comparison between the heat flow rate ( , heat flow only) and the rate of heat generation ( , heat flow + accumulated heat) by optical sensing at C/10 (left) and 1 C (right) of a NVPF/HC 18650 cell with NP30 in a
12
40 oC oven. e, The comparison of rate of heat generation ( ) from the optical fiber method (18650, blue solid
lines) and the isothermal calorimetry (coin cell, orange dash lines) during the charge at C/10. f, Comparison of waste heat (triangle) and lost electrical work (circle) between the optical fiber method (18650, blue) and the isothermal calorimetry (coin cell, orange) with dash lines as guide to the eyes. Chemistry: NVPF/HC, electrolyte: NP30. Unless specified, the oven temperature was 40 oC, since the isothermal calorimetry
measurements were performed at 40 oC.
To escape from this configurational burden, we further consider the enthalpy potential, , which is intrinsic to the cell chemistry:21,23
(3) where is the voltage, is the current, and is the rate of heat generation measured by either isothermal
calorimetry or optical sensing method. For comparison, they are plotted against the cell capacity in Fig. 4, (see Supplementary Fig. 10 for more C-rates). Such enthalpy potentials deduced at a low C-rate, C/10, either by isothermal calorimetry for coin cells or by optical sensing for 18650 cells were found to agree nicely. Altogether, these results provide confidence that optical sensing method can be used in place of a conventional calorimeter. Further exploring the profiles for the optical sensing, we note their constancy regardless of the C-rate (Supplementary Fig. 10) and moreover that the traces nearly overlap with each other even at high C-rates in the case of optical sensing, indicative of a largely path-independent process of the NVPF/HC chemistry.23 However, this overlap does not hold true above a C-rate of ~C/2 for isothermal
calorimetry, which is possibly correlated with the accumulated heat which is not considered in the method. The importance of neglecting the accumulated heat is recognized by considering the enthalpy change, ∆ , through a cycle which can be deduced from the integration of against the capacity over the charge/discharge processes that gives:
∆ (4)
where is the enthalpy of the cell, and is the time. This integration for isothermal calorimetry gives a ∆ of 15 mWh g-1NVPF at 1 C, which is somewhat inconsistent. Indeed, for an highly stable and reversible system alike NVPF/HC, the ∆ should be very close to zero, because the enthalpy of the system should not change over one charge/discharge cycle. On the contrary, considering the accumulated heat by optical sensing method, the deduced enthalpy change of -1 mWh g-1NVPF at 1 C is more reasonable, confirming also the risk of neglecting the accumulated heat in the calculation of the cell enthalpy in isothermal calorimetry measurements.
13
Fig. 4 | Enthalpy potentials. The enthalpy potentials of NVPF/HC with NP30 at C/10 (top) and 1 C (bottom)
derived from the isothermal calorimetry (coin cell, left, orange) and optical sensing method (18650, right, blue). The enthalpy potential and enthalpy change were computed by equations (3) and (4), respectively. The oven temperature and the isothermal condition were set at 40 oC.
Unravelling chemical origins of heat peaks during cycling
Accurate measurement of internal temperature and rate of heat generation of the cell have direct benefits in applications for the enthalpy analysis and battery management systems. However, the chemical origins behind the shape/magnitude of these thermal data remain a pending question and solving this mystery is key to opening the black box of thermal events happening inside a battery. Consequently, we further break down the calculated total rate of heat generation ( , equation 1) into its three constitutive components: the irreversible heat generation rate due to overpotential of the main reaction, the parasitic heat generation rate, and the reversible term, related to the entropy of the main reaction, according to the energy balance equation in which heat of mixing is neglected:21-23
(5)
In equation (5), I is the current, V is the measured voltage, is the equilibrium potential, is the parasitic heat rate, T is the temperature of the cell, is the number of electrons involved in the electrochemical reaction, is the Faraday’s constant, and are the rates of change of the entropy per site with respect
to the fraction of filled sites of the positive and negative electrodes, respectively.21-23 The first term [ ]
0 20 40 60 80 100 2.0 2.5 3.0 3.5 4.0 4.5 0 20 40 60 80 100 2.0 2.5 3.0 3.5 4.0 4.5 E n thalpy pot ent ial ( V ) H = 15 mWh g-1 NVPF E n th alpy pot ent ial ( V )
1C
Capacity (mAh g-1NVPF) H = -1 mWh g-1 NVPF1C
Isothermal calorimetry Optical sensing
C/10
C/10
Solid: charge Dash: discharge H = 4 mWh g-1 NVPF H = 0 mWh g -1 NVPF14
is the heat generation related to the overpotential of the cell. The second term, , is the parasitic heat generation rate, which corresponds to reactions other than insertion, but bearing in mind that NVPF/HC cells shows excellent capacity retention, indicative of limited parasitic reactions, this term will not be considered further except during formation cycles. The third and last term ( , equal to -TdS/dt with S and
t being the entropy of cell and time, respectively) corresponds to the reversible heat exchange from entropy
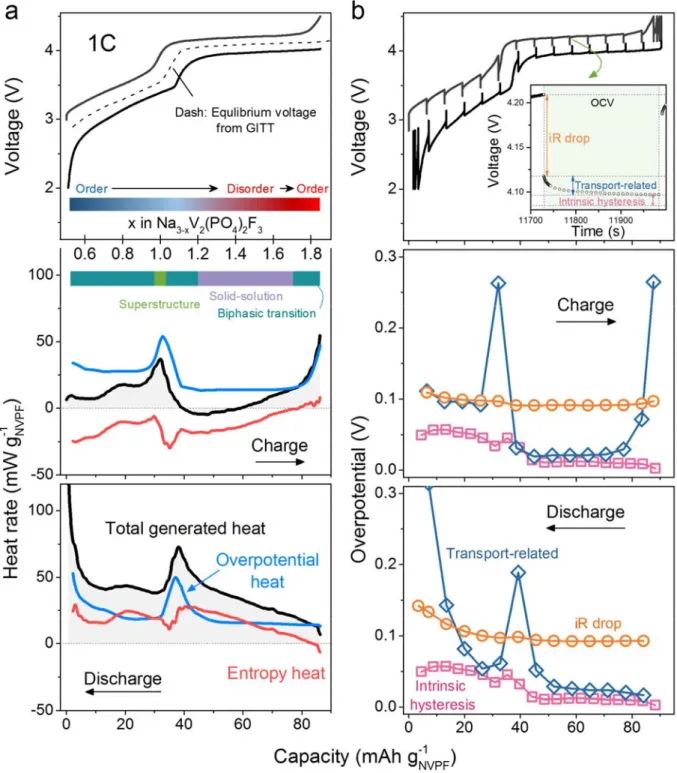
transfer. In practice, the irreversible heat can be calculated with respect to the equilibrium potential estimated by the galvanostatic intermittent titration technique (GITT) which additionally can provide information about ohmic resistance (iR) drop, transport-related overpotential, and intrinsic hysteresis by monitoring the voltage decay over short, medium and long term relaxation time, respectively.24 Entropy heat was calculated by
subtracting the irreversible heat from the rate of heat generation.
Fig. 5a shows the capacity-dependent total heat generation rate in an NVPF/HC cell together with its partition into overpotential and entropy heats. Both show the presence of two main peaks, with one located near the middle of the charge and discharge and the other one present at the end of charge and discharge. The corresponding GITT data with the independent contributions of the iR drop, transport-related overpotential, and intrinsic hysteresis to the overpotential is shown on Fig. 5b. Interestingly, the overpotential profile attributed to the transport component closely mirrors the heat rate associated with the overpotential and entropy terms in Fig. 5a, with namely, the presence of two peaks at identical positions in capacity. This suggests that the large amount of heat release at the end of charge and at the end of discharge stems primarily from diffusion limitations (e.g., sluggish diffusion of Na). Such a phenomenon can be fundamentally explained by a mathematical model describing the transports by Fick’s law,25 although we are aware of other
possible minor contributions such as heat of mixing which could also add to the irreversible heat (due to concentration gradients, for example).21 Furthermore, the overpotential heat peak detected by optical sensing
at the single composition Na2V2(PO4)2F3 which separates two biphasic domains (which is not due to the HC
electrode whose voltage varies continuously with potential; see Supplementary Fig. 11) is also readily explained on the basis of the sodium diffusion argument, similar to the end of charge and end of discharge.
Aside from the primary contribution of the overpotential heat to the overall heat generated by the cell, entropy heat was also monitored as another essential component (Fig. 5a). The entropy change of NVPF/HC reaction in the 18650 cell was measured both by the potentiometric method (Supplementary Note 2 and Supplementary Fig. 12,13) and from the calorimetric data inferred from the optical fiber sensors. The results are consistent between both methods, with those obtained by optical sensing conveying clear fidelity enhancement, in addition to the obvious improvement in data collection efficiency (Supplementary Fig. 14). Note that the entropy heat (Fig. 5a) is mostly negative during the charge (absorbing heat), but positive during the discharge (releasing heat), with a more pronounced variation on the vicinity of the NVPF phase transition at which there is also an overpotential heat contribution attributed to sodium diffusion. Bearing in mind that entropy is associated with structural disorder, the appearance of a peak in the entropy heat profile near the phase transition pertaining to NVPF is not surprising. As seen in Supplementary Fig. S15, previous in situ X-ray studies on Na3-xV2(PO4)2F3 in which Na+ is well ordered (x=0) have shown that upon Na+ removal the
structure undergoes multiphase transitions and becomes disordered which could explain the negative entropy heat during the charge, while a transient phase is formed near half capacity (x=1.0) showing a superstructure of relatively high Na+ ordering and thus a peak in the entropy heat.26 Finally, a new phase with
15
the end of charge. Obviously, further analysis using statistical mechanics and lattice gas model could be used here to better correlate the Na structural ordering-disordering in NVPF with the entropy heat profile curve but it is beyond the scope of this work.27
Fig. 5 | Decomposing the heat contributions at 1 C. a, Capacity-dependent total generated heat ( , black)
16
( , red). The inset shows the degree of disordering and the phase
transition of NVPF along the charge.26 b, Capacity-dependent overpotentials from the GITT result, including iR drop (orange), transport-related overpotential (blue), and intrinsic hysteresis (purple). The inset in the
voltage panel shows the three stages upon the relaxation in GITT, where the above three components were measured.
Spotting the SEI
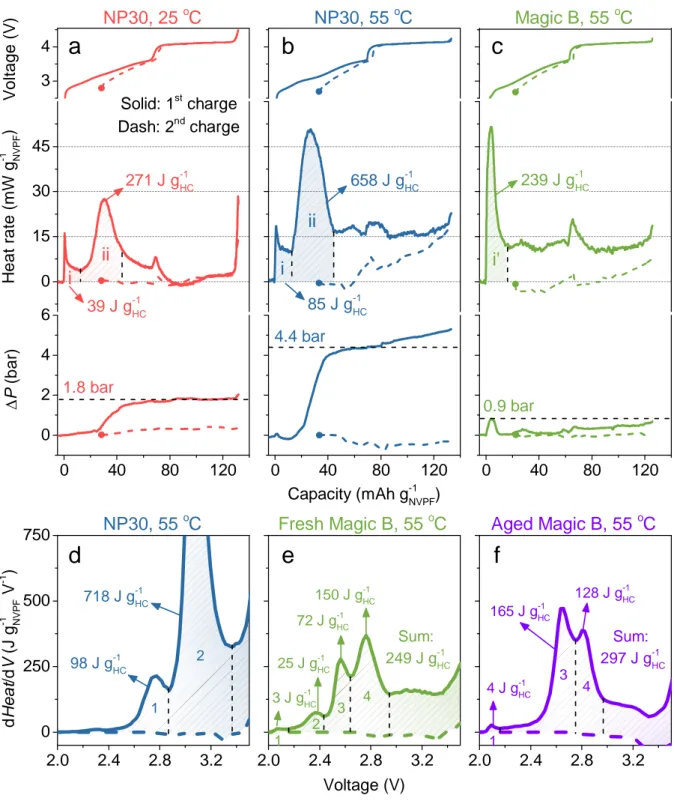
Bearing in mind the critical importance of understanding and controlling SEI formation since it mainly dictates the battery lifetime, we return to the optical sensor signals (T and P, conjointly) to further explore the selectivity and sensitivity of our detection technique for this purpose. Having the ability to derive the heat associated with thermal events (i.e., operando calorimetry), in addition to quantitatively measure the pressure, we can now evaluate the SEI heat of formation as an additional metrics. Several electrolyte formulations, differing by the nature of salt-solvent composition and additives, were tested at different temperatures and benchmarked against each other in terms of heat and pressure associated with their SEI formation. Fig. 6 shows the variation of the optical sensing signals, now transformed to heat (J g-1HC) and pressure (bar) collected during the first and second charges of NVPF/HC 18650 cells with 1 M NaPF6 in EC-DMC (NP30) electrolyte, at
25°C (Fig. 6a) and 55°C (Fig. 6b). Similar cells using our in-house developed electrolyte (NP30 + several additives, including vinylene carbonate (VC), sodium (oxalate) difluoro borate (NaODFB), and tris (trimethylsilyl) phosphite (TMSPi)) denoted as "Magic B" were similarly tested at 55°C for comparison (Fig. 6c).
Note for NP30 electrolyte, a heat of formation is at least twice (658 vs. 271 J g-1HC) at 55 °C than at 25 °C which is accompanied by a two-fold increase in pressure indicative of substantial electrolyte decomposition of NP30 with increasing temperature. This increase in pressure, in light of numerous studies on SEI, is simply associated to the generation of CO, C2H4 or C2H6 and CO2 gases due to the
electrochemical-driven reduction of EC and DMC on carbon electrodes.28 These thermal and pressure behaviors are
drastically different for “Magic B” that shows a much decreased SEI-associated formation heat at 55 °C (239 J g-1HC), which is solely ~1/3 of that for NP30 at 55 °C, with an important distinction that it occurs through just a single formation event (as compared to two for NP30). Impressively, the minor pressure rise (Fig. 6c) of “Magic B” at 55 °C suggests a better mechanical environment for the battery electrodes and packaging after SEI formation, compared to the additive-free alternatives. Worth noting also that the majority of the SEI formation occurs mainly at the beginning of charge process for “Magic B” alike what is commonly seen in conventional Li-ion cells while it happens well into the charge for cells having NP30.29 This has to link with
the electrochemical stability window of the additives. NaODFB was demonstrated elsewhere to be reduced at a higher potential vs. Na+/Na0 in “Magic B” than EC/DMC in NP30 electrolyte, hence explaining the need
of a larger capacity to trigger the SEI formation in NP30.30 Moreover, it is because NaODFB mainly controls
the SEI formation in “Magic B” that we observe a single thermal event as compared to two for the SEI formation in NP30 that results from EC/DMC reduction, hence confirming the well-known and crucial role of selecting the proper additives to tune the SEI formation. Altogether, these results are in line with our early cyclic voltammetry study, which shows the SEI forming at 55 °C on the carbon electrode in presence of “Magic B” was the most stable in agreement with the best high temperature performances in terms of cyclability and self-discharge at 55 °C.30
To interrogate the chemistry underlying the thermal events pertaining to the SEI formation we plot (Figs. 6d,e) the corresponding derivative curves of heat with respect to voltage (dHeat/dV) at 55°C for both
17
NP30 and “Magic B”-based cells. Strikingly, these derivative plots show that the single thermal event triggered by the reduction of additives in “Magic B” electrolyte (Fig. 6c) is now well resolved in four different peaks (Fig. 6e) while the two thermal peaks pertaining to NP30 are not affected by this mathematical derivation (Fig. 6b vs. Fig. 6d). This peak splitting is not an artefact since derivative curves collected on three identical NVPF/“Magic B”/HC 18650 cells were found to superimpose with each other (Supplementary Fig. S16), but rather indicative of a complex electrochemical decomposition of NaODFB that enlists cascade reactional steps. This is in line with literature reports, which describe the reduction of DFOB− anions, through a stepwise
elimination of F− anions leading to the formation of a LiF-based SEI together with the formation of radicals,
which can react with carbonates.31 This complexity is here further enhanced by the synergetic
electrochemical reactivity of the other VC and TMSPi additives with the latter being a F- scavenger to regulate
the Li(Na)F content within the SEI.30,32 Further exploiting our approach, we decided to collect the dHeat/dV
curves at 55 °C for NVPF/HC 18650 cells using a fresh and an aged (i.e., stored for over a week) “Magic B” electrolyte that will deteriorate the battery overall performances. Fig. 6e,f show distinct differences in the number of peaks but more so in the relative amplitude of these peaks with the magnitude of peak 3 taking over those of peaks 2 and 4. In addition to the aging of TMSPi with PF6-,32 and given the fact that VC is not
highly stable since it can self-polymerize because of the unsaturated carbon-carbon double bond, one could for instance ascribe the increase in magnitude of the peak at 2.63 V to the polymerized products from VC. Altogether these results strongly suggest that dHeat/dV curves can be used as a fingerprint to quantify electrolyte quality and evolution. Improvements to the present work are immediately apparent and range from the testing of various additives to alternative formatting protocols enlisting temperature, charging rates and pulsed currents (Supplementary Fig. S17). Moreover, we readily acknowledge a risk of over-simplification here: quantifiable changes in the full cell are being solely attributed to the SEI formation at the surface of the negative electrode. We are well aware that the positive electrode/electrolyte interface also facilitates a range of faradaic/chemical activity during cell operation (although arguably to a lesser extent). Nevertheless, decoupling the electrochemical reactions at both of these interfaces is a remaining challenge that is well-suited to be addressed by the operando optical sensing method and protocol established here and future studies are aimed precisely at this objective.
To probe further our analytical approach, we explore the 1 M NaPF6/DMC based electrolyte identified
as the worst one for the NVPF/HC chemistry. We found (Supplementary Fig. 18) that the parasitic heat remains large (mostly >30 mW g-1NVPF) throughout the first charge and indicates the inability of forming a protective SEI, presumably owing to the high solubility of DMC-reduced species such as sodium-methyl carbonate (C2H3O3- Na+) and sodium methoxide (CH3O- Na+) together with associated gassing as previously
reported.28 Lastly, in the sake of generalizing this approach, we extended to Li-ion technology by exploring
home-made LiNi1/3Mn1/3Co1/3O2/graphite (NMC(111)/C) 18650 cells cycled at C/5 (Supplementary Fig. 18).
Unlike to NVPF/HC chemistry, a single heat peak (169 J g-1C) is seen at the beginning of charge in conjunction with a fast ΔP (~4 bar) increase, supporting the idea that salt, solvent, and electrode chemistries are all delicately intertwined. In short, these results establish the feasibility of using optical sensing for benchmarking/identifying suitable electrolyte formulas and defining optimized battery production protocols.
18
Fig. 6 | Quantifying the SEI formation. a-c, The temporal voltage (top), rate of heat generation ( , middle),
and pressure change ( , bottom) of NVPF/HC during the first (solid) and second (dash, solid circle at the first point) charges cycling at C/10 under the conditions including NP30 in a 25 oC oven (red; a), NP30 in a
55 oC oven (blue; b), and “Magic B” electrolyte in a 55 oC oven (green; c). Note the pressure change of the
second charge was relative to the beginning of the second charge, see the full pressure profiles in Supplementary Fig. 3. The integrated heats of peaks “i” and “ii” were shown for the quantified comparison.
3 4 0 15 30 45 0 40 80 120 0 2 4 6 0 40 80 120 0 40 80 120 2.0 2.4 2.8 3.2 0 250 500 750 2.0 2.4 2.8 3.2 2.0 2.4 2.8 3.2
c
b
V o lt a ge ( V ) Solid: 1st charge Dash: 2nd chargea
ii H e a t ra te (mW g -1 NV P F ) i 0.9 bar 39 J g-1HC P ( bar ) 271 J g-1HC 1.8 bar i ii 85 J g-1HC Capacity (mAh g-1NVPF) 658 J g-1HC 4.4 bar Magic B, 55 oC NP30, 55 oC 239 J g-1HC i' NP30, 25 oC 2 Aged Magic B, 55 oC Fresh Magic B, 55 oC d H eat /d V (J g -1 NVP F V -1 ) 1 Sum: 297 J g-1HC 3 NP30, 55 oC 1 2 3 Voltage (V)f
e
d
150 J g-1HC 72 J g-1HC 25 J g-1HC 3 J g-1HC 718 J g-1HC 98 J g-1HC Sum: 249 J g-1HC 4 1 4 J g-1HC 4 128 J g-1HC 165 J g-1HC19
The voltage window of 55 oC was set as 2.0-4.25 V to avoid an overcharge plateau near 4.5 V. Note that the
heat during the first charge never come back to zero at 55 °C with therefore a residual heat for “Magic B” smaller than the one for NP30. More importantly, the heat measured through the second charge is nearly zero, implying that the SEI formation is a process lasting through the complete first charge. Turning to the pressure, in contrast to NP30 that shows a step increase, only one peak exists for “Magic B”. It suggests that the gaseous species are generated in small amount for “Magic B” electrolyte, therefore which either solubilize into the electrolytes or undergo chemical reactions forming solid species (e.g., Na2CO3… ).33 Afterwards, the
pressure barely increases with a noticeable increase towards the end of charge that could stem from the gassing associated with the oxidation of NaODFB added in “Magic B” electrolyte.34 d-f, The derivatives of
heat with respect to voltage (dHeat/dV) of NVPF/HC 18650 cells in a 55 oC oven during the first (solid) and
second (dash) charges cycling at C/10 under the conditions including NP30 (blue; d), fresh “Magic B” electrolyte (green; e), and aged “Magic B” electrolyte (purple; f). The integrated heats were marked.
Conclusions/Outlook
The above results illustrate the feasibility of using optical fibers, the basic component of today’s highway of communications, to instantly monitor the operation of commercial 18650 cells and pouch cells (see Supplementary Fig. 19) under real world conditions and to diagnose battery malfunctioning at the cell level. Using fiber Bragg grating (FBG) sensors, hosted either by conventional single mode or microstructured fibers and inserted into the battery without interfering with the cell chemistry, we demonstrate the capability of simultaneously measuring (and deconvoluting) its temperature and pressure with great accuracy, an achievement previously unattained by early efforts towards optical sensing of electrochemical cells. Moreover, due to their small size and non-metallic character, fibers enable the non-destructive insertion of an optical sensing element into the battery package without the risk of introducing electromagnetic interference. The possibility of hosting multiple FBGs in single fiber segments and within a narrow space offers further opportunities for cell temperature imaging and detecting ‘hot spots’ near cell terminals.
Our study also highlights the opportunity to instantly convert thermal events to quantifiable heat events, henceforth proposing the concept of optical fiber operando calorimetry and shows that this calorimeter can probe the heat capacity contribution to the overall heat generated by the cell, which is not accessible with conventional isothermal calorimeters. Moreover, we demonstrate its potential in assessing thermal events, together with their associated heats, taking place inside a battery, starting from the first formation cycle and onward, enabling the tracking of SEI formation and cell lifetime. By monitoring the heat associated with the SEI formation for various electrolyte combinations, of known performances with respect to the Na-ion NVPF/HC chemistry, our work reveals single vs. two-step (electro-)chemical formation, together with delays in the SEI onset by simply collecting two-cycle data. Besides Na-ion chemistries we have successfully tracked the SEI formation in commercial 18650 Li-ion NMC(111)/C cells (serving as today’s standard/benchmark) as well and the monitoring of Li-rich Li2Ru0.75Sn0.25O3 /graphite (LRSO/C) 18650 cells
upon cycling (see Supplementary Fig. 20). Therefore, the as-developed optical fiber method paves a path for rapid diagnostic analysis of new electrolyte compositions at the scientific level and the establishment of specific protocols to achieve optimized SEI formation at the manufacturing level.
20
The sensing of chemical events with optical fibers extends much wider than decoding the SEI growth. We show that it can also detect Na-driven structural transitions occurring at the electrodes upon cycling and more importantly access (via heat evolution and its deconvolution) several key thermodynamic parameters such as overpotential heat, enthalpy potential ( ), and entropy, that were previously used to track ageing in non-commercial coin cells.35 Moreover, such information may help the design of advanced heating/cooling
systems with the proper temperature-triggered thresholds to prevent disastrous thermal events and enhance the cell performance in terms of energy, power, safety, etc. Equally, real-time monitoring of the internal pressure provides an effective pre-warning prior to gas release events which may originate from unwanted chemical reactions, as demonstrated in Na-ion cells for which we successfully anticipated the triggering of a current interruption device (CID) that is employed in the cell for safety reasons (see Supplementary Fig. 21). Shortly, the insights and metrics provided by this work will help bring the development of improved battery thermal management system.
Existing non-intrusive electrochemical monitoring methods are mostly dedicated to tracking evolution of coulombic and energy inefficiencies. Measurements of coulombic inefficiencies can provide information on change in cell balancing during cycling due to electrons involved in side reactions and the available amount of active materials (e.g., measuring coulombs by precision coulometry). On the other hand, tracking energy inefficiencies provides information regarding contributions to overpotential in the cell (e.g., using electrochemical impedance spectroscopy or pulse methods), which can reveal detrimental effects of aging such as increased contact resistance due to material/electrode delamination, passive/insulating film growth due to side reactions, etc. In any case, such methods are all limited to interpretations of the electrical signals at the device terminals. The optical sensing work presented here demonstrates the power of our complementary approach, as the additional pressure and thermal data are rich with valuable information that is otherwise lost with traditional methods and is certain to be integral in future battery systems.
Overall, the convergence of battery science and optical sensor engineering opens up unprecedented opportunities for battery diagnoses beyond what is done today. Moreover, the intrinsic chemical, mechanical and thermal robustness of FBG sensors suggests that the operando techniques explored here can be extended to other energy storage devices (such as fuel cells and supercapacitors),36 as well as other
important applications (such as catalysis and water-splitting), to achieve fundamental advancements by academia and industry alike. A near-term strategy for implementation yields opportunities for integration into management systems for above-mentioned devices, development of economical binary interrogators, and the adaptation of the FBG sensors to targeted system environments, in terms of manufacturing constraints. Thus, we hope that this topic will rapidly grow, develop, and embrace scientists and engineers from a wide range of disciplines and fields.
Methods
Preparation of cells. The NVPF/HC 18650 cells were obtained from TIAMAT company. Cells were
hermetically sealed with and without electrolyte filling. Those with electrolyte filling were used as the control group to examine the fibers’ impact on electrochemistry, while those without electrolytes were taken for the fiber insertion as detailed later. The LiNi1/3Mn1/3Co1/3O2 /graphite (NMC(111)/C) and Li-rich Li2Ru0.75Sn0.25O3
21
France. The loadings of NMC(111) were 27.9 mg cm-2 and 14.7 g, while the ones of graphite were 12.1 mg
cm-2 and 7.3 g. Those electrodes were prepared by the slurry coating in a mass ratio of 92/4/4 for the
formulation (active material/carbon 45/polyvinylidene fluoride (PVDF)) in N-methyl-2-pyrrolidone (NMP) solvent. The current collectors for NMC(111) and graphite were Al and Cu foils, respectively. The dry (no electrolyte) NMC/C pouch cells were fabricated by Li-FUN technology, China. The coin cells of NVPF/HC were prepared in a 2032 format with two glass fiber separators (GF/D, Whatman) in an Ar-filled glove box. The electrodes were made as above with active material ratios of 92% and 94% for NVPF and HC, respectively. The current collectors were Al foils for both NVPF and HC. The typical loadings of NVPF and HC were 14.3 and 6.9 mg cm-2, respectively. The diameter of the electrodes was 1.27 cm. All electrodes
were dried overnight in the Büchi oven under vacuum at 80 oC before transfer into the glove box.
Electrolyte preparation. The composition of NP30 was 1 M NaPF6 (Stella, Japan) in EC (Mitsubishi
chemical, Japan) /DMC (Sigma Aldrich, >99%, anhydrous, or BASF, USA) (v.:v.=1:1). 1M NaPF6 in DMC
was also used to see the effect of cyclic co-solvent. The one with additives was NP30 with the addition of 1.25, 2.5, and 7.5 wt.% of NaODFB (as synthesized in our group),37 TMSPi (TCI Chemicals), and VC (Sigma),
respectively. The electrolyte composition for NMC(111)/C and LRSO/C was 1M LiPF6 in EC/DMC (v.:v.=1:1,
shorted as LP30, Solvionic, France).
Fabrication of microstructured optical fiber. The single-ring suspended fiber was fabricated using the
stack-and-draw method previously reported by Htein et al.38 The first step consists of the selection of an outer
tube with inner/outer diameter (ID/OD) of 14/16 mm. A germanium-doped core rod with a diameter of 1 mm was suspended using a supporting tube with ID/OD of 5.9/6.6 mm. Furthermore, note that five additional tubes with the same dimension than the supporting tube but shorter in length were stacked at the end of the preform to support the structure and center the core rod. The preform was then drawn into fiber using our custom-made drawing tower without applying pressure, at a temperature of ~1920 °C and fiber tension below 0.7 N. In addition to the core and cladding, note that the acrylate coating is easily dissolved in LP30. Consequently, the polyimide-coated optical fiber was selected for the internal FBGs.
Fabrication of MOF-FBG. Gratings were inscribed in the MOF using 248 nm excimer laser (COHERENT
BraggStar M), and phase mask with pitch of 1072.33 nm. The energy of the excimer laser was set to 70 mJ, the repetition rate was set to 20 Hz, the scan velocity to 0.05 mm/s, and an apodization function was used to ensure good quality gratings. All the FBGs presented in this manuscript are 6 mm long, with Bragg wavelength centered around 1555 nm.
Optical measurement. The optical signals were acquired by the interrogators, including FBGuard1550
(Safibra, Czech), SM125, and LUNA Si255 (Micron Optics, USA). According to the specifications, the wavelength accuracy/resolution of these three interrogators is 1 pm. The single and multiplexed SMF-FBGs were purchased from IDIL (France) and SAMYON (China). They were calibrated before the usage. The sampling period of the interrogator was set to be one second.
Calibration of FBGs. The temperature calibration of FBGs was conducted in the ovens (IPP55 and IPP110,
Mermmet, Germany) from 10 to 60 oC with a step of 10 oC. The pressure sensitivity of the fiber was recorded
using a hydrostatic pressure sensing experiment. One end of the MOF was spliced to a conventional SMF fiber whilst the other end was sealed by applying a fusion arc with the fiber splicer. The pressure chamber is 900 mm long with an inner diameter of 22 mm. The pressure was recorded from 0 MPa to 5 MPa in steps of
22
0.5 MPa using a pressure gauge (CONST 211) and the shift in the Bragg wavelength was monitored using an interrogator Si155 (Micron Optics, USA). The strain sensitivity measurements were performed using two translation stages (Thorlabs, MAX 350/M), and both ends of the FBG were glued onto the stages, with a distance of 10 mm between the gluing points. One stage remained static, while the other one was moved by step of 2 µm (200 µε). The strain was maintained 30 seconds at each level, and tests were performed in the range 0 to 2000 µε. For all the characterization measurements presented, tests were performed on at least three FBGs and repeated three times, except for the strain measurement only one FBG was used.
Insertion of fibers into the 18650s and pouch cells. An 18-gauge needle as used and pre-bonded with
the optical fiber for future recovery of FBGs. In the combination of SMF-FBG and MOF-FBG, one SMF-FBG and one MOF-FBG were aligned in parallel during the bonding with the needle to make sure that they would sense the same position (Supplementary Fig. 2b). A 0.8 mm diameter hole was drilled on the negative pole of the dry, hermetically sealed cells without electrolyte from TIAMAT. The position was selected according to the welding point of the negative current collector, which was close to the center of the negative pole. This selection was done to avoid the destruction of the jelly roll and to prevent the strain interaction between FBGs and jelly roll. The drilled cells were then dried overnight in a Büchi oven under vacuum at 80 oC prior to
entering the glove box. Inside the glove box, the 18650s were first filled with 5.5 mL of electrolyte. Afterward, the FBGs were inserted into the central void of the jelly roll, and then the interface between needle and 18650 was sealed with epoxy that was cured for 24 hours; all processes being done in a glove box. As for pouch cells, the optical fiber hosting the FBG was first positioned between the laminates, and the electrolyte was added prior to hermetically sealing the pouch with a pouch cell sealer (MTI, USA) in a glove box.
Electrochemical tests. The 18650 and coin cells were tested by BCS-810, BCS-815, or MPG2 potentiostat
(Bio-Logic, France) in the temperature-controlled chambers. The C-rates were calculated based on the active materials of positive electrodes (NVPF or NMC111). The 1 Cs of NVPF and NMC111 are 128 and 279 mA g-1, respectively. The voltage window for NVPF/HC was 2.0-4.5 V, unless specified. The relaxation criteria
for GITT are 3.6 mV h-1 or 4 hours.
Isothermal calorimetry. Cells were inserted into a TAM III Microcalorimeter (TA instruments, stability ±
0.0001 °C, accuracy ± 1 µW, precision ± 1 nW) kept at a constant temperature of 40 °C (isothermal mode). Cells were then connected to a Maccor 4000 series cycler for electrochemical cycling. Cells were either cycled for three cycles prior to being installed in the calorimeter or freshly assembled, depending on the experiment. Further details on the experimental setup can be found in references.22,39-42 Before cycling, cells
rested at an open-circuit voltage (OCV) in the calorimeter for 24 hours to stabilize the baseline heat flow measurements. While no correction was made to the measured heat flow, all cells showed a low non-zero baseline attributed to parasitic reactions between the electrolyte and electrodes. Cells were cycled at a nominal rate of C/10 for three cycles, with a 4-hour rest at OCV after each half-cycle. Further, after the initial cycles at C/10, the NVPF/HC cells were cycled at increasing rates of C/5, C/2, and 1 C. Each of the cycles at a higher rate also had a 4-hour OCV period after each half-cycle. The baseline drift over the cycling experiments did not exceed ± 0.5 µW. Positive heat flow is defined as heat generated by the cell.
Setup of optical fiber calorimeter. The optical fiber calorimeter was set in a temperature-controlled
chamber with a home-made cabinet to provide a standard thermal environment. Three FBG’s were used with one placed on the cabinet wall (ambient), a second one on the cell surface, and the third inside the cell. Multiple cells can be tested in the same chamber.
23
Note for the thermal calibration. A current pulse of 2 Hz was applied in the cell to generate known heat.13
This frequency was selected according to the literature.13 The current pulse method avoids additional errors
from using constant resistors. Also, entropy terms cancel out over a microcycle, which makes evaluation of straightforward as it directly relates to the product of cell overpotential and current. The calibration was done at the same oven temperature as the charge/discharge experiments to minimize the possible changes of the Rout, Rin, and MCP due to the temperature. Note that Rout is setup-specific rather than cell-specific. Consequently, the calibration was done individually for each experiment.
Data availability
The authors declare that the main data supporting the findings of this study are available within the article and its Supplementary Information files. Extra data are available from the corresponding author upon request.
References
1 Armand, M. & Tarascon, J.-M. Building better batteries. Nature 451, 652-657 (2008).
2 Grey, C. & Tarascon, J.-M. Sustainability and in situ monitoring in battery development. Nat. Mater.
16, 45-56 (2017).
3 Bright, C. T. et al. Remarks on "On reversible lead batteries and their use for electric lighting".
Journal of the Society of Telegraph-Engineers and Electricians 16, 184-218,
doi:10.1049/jste-3.1887.0006 (1887).
4 Lamoureux Jr, T. L. FLIGHT PROOFING TEST REPORT FOR MAIN MISSILE REMOTELY ACTIVATED PRIMARY BATTERY, ESB DWG. NO. 27-06359-3. (GENERAL
DYNAMICS/ASTRONAUTICS SAN DIEGO CA, 1959).
5 Jasinski, L. Rapid battery charging system and method. US patent 3,852,652 (1974).
6 Louli, A., Ellis, L. & Dahn, J. Operando pressure measurements reveal solid electrolyte interphase growth to rank li-ion cell performance. Joule 3, 745-761 (2019).
7 Worrell, C. & Redfern, B. Acoustic emission studies of the breakdown of beta-alumina under conditions of sodium ion transport. J. Mater. Sci. 13, 1515-1520 (1978).
8 Day, R. et al. Differential thermal analysis of Li-ion cells as an effective probe of liquid electrolyte evolution during aging. J. Electrochem. Soc. 162, A2577-A2581 (2015).
9 Keddam, M., Stoynov, Z. & Takenouti, H. Impedance Measurement on Pb/H. sub. 2 SO. sub. 4 Batteries. J. Appl. Electrochem. 7, 539-544 (1977).
10 Liebhart, B., Komsiyska, L. & Endisch, C. Passive impedance spectroscopy for monitoring lithium-ion battery cells during vehicle operatlithium-ion. J. Power Sources 449, 227297 (2020).
11 Schmidt, J. P. et al. Measurement of the internal cell temperature via impedance: Evaluation and application of a new method. J. Power Sources 243, 110-117 (2013).
12 Schmidt, J. P., Manka, D., Klotz, D. & Ivers-Tiffée, E. Investigation of the thermal properties of a Li-ion pouch-cell by electrothermal impedance spectroscopy. J. Power Sources 196, 8140-8146 (2011).
13 Forgez, C., Do, D. V., Friedrich, G., Morcrette, M. & Delacourt, C. Thermal modeling of a cylindrical LiFePO4/graphite lithium-ion battery. J. Power Sources 195, 2961-2968 (2010).
14 Yang, G., Leitão, C., Li, Y., Pinto, J. & Jiang, X. Real-time temperature measurement with fiber Bragg sensors in lithium batteries for safety usage. Measurement 46, 3166-3172 (2013).
24
15 Nascimento, M. et al. Internal strain and temperature discrimination with optical fiber hybrid sensors in Li-ion batteries. J. Power Sources 410, 1-9 (2019).
16 Nascimento, M., Paixão, T., Ferreira, M. S. & Pinto, J. L. Thermal Mapping of a Lithium Polymer Batteries Pack with FBGs Network. Batteries 4, 67 (2018).
17 Ganguli, A. et al. Embedded fiber-optic sensing for accurate internal monitoring of cell state in advanced battery management systems part 2: Internal cell signals and utility for state estimation.
J. Power Sources 341, 474-482 (2017).
18 Cheng, X. & Pecht, M. In situ stress measurement techniques on li-ion battery electrodes: A review. Energies 10, 591 (2017).
19 Peng, J. et al. High precision strain monitoring for lithium ion batteries based on fiber Bragg grating sensors. J. Power Sources 433, 226692 (2019).
20 Bernardi, D., Pawlikowski, E. & Newman, J. A general energy balance for battery systems. J.
Electrochem. Soc. 132, 5-12 (1985).
21 Thomas, K. E. & Newman, J. Thermal modeling of porous insertion electrodes. J. Electrochem.
Soc. 150, A176-A192 (2003).
22 Downie, L., Hyatt, S. & Dahn, J. The Impact of Electrolyte Composition on Parasitic Reactions in Lithium Ion Cells Charged to 4.7 V Determined Using Isothermal Microcalorimetry. J. Electrochem.
Soc. 163, A35-A42 (2016).
23 Assat, G., Glazier, S. L., Delacourt, C. & Tarascon, J.-M. Probing the thermal effects of voltage hysteresis in anionic redox-based lithium-rich cathodes using isothermal calorimetry. Nat. Energy
4, 647-656 (2019).
24 Shen, Z., Cao, L., Rahn, C. D. & Wang, C.-Y. Least squares galvanostatic intermittent titration technique (ls-gitt) for accurate solid phase diffusivity measurement. J. Electrochem. Soc. 160, A1842-A1846 (2013).
25 Srinivasan, V. & Newman, J. Discharge model for the lithium iron-phosphate electrode. J.
Electrochem. Soc. 151, A1517-A1529 (2004).
26 Bianchini, M. et al. Comprehensive investigation of the Na3V2 (PO4) 2F3–NaV2 (PO4) 2F3 system by operando high resolution synchrotron X-ray diffraction. Chem. Mater. 27, 3009-3020 (2015). 27 Berlinsky, A., Unruh, W., McKinnon, W. & Haering, R. Theory of lithium ordering in LixTiS2. Solid
State Commun. 31, 135-138 (1979).
28 Yan, G. et al. Assessment of the electrochemical stability of carbonate-based electrolytes in Na-ion batteries. J. Electrochem. Soc. 165, A1222-A1230 (2018).
29 Hall, D. S., Glazier, S. L. & Dahn, J. R. Isothermal microcalorimetry as a tool to study solid-electrolyte interphase formation in lithium-ion cells. Phys. Chem. Chem. Phys. 18, 11383-11390, doi:10.1039/c6cp01309k (2016).
30 Cometto, C., Yan, G., Mariyappan, S. & Tarascon, J.-M. Means of Using Cyclic Voltammetry to Rapidly Design a Stable DMC-Based Electrolyte for Na-Ion Batteries. J. Electrochem. Soc. 166, A3723-A3730 (2019).
31 Cha, J., Han, J.-G., Hwang, J., Cho, J. & Choi, N.-S. Mechanisms for electrochemical performance enhancement by the salt-type electrolyte additive, lithium difluoro (oxalato) borate, in high-voltage lithium-ion batteries. J. Power Sources 357, 97-106 (2017).
32 Qi, X. et al. Lifetime limit of tris (trimethylsilyl) phosphite as electrolyte additive for high voltage lithium ion batteries. RSC Adv. 6, 38342-38349 (2016).
33 Aiken, C. et al. An apparatus for the study of in situ gas evolution in Li-Ion pouch cells. J.
Electrochem. Soc. 161, A1548-A1554 (2014).
34 Zhu, Y., Li, Y., Bettge, M. & Abraham, D. P. Positive electrode passivation by LiDFOB electrolyte additive in high-capacity lithium-ion cells. J. Electrochem. Soc. 159, A2109-A2117 (2012).
25
35 Maher, K. & Yazami, R. A study of lithium ion batteries cycle aging by thermodynamics techniques.
J. Power Sources 247, 527-533 (2014).
36 David, N., Wild, P., Jensen, J., Navessin, T. & Djilali, N. Simultaneous in situ measurement of temperature and relative humidity in a PEMFC using optical fiber sensors. J. Electrochem. Soc.
157, B1173-B1179 (2010).
37 Yan, G. et al. A New Electrolyte Formulation for Securing High Temperature Cycling and Storage Performances of Na‐Ion Batteries. Adv. Energy Mater. 9, 1901431 (2019).
38 Htein, L., Liu, Z., Gunawardena, D. & Tam, H.-Y. Single-ring suspended fiber for Bragg grating based hydrostatic pressure sensing. Optics express 27, 9655-9664 (2019).
39 Krause, L., Jensen, L. & Dahn, J. Measurement of parasitic reactions in Li ion cells by electrochemical calorimetry. J. Electrochem. Soc. 159, A937-A943 (2012).
40 Downie, L., Hyatt, S., Wright, A. & Dahn, J. Determination of the time dependent parasitic heat flow in lithium ion cells using isothermal microcalorimetry. J. Phys. Chem. C 118, 29533-29541 (2014). 41 Glazier, S., Li, J., Louli, A., Allen, J. & Dahn, J. An analysis of artificial and natural graphite in
lithium ion pouch cells using ultra-high precision coulometry, isothermal microcalorimetry, gas evolution, long term cycling and pressure measurements. J. Electrochem. Soc. 164, A3545-A3555 (2017).
42 Glazier, S. et al. The Effect of Methyl Acetate, Ethylene Sulfate, and Carbonate Blends on the Parasitic Heat Flow of NMC532/Graphite Lithium Ion Pouch Cells. J. Electrochem. Soc. 165, A867-A875 (2018).
Correspondence and requests for materials should be addressed to J.-M.T.
Acknowledgements
J.-M.T. J.H. and L.A.B. acknowledge the funding from the European Research Council (ERC) (FP/2014)/ERC Grant-Project 670116-ARPEMA. J.B., S.T.B., and H.-Y.T. acknowledge the funding from the General Research Fund Project (152207/18E) and the Hong Kong Polytechnic University (1-ZVGB). J.R.D. and E.R.L. thank the auspices of the NSERC/Tesla Canada IRC program. E.R.L. thanks NSERC and The Nova Scotia Graduate Scholarship program for scholarship support. The authors thank L. Htein from the Hong Kong Polytechnic University for his assistance in fabricating the microstructured optical fibers and F. Rabuel and T. Lombard for preparing the NMC111/graphite 18650 cells. The authors thank TIAMAT for providing the NVPF/HC 18650 cells as well as Faurecia for supporting part of this work. Finally, G. Assat, G. Yan, C. Cometto, B. Li, S. Mariyappan are gladly thanked for extensive and valuable discussions and comments.
Author contributions
J.H., L.A.B. and J.-M.T. conceived the idea and designed the experiments with the help of D.A.D.C. for building the experimental setup. J.H. performed the electrochemical, optical tests and the data analysis. J.B., S.T.B. and H.-Y.T. prepared the MOF-FBGs. E.R.L. and J.R.D. performed the isothermal calorimetry experiments. J.H. and C.D. performed the thermodynamics analysis with the help of B.M.G. Finally, J.-M.T., J.H., and L.A.B. wrote the paper, with contributions from all authors.