HAL Id: hal-02956339
https://hal.inrae.fr/hal-02956339
Submitted on 31 Mar 2021
HAL is a multi-disciplinary open access archive for the deposit and dissemination of sci-entific research documents, whether they are pub-lished or not. The documents may come from teaching and research institutions in France or abroad, or from public or private research centers.
L’archive ouverte pluridisciplinaire HAL, est destinée au dépôt et à la diffusion de documents scientifiques de niveau recherche, publiés ou non, émanant des établissements d’enseignement et de recherche français ou étrangers, des laboratoires publics ou privés.
wasting syndrome in hemodialysis patients
Julien Aniort, Marine Freist, Aurelien Piraud, Carole Philipponnet, Mohamed
Hadj-Abdelkader, Cyril Garrouste, Elodie Gentes, Bruno Pereira,
Anne-Elisabeth Heng
To cite this version:
Julien Aniort, Marine Freist, Aurelien Piraud, Carole Philipponnet, Mohamed Hadj-Abdelkader, et al.. Circulating 20S proteasome for assessing protein energy wasting syndrome in hemodialysis patients. PLoS ONE, Public Library of Science, 2020, 15 (7), pp.e0236948. �10.1371/journal.pone.0236948�. �hal-02956339�
RESEARCH ARTICLE
Circulating 20S proteasome for assessing
protein energy wasting syndrome in
hemodialysis patients
Julien AniortID1,2☯*, Marine Freist1,3☯, Aure´lien Piraud1, Carole Philipponnet1,
Mohamed Hadj Abdelkader1, Cyril Garrouste1, Elodie Gentes4, Bruno PereiraID5, Anne-Elisabeth Heng1,2
1 Nephrology, Dialysis and Transplantation Department, Gabriel Montpied University Hospital,
Clermont-Ferrand, France, 2 INRA, UMR 1019, Human Nutrition Unit (UNH), St Genès Champanelle, France,
3 Nephrology and Dialysis Department, Emile Roux Hospital, Le Puy en Velay, France, 4 Clinical Nutrition
Department, Gabriel Montpied University Hospital, Clermont-Ferrand, France, 5 University Hospital of Clermont-Ferrand, Biostatistics unit (DRCI), Clermont-Ferrand, France
☯These authors contributed equally to this work. *janiort@chu-clermontferrand.fr
Abstract
Protein energy wasting (PEW) including muscle atrophy is a common complication in chronic hemodialysis patients. The ubiquitin proteasome system (UPS) is the main proteo-lytic system causing muscle atrophy in chronic kidney disease and proteasome 20S is the catalytic component of the UPS. Circulating proteasome 20S (c20S proteasome) is present in the blood and its level is related to disease severity and prognosis in several disorders. We hypothesized that c20S proteasome could be related with muscle mass, other PEW cri-teria and their evolution in hemodialysis patients. Stable hemodialysis patients treated at our center for more than 3 months were followed over 2 years. C20S proteasome assay was performed at baseline. Biological and clinical data were collected, muscle mass was assessed by multi-frequency bio-impedancemetry, and nutritional scores were calculated at baseline, 1 year and 2 years. Hospitalizations and mortality data were collected over the 2 years. Forty-nine patients were included. At baseline, the c20S proteasome level was 0.40 [0.26–0.55]μg/ml. Low muscle mass as defined by a lean tissue index (LTI)<10th in accor-dance with the International Society of Renal Nutrition and Metabolism guidelines was observed in 36% and PEW in 62%. Increased c20S proteasome levels were related with LTI at baseline (R = 0.43, p = 0.004) and with its 2 year-variation (R = -0.56, p = 0.003). Two-year survival rate was not different between higher and lower c20S proteasome values (78.9 vs 78.4%, p = 0.98 log-rank test). C20S proteasome is not a good marker for assess-ing nutritional status in hemodialysis patients and predictassess-ing patient outcomes.
Introduction
The protein energy wasting (PEW) syndrome, including muscle atrophy, is frequently encoun-tered in hemodialysis patients and contributes to the high mortality rate observed in this a1111111111 a1111111111 a1111111111 a1111111111 a1111111111 OPEN ACCESS
Citation: Aniort J, Freist M, Piraud A, Philipponnet
C, Hadj Abdelkader M, Garrouste C, et al. (2020) Circulating 20S proteasome for assessing protein energy wasting syndrome in hemodialysis patients. PLoS ONE 15(7): e0236948.https://doi.org/ 10.1371/journal.pone.0236948
Editor: Paolo Fiorina, Children’s Hospital Boston,
UNITED STATES
Received: March 11, 2020 Accepted: July 16, 2020 Published: July 31, 2020
Peer Review History: PLOS recognizes the
benefits of transparency in the peer review process; therefore, we enable the publication of all of the content of peer review and author responses alongside final, published articles. The editorial history of this article is available here:
https://doi.org/10.1371/journal.pone.0236948
Copyright:© 2020 Aniort et al. This is an open access article distributed under the terms of the
Creative Commons Attribution License, which permits unrestricted use, distribution, and reproduction in any medium, provided the original author and source are credited.
Data Availability Statement: All relevant data are
within the paper and its Supporting Information files.
population [1]. It can be caused by a decrease in energy and protein intakes, sedentariness, hormonal disorders, metabolic acidosis and inflammation. The decrease in muscle mass is due to an imbalance in protein synthesis and proteolysis in favor of the latter [2]. The ubiquitin-proteasome proteolytic system (UPS) is crucial for the atrophying process, notably in chronic kidney disease (CKD) [3,4]. The first step in myofibrillar protein degradation is thought to be activation of caspase 3 [5]. The UPS then targets the proteins to be degraded, (such as myosin [6] and actin [7], by linking covalently a ubiquitin (Ub) chain. Ub chain formation is catalyzed by an enzymatic cascade (E1, E2, E3), with E3s that recognize the substrates. The 26S protea-some consists of a core particle with proteolytic activity (proteaprotea-some 20S) and two regulator particles (proteasome 19S) at its extremities [8]. The 26S proteasome recognizes and degrades polyubiquitinated proteins. In animal models of CKD-induced muscle atrophy, studies of muscle biopsies have shown an increase in the 14kDa actin level, a “footprint” of caspase 3 activity [5], increased expression of E3 ligases such as the muscle- specific E3 ligases MuRF1 and MAFbx [9,10], and proteasome subunits[11]. In humans, activation of the UPS is evi-denced by an increased expression of several E3 ligases in the muscle of hemodialysis patients [4]. However, it is not possible to perform a muscle biopsy in all patients to detect the activa-tion of UPS. This is why the identificaactiva-tion of biomarkers associated with the onset of muscle wasting and that are easily measurable in the blood would be more useful. 20S proteasome measured in plasma by ELISA seems a good candidate for this assessment. Increases in circu-lating 20S proteasome (c20S proteasome) have been widely reported in hematologic malignan-cies, solid cancers, burn injury, sepsis and autoimmune diseases. c20S proteasome levels are associated with poor prognosis and increased mortality in this setting [12]. To date only one study, byFukasawa et al., has looked at the c20S proteasome as a marker of muscle atrophy.
The authors found a weak but significant correlation in hemodialysis patients between c20S proteasome, abdominal muscle area measured by computed tomography and creatinine pro-duction [13]. Thus, we hypothesized that an increase in the c20S proteasome level could pre-dict the evolution of PEW parameters and patient outcomes. The aim of this study was to determine whether a c20S proteasome assay is predictive of muscle mass loss and PEW in hemodialysis patients.
Material and method
Study design and subjects
We conducted a prospective cohort study at the dialysis center of the university hospital of Clermont-Ferrand (France). Patients over 18 years old and treated by hemodialysis or hemo-diafiltration for more than 3 months were selected. Exclusion criteria were lack of consent, acute infection or inflammatory disease during the 3 months before inclusion, serum C reac-tive protein level (CRP) > 30 mg/L, acreac-tive malignancy disease, hypercortisolism, uncontrolled dysthyroidism and neuromuscular pathology. Patients were followed from March 2016 to March 2018 or death or until transplantation, transfer to another center or the end of follow-up (march 20). The study protocol has been reviewed and approved by the local research ethic committee, (CPP Sud-Est VI, no. 2016-AU1246) and the French national agency for the safety of medicines and health products (IDRCB: 2016-A00204-47). All patients provided written informed consent before participation.
Biochemical and clinical measurements
Demographic and clinical data (gender, age, cause of end stage renal diseases, dialysis vintage, technique and comorbidities) were obtained at baseline from medical records. The date and cause of death, number of hospitalizations, dates and causes of admission were collected over 2 Funding: The authors received no specific funding
for this work.
Competing interests: The authors have declared
years. Blood samples were drawn at the start and the end of the middle week dialysis sessions at baseline, and after 1 and 2 years of follow-up. Urea and creatinine serum levels before and after dialysis sessions, albumin, prealbumin, bicarbonate, hemoglobin, CRP, parathyroid hor-mone (PTH), vitamin D, iron, ferritin and transferin serum levels were measured by standard laboratory techniques with an auto-analyzer.
Anthropometric measurements
Anthropometric measurements (body weight, height, mid-arm circumference, triceps skinfold thickness) were performed after a mid-week dialysis session at inclusion and at 1 year and 2 years. Body mass index (BMI) was calculated with the ratio body weight /size2(kg/m2) and mid-arm muscle circumference (MAMC) with the following formula: mid-arm circumfer-ence– 3.142 x triceps skinfold thickness (cm).
Bioimpedancemetry
Body composition [adipose tissue mass (ATM), lean tissue mass (LTM), fat tissue Index (FTI), lean tissue index (LTI) and overhydration (OW)] was evaluated at inclusion, 1 year and 2 years by multifrequence bioimpedancemetry using a Body Composition Monitor (BCM 1 Fresenius Medical Care, Bad Homburg, Germany). Measurements were performed after 10 minutes of rest in the lying position, before the start of a mid-week dialysis session.
Proteasome measurement
C20S proteasome was measured by enzyme-linked immunosorbent assay (ELISA) using the proteasome ELISA kit (Enzo Life Sciences, Farmingdale, New York, United-States) at inclu-sion and at the end of follow-up. As previously reported [13], 5 ml of blood were drawn before a mid-week dialysis session in a dry tube with separating gel and then centrifuged. Aliquots were then prepared and stored at -20˚C. The ELISA plate is coated with the capture antibody. The detection antibody is then added, followed by the secondary antibody conjugated with horseradish peroxidase. Peroxydase reacts with TMB (3, 3’, 5, 5’-tetramethylbenzidine) sub-strate to produce a blue solution. The color intensity at 450 nm is directly proportional to pro-teasome concentration.
Formula and calculated scores
Kt/Vspwas calculated with the formula ofDaugirdas et al to evaluate dialysis dose: Kt/Vsp= ln
(R—0.008× t) + (4–3.5 × R) × 0.55 UF/W, where R is the ratio of postdialysis to predialysis urea level, UF the ultrafiltration volume and W the post-dialysis body weight [14]. Normalized protein catabolic rate (nPCR) was calculated according to the model ofDepner et al: nPCR (g/
kg/day) = (Urea× 2.801) / (25.8 + 1.15 Kt/Vsp+ 56.4/ Kt/Vsp) + 0.168. Urea is serum urea
(mmol/L) before dialysis [15]. Creatinine index was calculated according toCanaud et al with
the following formula: creatinine index (mg/kg/day): 16.21 + 1.12× [1 (male); 0 (female)]-0.06× age—0.08 × Kt/Vsp+ 0.009× creatinine, age in years, creatinine in μmol/L [16]. The
Prognostic Inflammatory and Nutritional Index (PINI) was calculated by the following for-mula: PINI = (alpha1-Acid Glycoprotein (α-AG) = orosomucoid in mg/L × CRP mg/L) / (albumin in g/L× prealbumin in mg/L)[17]. Protein energy wasting syndrome (PEW) was defined according to guidelines of the International Society of Renal Nutrition and Metabo-lism (ISRNM) [18]. However, energy and protein intakes are not routinely collected in our center and nPCR was used to assess protein intake. A simplified definition of PEW was used [19] based on fewer than three of the following items: albumin > 35g/dl, BMI > 23kg/m2,
serum creatinine/body surface area (BSA) > 380μmol/l/m2(with BSA estimated using Boyd formula) and nPCR > 0.8g/kg/day.
Statistical analysis
All statistical analyses were performed with Stata software (version 13, Statacorp, College Station, US). The tests were two-sided with a type-I error set at 5%. Categorical data were presented as numbers and percentages and continuous data as mean± standard-deviation (SD) or median (interquartile range) according to the statistical distribution. The assumption of normality was assessed by the Shapiro-Wilk test. Univariate analyses were then carried out to compare variables between independent groups using Student t-test or Mann-Whitney test when the hypotheses of t-test were not met for continuous parameters and Chi2 test or, if applicable, Fisher’s exact test for categorical variables. The study of relations between continuous variables was analyzed estimating correlation coefficient, Pearson or Spearman according to the statistical distribution and applying a Sidak’s type I error correction to take into account multiple comparisons. Survival was estimated by the Kaplan-Meier method. To identify prognostic predictors, comparisons were performed with the log-rank test in univariate analyses and Cox proportional-hazards regression. The pro-portional-hazard hypothesis was tested by Schoenfeld’s test and plotting residuals.
Results
Baseline characteristics
At the start of the study, 96 patients were being treated in our center, of whom 49 were enrolled and followed. A flow chart is provided inFig 1.
Baseline characteristic of the patients are shown inTable 1. The cause of ESRD was chronic glomerulonephritis (35%), vascular nephropathy (18%), polycystic kidney disease (10%), dia-betic nephropathy (4%) and other/unknown (35%). Four (8%) patients were being treated with perdialytic parenteral nutrition and 21 (45%) with oral nutritional supplements. Three (6%) patients had Kt/Vsp< 1.2, 6 (12%) patients had a predialysis bicarbonate blood level
below 22 mmol/L, 9 (18%) a PTH level above nine times the upper limit of normal value, and 18 (37%) had a 25OH Vitamin D3 < 30μg/L.
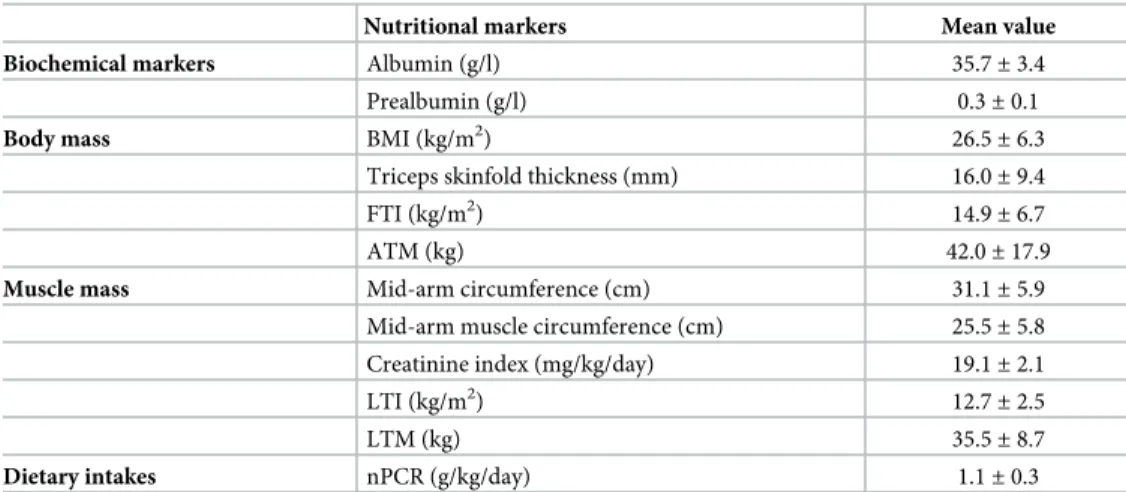
Values of nutritional markers at inclusion are shown inTable 2. BMI < 23 was observed in 13 (27%) patients. Patients had a serum albumin < 35 g/L or a serum prealbumin < 0.30 g/L in 41% and 47% of cases, respectively. Low muscle mass as defined by a LTI < 10th was observed in 16 (33%) patients. PINI > 1 was recorded in 15 (31%) patients, and PEW in 24 (49%) and 30 (61%) patients according to ISRNM or simplified definition, respectively.
c20S proteasome and correlation with nutritional markers at baseline and
during follow-up
At inclusion, c20S proteasome level were 0.40[0.26–0.55]μg/ml. Pearson correlation coeffi-cients between c20S proteasome levels and different nutritional parameters are resumed in
Table 3. Increased c20S proteasome level were positively related with LTI at baseline and nega-tively with 2 years LTI variation (Fig 2). C20S proteasome was not different in patients with PEW at baseline according ISRNM (0.42± 0.21 Vs 0.45 ± 0.19, p = 0.73) or according the sim-plified definition (0.39±0.19 Vs 0.51 ±0.22, p = 0.21) in comparison of patients without PEW.
c20S proteasome levels and patients outcomes
During the follow-up period 11 patients died (22.9%), 3 patients died during the first year and 8 during the second year of follow-up. The causes of death were cardiac disease (n = 2),
cerebral stroke (n = 1), neoplasia (n = 1), pulmonary embolism (n = 1), calciphylaxis (n = 1), hemorrhage (n = 1), hemodialysis withdrawal (n = 2) and unknown (n = 1). C20S proteasome level (HR = 1.124, 95%CI [0.05–24.8], p = 0.94) and a proteasome level above the median value (HR = 0.75, 95%CI [0.21–2.59], p = 0.63) did not predict patient survival at two years. Among nutritional markers, only a prealbumin level < 30 g/L was associated with decreased patient survival at two years (HR = 5.1, 95%CI[1.10–24.1], p = 0.03) (Fig 3). During the follow-up, 28 patients were hospitalized. Admission rates did not differ between patients having above or under the median c20S proteasome value (p = 0.15).
Discussion
This study assessed the value of the c20S proteasome in the assessment of nutritional status, prediction of its evolution and its prognostic value in chronic hemodialysis patients. The Fig 1. Flow chart. CRP, C-reactive protein.
baseline value of c20S proteasome was poorly but significantly positively related with LTI and increased c20S proteasome was predictive of muscle mass loss at two years. However, in this study c20S proteasome level did not seem predictive of patient outcome.
The presence of c20S proteasome in blood plasma was first reported byWada et al in 1993
[20]. In the early 2000s its detection with ELISA was developed [21]. Since then c20S protea-some has been studied in several diseases. Elevated c20S proteaprotea-some is found in different solid tumors [22], hematological disease [23], critically ill patients [24], autoimmune diseases [25] Table 1. Baseline characteristics.
Characteristics Value
Age (years) 68.7± 12.3
Female, n (%) 17 (35)
BMI (kg/m2) 26.5± 6.3
Diabetes, n (%) 16 (33)
Dialysis vintage (months) 38 [15–58]
Time dialysis session (hours) 4.1± 0.3
Kt/V 1.8± 0.3 Urea (mmol/l) 21.0± 6.4 Creatinine (μmol/l) 708± 172 Bicarbonate (mmol/l) 23.8± 2.4 Plasma proteins (g/l) 68.0± 5.6 Hemoglobin (g/dl) 12.0± 1.2 Parathyroid hormone (ng/l) 484 [168–608] Vitamin D (μg/l) 34.1± 16.5
Transferrin saturation coefficient, % 30.3± 8.8
Ferritin (ng/L) 474± 255
CRP (mg/l) 6.6± 7.9
BMI, body mass index; CRP, C-reactive protein.
https://doi.org/10.1371/journal.pone.0236948.t001
Table 2. Baseline values of nutritional markers.
Nutritional markers Mean value Biochemical markers Albumin (g/l) 35.7± 3.4
Prealbumin (g/l) 0.3± 0.1
Body mass BMI (kg/m2) 26.5
± 6.3 Triceps skinfold thickness (mm) 16.0± 9.4
FTI (kg/m2) 14.9
± 6.7
ATM (kg) 42.0± 17.9
Muscle mass Mid-arm circumference (cm) 31.1± 5.9 Mid-arm muscle circumference (cm) 25.5± 5.8 Creatinine index (mg/kg/day) 19.1± 2.1
LTI (kg/m2) 12.7
± 2.5
LTM (kg) 35.5± 8.7
Dietary intakes nPCR (g/kg/day) 1.1± 0.3 ATM, adipose tissue mass; BMI, body mass index; FTI, fat tissue index; LTI, lean tissue index; LTM, lean tissue mass; nPCR, normalized protein catabolic rate; PEW, protein energy wasting; PINI, prognostic inflammatory and nutritional index.
and surgery [26] where it can be predictive of disease severity and/or patient outcomes. C20S proteasome is probably not specific to muscle mass or protein wasting and could reflect vari-ous mechanisms. The origin (white blood, cancer or injured cells) and role of the circulating proteasome are incompletely elucidated and need to be explored.
Table 3. Pearson correlation coefficient between c20S Proteasome at baseline and nutritional markers.
Baseline value 1 year Variation 2 years Variation
Dry weight 0.14 0.03 0.08 BMI 0.11 0.00 -0.04 LTI 0.43� -0.06 -0.56� LTM 0.39� 0.34 -0.54� FTI 0.20 0.06 0.40� ATM 0.22 0.22 0.28 Creatinine Index 0.14 -0.19 0.11 Albumin -0.10 0.24 0.12 Prealbumin 0.17 0.23 0.18
ATM, adipose tissue mass; BMI, body mass index;; FTI, fat tissue index; LTI, Lean tissue index; LTM, lean tissue mass
�p<0.05.
https://doi.org/10.1371/journal.pone.0236948.t003
Fig 2. Linear regression between two years LTI variation and baseline c20S proteasome. c20S proteasome, circulating 20S proteasome; LTI, lean tissue index
measured by multifrequence bioimpedancemetry.
C20S proteasome levels in our study were quite low compared to those in the study of Fuka-sawa et al [13]: values of c20S proteasome level dosage, 1.34± 1.12 μg / mL (ELISA) and 1.33± 0.53 μg / mL (Western Blot) for CKD patients in the Japanese study, and 0.41 ± 0.31 (ELISA) in our study. The low c20S proteasome levels observed in our study cannot be explained by differences in assay methods since we used the same ELISA assay which had been correlated with Western Blot measurements. A second assay of the 20S proteasome was carried out in the remaining patients at the end of the 2 years of follow-up: it also found lower values than in the study ofFukasawa et al (0.6 ±0.16), which makes the assumption of an assay error
unlikely.
In the study ofFukasawa et al, a negative correlation was found between c20S proteasome
levels and abdominal muscle area (AMA) measured in axial CT images at the level of the third lumber spine. In contrast, in the present study we found a low but significant correlation between c20S proteasome levels and muscle mass measured by multifrequence bioimpedance-metry. It could be assumed that this was due to a different technique for measuring muscle mass but the measurement of the muscle area in the lumbar section and bioimpedancemetry are both fairly representative of muscle mass assessed by dual energy X-ray absorptiometry, which is the reference technique [27,28]. In addition, in our study LTI and c20S proteasome assays were performed the same week. In the study ofFukasawa et al, the CT scan used for
AMA measurement was not performed during the same week and the indication of this exam was not specified. In fact, the correlation coefficient reported was very low (R = 0.26 in univari-ate analysis and R = 0.19 in multivariunivari-ate analysis). Hence, even if the relationship is statistically significant it is not clinically relevant. Moreover, as in our study, no correlation was found between the levels of c20S proteasome and other parameters conventionally used to assess nutritional status such as albumin level, creatinine, nPCR, BMI, IL-6, subcutaneous and vis-ceral abdominal fat mass. In our study, the c20S proteasome levels were not related to
decreased muscle mass or PEW criteria at baseline. Unexpectedly, we found a positive correla-tion between c20 proteasome and LTI at baseline whereas increased proteasome 20S was sig-nificantly related to a decrease in LTI at 2 years. Provided that the circulating proteasome originates from the muscle cell, this can be explained by the fact that the quantity released Fig 3. Two-year survival according to baseline c20S proteasome and prealbumin value. c20S proteasome, circulating 20S proteasome.
depends not only on the state of activation of the proteasome within each muscle fiber (i.e. muscle catabolic process) but also on the number of fibers (i.e. muscle mass).
Other new biological markers of muscle have been recently reported notably post-transla-tionally modified muscle-specific ubiquitin ligases and miRNA [29]. In hemodialysis patients, myostatin and IGF1 have been shown to be correlated with HGS and MMI (muscle mass divided by body surface area measured by multifrequence impedancemetry). However, the correlation coefficients were low (R=0.37 and 0.46, respectively) for HGS and MMI. More-over, predialysis creatinine performed better. These parameters were associated with first-year mortality in univariate analysis but their effect was non-significant when adjusted for prealbu-min [30]. Similar results were obtained in a subsequent study [31]. The use of a single marker may not be sufficient. A strategy based on the identification of a group of biomarkers could be more effective. Niewczas et al have recently shown that proteomic profiling of circulating pro-tein identified 17 propro-teins enriched for TNF Receptor Superfamilly members and associated with a 10-years risk of end stage-renal disease in diabetic patients [32]. Given the role of inflammation in PEW and muscle atrophy it can be assumed that such an approach would be relevant to discover biomarkers associated with the risk of muscle mass loss.
This study has certain limitations. First, with regard to the definition of PEW on the basis of the ISRNM score, we had to adapt to the data available to arrive as close as possible to the initial definition. It is therefore not a fully validated score. Second, the limited number of patients included and the rate of loss of follow-up resulted in a lack of power so that results at 2 years should be viewed with caution. The power of the study was calculated using the seqtest R package. Thus the power to detect a clinically relevant correlation (R2> 0.5) a type-I error
set at 5% was 98.3% at inclusion, 97% at 1 year and 89% at two years. In addition, variability in the dosage of c20S proteasome in the hemodialysis population was very low and made it more difficult to demonstrate a correlation. Finally, overall, the nutritional markers varied little dur-ing follow-up. CKD-induced muscle atrophy is a very progressive process and it is possible that muscle mass will stabilize after a period of decrease. Also, although the measurement of c20S proteasome seems of little interest in CKD patients, it could be so in cases of acute kidney injury, where UPS activation has been observed in animal models [10].
In conclusion, c20S proteasome measurement does not seem to be of great value in assess-ing and predictassess-ing the evolution of nutritional status in hemodialysis patients. Muscle atrophy is the result of profound changes in the metabolism of muscle fiber caused by kidney disease. A simultaneous study of the expression of genes in the blood and muscles at the transcriptomic and / or proteomic level in catabolic situations could perhaps identify the best candidates. A biological marker able to predict early the onset of muscle atrophy before its establishment remains to be discovered.
Supporting information
S1 Data.
(XLSX)
Acknowledgments
We are indebted to Mr. Jeffrey Watts for assistance in the preparation of the manuscript.
Author Contributions
Conceptualization: Julien Aniort.
Formal analysis: Julien Aniort, Bruno Pereira.
Investigation: Julien Aniort, Carole Philipponnet, Mohamed Hadj Abdelkader,
Anne-Elisa-beth Heng.
Methodology: Bruno Pereira, Anne-Elisabeth Heng.
Validation: Julien Aniort, Carole Philipponnet, Cyril Garrouste.
Writing – original draft: Julien Aniort, Marine Freist, Bruno Pereira, Anne-Elisabeth Heng.
References
1. Marcelli D, Usvyat LA, Kotanko P, Bayh I, Canaud B, Etter M, et al. Body composition and survival in dialysis patients: results from an international cohort study. Clin J Am Soc Nephrol. 2015; 10(7):1192– 200.https://doi.org/10.2215/CJN.08550814PMID:25901091
2. Cano NJ, Miolane-Debouit M, Leger J, Heng AE. Assessment of body protein: energy status in chronic kidney disease. Semin Nephrol. 2009; 29(1):59–66.https://doi.org/10.1016/j.semnephrol.2008.10.008
PMID:19121475
3. Wang XH, Mitch WE. Mechanisms of muscle wasting in chronic kidney disease. Nat Rev Nephrol. 2014; 10(9):504–16.https://doi.org/10.1038/nrneph.2014.112PMID:24981816
4. Aniort J, Stella A, Philipponnet C, Poyet A, Polge C, Claustre A, et al. Muscle wasting in patients with end-stage renal disease or early-stage lung cancer: common mechanisms at work. J Cachexia Sarco-penia Muscle. 2019; 10(2):323–37.https://doi.org/10.1002/jcsm.12376PMID:30697967
5. Du J, Wang X, Miereles C, Bailey JL, Debigare R, Zheng B, et al. Activation of caspase-3 is an initial step triggering accelerated muscle proteolysis in catabolic conditions. J Clin Invest. 2004; 113(1):115– 23.https://doi.org/10.1172/JCI18330PMID:14702115
6. Clarke BA, Drujan D, Willis MS, Murphy LO, Corpina RA, Burova E, et al. The E3 Ligase MuRF1 degrades myosin heavy chain protein in dexamethasone-treated skeletal muscle. Cell metabolism. 2007; 6(5):376–85.https://doi.org/10.1016/j.cmet.2007.09.009PMID:17983583
7. Polge C, Heng AE, Jarzaguet M, Ventadour S, Claustre A, Combaret L, et al. Muscle actin is polyubiqui-tinylated in vitro and in vivo and targeted for breakdown by the E3 ligase MuRF1. FASEB J. 2011; 25 (11):3790–802.https://doi.org/10.1096/fj.11-180968PMID:21764995
8. Tomko RJ Jr, Hochstrasser M. Molecular architecture and assembly of the eukaryotic proteasome. Annual review of biochemistry. 2013; 82:415–45. https://doi.org/10.1146/annurev-biochem-060410-150257PMID:23495936
9. Lecker SH, Jagoe RT, Gilbert A, Gomes M, Baracos V, Bailey J, et al. Multiple types of skeletal muscle atrophy involve a common program of changes in gene expression. FASEB J. 2004; 18(1):39–51.
https://doi.org/10.1096/fj.03-0610comPMID:14718385
10. Aniort J, Polge C, Claustre A, Combaret L, Bechet D, Attaix D, et al. Upregulation of MuRF1 and MAFbx participates to muscle wasting upon gentamicin-induced acute kidney injury. Int J Biochem Cell Biol. 2016; 79:505–16.https://doi.org/10.1016/j.biocel.2016.04.006PMID:27102410
11. Mitch WE, Medina R, Grieber S, May RC, England BK, Price SR, et al. Metabolic acidosis stimulates muscle protein degradation by activating the adenosine triphosphate-dependent pathway involving ubi-quitin and proteasomes. J Clin Invest. 1994; 93(5):2127–33.https://doi.org/10.1172/JCI117208PMID:
8182144
12. Sixt SU, Dahlmann B. Extracellular, circulating proteasomes and ubiquitin—incidence and relevance. Biochim Biophys Acta. 2008; 1782(12):817–23.https://doi.org/10.1016/j.bbadis.2008.06.005PMID:
18602990
13. Fukasawa H, Kaneko M, Niwa H, Matsuyama T, Yasuda H, Kumagai H, et al. Circulating 20S protea-some is independently associated with abdominal muscle mass in hemodialysis patients. PLoS One. 2015; 10(3):e0121352.https://doi.org/10.1371/journal.pone.0121352PMID:25803510
14. Daugirdas JT. Simplified equations for monitoring Kt/V, PCRn, eKt/V, and ePCRn. Adv Ren Replace Ther. 1995; 2(4):295–304.https://doi.org/10.1016/s1073-4449(12)80028-8PMID:8591121
15. Depner TA, Daugirdas JT. Equations for normalized protein catabolic rate based on two-point modeling of hemodialysis urea kinetics. J Am Soc Nephrol. 1996; 7(5):780–5. PMID:8738814
16. Canaud B, Granger Vallee A, Molinari N, Chenine L, Leray-Moragues H, Rodriguez A, et al. Creatinine index as a surrogate of lean body mass derived from urea Kt/V, pre-dialysis serum levels and
anthropometric characteristics of haemodialysis patients. PLoS One. 2014; 9(3):e93286.https://doi. org/10.1371/journal.pone.0093286PMID:24671212
17. Dessi M, Noce A, Agnoli A, De Angelis S, Fuiano L, Tozzo C, et al. The usefulness of the prognostic inflammatory and nutritional index (PINI) in a haemodialysis population. Nutr Metab Cardiovasc Dis. 2009; 19(11):811–5.https://doi.org/10.1016/j.numecd.2009.01.009PMID:19361965
18. Fouque D, Kalantar-Zadeh K, Kopple J, Cano N, Chauveau P, Cuppari L, et al. A proposed nomencla-ture and diagnostic criteria for protein-energy wasting in acute and chronic kidney disease. Kidney Int. 2008; 73(4):391–8.https://doi.org/10.1038/sj.ki.5002585PMID:18094682
19. Moreau-Gaudry X, Jean G, Genet L, Lataillade D, Legrand E, Kuentz F, et al. A simple protein-energy wasting score predicts survival in maintenance hemodialysis patients. J Ren Nutr. 2014; 24(6):395– 400.https://doi.org/10.1053/j.jrn.2014.06.008PMID:25194620
20. Wada M, Kosaka M, Saito S, Sano T, Tanaka K, Ichihara A. Serum concentration and localization in tumor cells of proteasomes in patients with hematologic malignancy and their pathophysiologic signifi-cance. J Lab Clin Med. 1993; 121(2):215–23. PMID:8433038
21. Dutaud D, Aubry L, Henry L, Levieux D, Hendil KB, Kuehn L, et al. Development and evaluation of a sandwich ELISA for quantification of the 20S proteasome in human plasma. J Immunol Methods. 2002; 260(1–2):183–93.https://doi.org/10.1016/s0022-1759(01)00555-5PMID:11792388
22. Heubner M, Wimberger P, Dahlmann B, Kasimir-Bauer S, Kimmig R, Peters J, et al. The prognostic impact of circulating proteasome concentrations in patients with epithelial ovarian cancer. Gynecol Oncol. 2011; 120(2):233–8.https://doi.org/10.1016/j.ygyno.2010.10.014PMID:21075439
23. Jakob C, Egerer K, Liebisch P, Turkmen S, Zavrski I, Kuckelkorn U, et al. Circulating proteasome levels are an independent prognostic factor for survival in multiple myeloma. Blood. 2007; 109(5):2100–5.
https://doi.org/10.1182/blood-2006-04-016360PMID:17095627
24. Roth GA, Moser B, Krenn C, Roth-Walter F, Hetz H, Richter S, et al. Heightened levels of circulating 20S proteasome in critically ill patients. Eur J Clin Invest. 2005; 35(6):399–403.https://doi.org/10.1111/ j.1365-2362.2005.01508.xPMID:15948901
25. Egerer K, Kuckelkorn U, Rudolph PE, Ruckert JC, Dorner T, Burmester GR, et al. Circulating protea-somes are markers of cell damage and immunologic activity in autoimmune diseases. J Rheumatol. 2002; 29(10):2045–52. PMID:12375310
26. Szerafin T, Hoetzenecker K, Hacker S, Horvath A, Pollreisz A, Arpad P, et al. Heat shock proteins 27, 60, 70, 90alpha, and 20S proteasome in on-pump versus off-pump coronary artery bypass graft patients. Ann Thorac Surg. 2008; 85(1):80–7.https://doi.org/10.1016/j.athoracsur.2007.06.049PMID:
18154785
27. Chamney PW, Wabel P, Moissl UM, Muller MJ, Bosy-Westphal A, Korth O, et al. A whole-body model to distinguish excess fluid from the hydration of major body tissues. Am J Clin Nutr. 2007; 85(1):80–9.
https://doi.org/10.1093/ajcn/85.1.80PMID:17209181
28. Baker ST, Strauss BJ, Prendergast LA, Panagiotopoulos S, Thomas GE, Vu T, et al. Estimating dual-energy X-ray absorptiometry-derived total body skeletal muscle mass using single-slice abdominal magnetic resonance imaging in obese subjects with and without diabetes: a pilot study. Eur J Clin Nutr. 2012; 66(5):628–32.https://doi.org/10.1038/ejcn.2012.3PMID:22274551
29. Wang F, Wang J, He J, Li W, Li J, Chen S, et al. Serum miRNAs miR-23a, 206, and 499 as Potential Biomarkers for Skeletal Muscle Atrophy. Biomed Res Int. 2017; 2017:8361237.https://doi.org/10.1155/ 2017/8361237PMID:29214178
30. Delanaye P, Bataille S, Quinonez K, Buckinx F, Warling X, Krzesinski JM, et al. Myostatin and Insulin-Like Growth Factor 1 Are Biomarkers of Muscle Strength, Muscle Mass, and Mortality in Patients on Hemodialysis. J Ren Nutr. 2019; 29(6):511–20.https://doi.org/10.1053/j.jrn.2018.11.010PMID:
30686748
31. Esposito P, Battaglia Y, La Porta E, Grignano MA, Caramella E, Avella A, et al. Significance of serum Myostatin in hemodialysis patients. BMC Nephrol. 2019; 20(1):462. https://doi.org/10.1186/s12882-019-1647-9PMID:31829144
32. Niewczas MA, Pavkov ME, Skupien J, Smiles A, Md Dom ZI, Wilson JM, et al. A signature of circulating inflammatory proteins and development of end-stage renal disease in diabetes. Nat Med. 2019; 25 (5):805–13.https://doi.org/10.1038/s41591-019-0415-5PMID:31011203