READ THESE TERMS AND CONDITIONS CAREFULLY BEFORE USING THIS WEBSITE. https://nrc-publications.canada.ca/eng/copyright
Vous avez des questions? Nous pouvons vous aider. Pour communiquer directement avec un auteur, consultez la première page de la revue dans laquelle son article a été publié afin de trouver ses coordonnées. Si vous n’arrivez pas à les repérer, communiquez avec nous à [email protected].
Questions? Contact the NRC Publications Archive team at
[email protected]. If you wish to email the authors directly, please see the first page of the publication for their contact information.
NRC Publications Archive
Archives des publications du CNRC
This publication could be one of several versions: author’s original, accepted manuscript or the publisher’s version. / La version de cette publication peut être l’une des suivantes : la version prépublication de l’auteur, la version acceptée du manuscrit ou la version de l’éditeur.
Access and use of this website and the material on it are subject to the Terms and Conditions set forth at
Ice interaction with Adams Island, Winter 1984-85
Frederking, R. M. W.; Wessels, E.; Maxwell, J. B.; Prinsenberg, S.; Sayed,
M.
https://publications-cnrc.canada.ca/fra/droits
L’accès à ce site Web et l’utilisation de son contenu sont assujettis aux conditions présentées dans le site
LISEZ CES CONDITIONS ATTENTIVEMENT AVANT D’UTILISER CE SITE WEB.
NRC Publications Record / Notice d'Archives des publications de CNRC: https://nrc-publications.canada.ca/eng/view/object/?id=aefdbce6-0628-4808-8f2c-9bd6a7c1aa70 https://publications-cnrc.canada.ca/fra/voir/objet/?id=aefdbce6-0628-4808-8f2c-9bd6a7c1aa70
-
I*!
National
Remarch Conwll natlonalCouncH Canada
de
recherches CanadaSer
TH1
'
Institute for lnstitut deI Research in recherche en
I "*ld 1 Construction construction
no.
1504
c. 2 1
BLDG
Ice Interaction with Adams Island, Wlnter
1984
-
85
by R. Frederking, E. Wessels et al
Appeared in
Proceedings 8th International IAHR Symposium on Ice
Iowa City, Iowa, August 18
-
22,1986Vol. Ill, p. 127-143
(IRC Paper No. 1504)
Reprinted with permission
Price $3.00 NRCC 28607
Un ilot peut etre considCrt5 cornme Ctant representatif d'un ouvrage construit en mer. Une vaste etude concernant l'interaction des glaces avec un !lot et la kponse du manteau glaciel aux Cldments naturels a CtC menee au cours de l'hiver 1984-1985. Les mesures effectuees ont port6 sur les facteurs mCtCorologiques et ocCanographiques, ainsi que sur les mouvements du manteau de glace et les contraintes in situ.
Les variations des marCes, tant semi-diurnes que semi-mensuelles, semblent etre responsables de la vitesse variable de deplacement horizontal du manteau de glace et, par condquent, des fluctuations cycliques des contraintes mesukes dans la glace. Le courant, le vent et la temperature de l'air ont Cgalement un effet sur les mouvements et les contraintes. La charge totale maximale exercCe sur l'ilot Ctait d'environ
60
MN,
soit 1'Cquivalent d'une contrainte moyenne de300 kPa sur le premier m8tre d'epaisseur de
glace, sur une largeur de 200 m. Les pressions locales sur une surface de 0,5 m2 ont atteint un maximum de 500 kPa.IAHR Ice Symposium
1986Iowa City, Iowa
ICE INTERACTION WITH ADAMS I S W D , WINTER 1984-85
I
?T
T G d e rk ingSenior Research Officer Council of Canada Ontario, Canada
i
.
Wessels Hamburgische Schiffbau- HamburgVersuchsanstalt Gmbh. West Germany
P
. E ~ e l l - - -Ontario, Canada
1
1s. Prinsenberg Bedford Institute Dartmouth, Nova of Oceanography Sco tia, Canada
)I. Sayed National Research Ottawa
i"
sociate Research Officer Council of Canada Ontario, CanadaI
small island can be taken as being representative of a man-made
ffshote structure. A comprehensive study of ice interaction with such !an island and response of the ice sheet to environmental driving forces
as carried out over the winter 1984/85. Measurements included
eteorological and oceanographic factors as well as ice-cover movements
I
nd in-situ stresses.idal variations, both semi-diurnal and fortnightly, appear to be eaponsible for variable horizontal ice-cover movement rates and hence
E
yclical variations in rneasured ice stresses. Current, wind and airemperature also affect movements and stresses. Maximum total load
enerated on the island was approximately 60 MN, equivalent to an average tress of 300 kPa over the top 1 m of the ice thickness and 200 m width.
LNTRODUCTION
The determination of design ice loads on marine structures in the Arctic requires knowledge in two basic areas: influence of the environment on ice behaviour; and the resulting interaction of the ice cover with the structure. Only by understanding both areas can experience gained at one location or under a given set of circumstances be successfully applied at another site.
Available information on ice behaviour and loads on offshore structures is limited. Although extensive monitoring programs have been carried out for petroleum exploration structures in the near-shore region of the Beaufart Sea, only some of the results have been published (Metge, 1976; Semeniuk, 1977; Johnson et al., 1985). Much more information is
proprietary and only the methods of measurement have been published (Pilkington et al., 1983; Hawkins et al., 1983; To, 1985).
It is desirable to obtain information from other areas of the Arctic where conditions are different. For such studies small islands can take the place of man-made structures in investigations of icelstructure
interaction. This approach has been used in investigations of the impact of Large wlti-year floes on Hans Island (Danielewicz et al., 1983) and first-year sea-ice rubble formation at Fairway Rock (Kovacs and Sodhi, 1981). A similar study carried out at Adams Island in Lancaster Sound is the subject of this paper.
The project involved a number of participants and extended over three winter seasons. The National Research Council of Canada coordinated the project and was involved in measurement of movements and large-scale deformations of the ice cover as well as in characterization of ice loads and hehaviour. The Atmospheric Environment Service was involved with the measurement of air temperature, wind, and drag, and the Department of Fisheries and Oceans with measurement of currents and tide. C-CORE
undertook strain measurement in the ice cover (Stander, 1986) and current measurements (Shirasawa, 1985). The Hamburg Ship Model Basin carried out
in-situ stress measurements in the ice cover.
The primary objectives were to determine the response of the ice cover to climatological and oceanographic driving forces and consequent ice
interaction with the island. Selected results for the winters of 1981182, 1982f83, and 1983184 have been reported (Frederking et al.,
1983, 1984, 1986). 'hiw paper preAentR retitrlt~ OL ~wt?Rnuremt?lltH ot
environmental factors such as wind, current, and temperature, as well as movements and stresses in the ice cover adjacent to the island during the
1984185 winter season.
SITE DESCRIPTION
The area of investigation is at the intersection of Lancaster Sound and Navy Board Inlet (70° 45' N, 81' 30' W, Figure 1). Adams Island is situated about 3 km offshore from a base camp (Borden Station) on the brden Peninsula and is rocky, with steep cliffs on its northern aide. A
maximum elevation of 20 m gradually slopes to the east, south, and west. The south shore is also nearly vertical, with an escarpment of about 4 m. The beaches are rocky and relatively steep. A bathymetric survey
revealed that the sea bottom slopes gradually to the north and west, but steeply to the southeast.
L A N C A S T E R S O U N D
BOROEN P E N l FI SU L A
SCALE OF ICE COVER
F I G U R E 1
A D A M S I S L A N D A R E A A N D N A V Y B O A R D I N L E T 1984185 S E A S O N
First-year ice normally forms in the middle of Navy Board Inlet in October, becomes land fast, and progresses northward up the Inlet, reaching Lancaster Sound in November. Maximum first-year ice thickness is typically 1.8 m. The island is generally at the boundary between level and ridged ice. A zone of shear and pressure ridges becomes land fast in midrinter to a distance of about 5 km north of the island. During the open-water season multiyear ice from the Arctic Archipelago and icebergs from the glaciers of Greenland and Ellesmere Island move about in Lancaster Sound. Some of these ice features freeze into the ice cover of Navy Board Inlet. Typically, there can be five to ten large icebergs within 10 km of Adams Island and a multiyear floe concentration of 1% to 5%. The pack ice in Lancaster Sound is generally dynamic
throughout the entire winter, with a net movement from west to east.
During the site visit of November 5-21, 1984 the ice was already land fast, with a thickness of 25 to 30 cm at the beginning of the period. In March 1985 the land-fast ice edge was about 3 km north of Adams Island.
On March 10, 1985 the land-fast ice broke off, with the edge coming to within 100 m of the north side of the island. A few days later the pack ice in Lancaster Sound moved back and again became fast to within 2 km of the island. h March 14 the average ice thickness around the island was 1.5 m. By May 20 the thickness was 1.75 m.
DRIVING FORCES Climate
The mesoscale climate network designed for use in the Adams Island area for the 1983-84 season (Frederking et al., 1986) remained in operation during the 1984-85 season with only minor modification. Five stations were employed to measure and record air temperature, wind speed and direction, and wind shear drag on the ice cover. Wind shear was
determined from wind profile measurements. For 1984-85, a sixth station was installed on the ice of Navy Board Inlet at Canada Point, about 60 km
to the south. In addition to measurements of air temperature and wind speed and direction, temperatures were measured at six levels in the ice cover and sea beneath. The ice temperature data have been used to
determine thermal diffusivity of the sea ice (Langleben, 1986). Data collection commenced at all six stations in early to mid-November and continued until mid-May.
For the 1984185 winter the temperature trends were generally similar to the pattern normally expected in the region. The coldest month was February, with the minimum temperature slightly below -40°C late in the month. Air temperature first rose above freezing on May 14. Westerly winds tended to dominate the Adams Island area in 1984185 as in 1983/84. Wind speeds were fairly uniform across the area, particularly during strong wind events. During 1984185, the strongest wind occurrence took place in late November (100 kmlh at Borden). Less intense, although still severe, events occurred just before mid-January, about March 10, and near the end of April.
The March 10 event (Figure 2) was particularly interesting as it occurred during a site visit. On March 9, winds at all stations were westerly to northwesterly and gradually increased in speed to 40 to 50 km/h.
Abruptly at 0100 EST on March 10, the wind shifted by 90 to 100 degrees to southerly and after a brief lull increased in speed to 75 to 80 km/h by 0600 EST, lessening gradually thereafter. The result of this was the development of a break in the ice along the north side of Adams Island. The ice cover drifted away, causing a loss of some environmental sensors. On the latter part of March 11 the wind shifted to the northeast and increased in velocity, bringing the pack ice back.
9 1 0 11
MARCH. 1985 F I G U R E 2
W I N D S P E E D A N D D I R E C T I O N A T A D A M S I S L A N D , 9 - 1 1 M A R C H , 1 9 8 5
Drag coefficients were calculated for occurrences of near neutral stability conditions at the wind profile stations. There was
considerable scatter in the data, but drag coefficients were similar to the results of the previous year, in the range 0.0008 to 0.0020.
Oceanography
During the 1984185 season current measurements were not successful owing to the failure of one instrument and loss of another one during the March 10 event. Therefore the following discussion is based on currents measured in the 1983184 season around Adams Island. It is not expected that there would be a significant change from one year to the next.
During a flooding tide (rising sea surface), water in Lancaater Sound moves west except for a persistent easterly coastal current along the southern shore, which is stronger than the tidal current and thus does not reverse but only reduces in magnitude. Currents between Adams Island and Borden Peninsula are generally to the northwest during a flooding tide, with observed speeds of up to 35 cm/s but generally at about
20 cm/s. North of the island the current turne northwards, owing to the interaction with the coastal current moving eastwards along the ridge. Ice motions during rising sea Level (flood) tend to be northwards into Lancas ter Sound.
During an ebbing tide (falling sea level) water flows eastwards in Lancaster Sound, increasing the coastal current to 35 cmls. Currents around Adams Island are then in a southerly and southeasterly direction, moving water from Lancaster Sound into Navy Board Inlet. Ice motions would tend to-be in the same direction, compressing the ice cover around Adams Island into Navy Board Inlet.
Two-day average ice-motion data from the 1983184 season (Frederking et al., 1986) showed a net northerly movement apparently in phase with the fortnightly tidal cycle. The data for the period March 17 to May 18,
1984 show a direct relation between displacement rate and predicted mean daily tidal ranges from Resolute Bay or observed local maximum water velocities (Figure 3). Four points were omitted in both parts of Figure 3, as they had very large ice displacements, possibly due to strong southerly winds. The correlation coefficient for the remaining
L * 0.136 I R - 0 . 3 7 1 D DEVIATION
I
ITANDARD 0 . 5 1 . 0 1 . 5 2. 0 M E A N D A I L Y T I D A L R A N G E , R , m W I N D S 0 VARIABLE E-W A STROffi W 0 . 2 LIGHT WI
DECREASE W A AI
0.
%, L = 0.009 ( U - 10) e/'-
0 0/.'.
=
e . 0.
"
I
STANDARD A'* DEVIATION.
10 15 2 0 25 30 M E A N M A X I M U M W A T E R V E L O C I T Y , U , c m l s F I G U R E 3 R E L A T I O N B E T W E E N D A l L Y H O R I Z O N T A L I C E M O V E M E N T R A T E A N D T I D E R A N G E ( a ) A N D C U R R E N T V E L O C I T Y I b l F O R THE P E R I O D M A R C H T O M A Y 1984data was 0.50 for the tidal range data and 0.69 for the local observed current data, indicating that local oceanographic conditions correlated better with the ice motions than the more readily available tidal
predictions for Resolute Bay some 200 km away. The regression lines for movement rate, L, shown in Figure 3, are given by L = 0.136 (R-0.37) for mean daily tidal range R and by L = 0.009 (U-10) for mean maximum water velocity U.
From a closer examination of the meteorological data it was apparent that
the effect of wind on the ice motion, either directly by air-ice wind stress or indirectly due to pressure-induced sea-level variations, could
explain the scatter. Large ice displacements (points above the regression lines) are generally caused by medium strength winds with
large direction variations or strong westerly or easterly winds. On the
other hand, smaller displacements than regression values occurred when strong westerly winds decreased steadily in magnitude. When regression analysis was done with the magnitude of the water-current stress or its north-south component the regression coefficient did not improve and actually decreased. This indicates that wind stress or water currents may not directly determine the magnitudes of ice motion, but their effect may be indirect through sea-level variations.
ICE MOVEMENTS AND DEFORMATIONS
An electronic distance-measuring (EDM) instrument (Wild DI-20) coupled to
a theodolite (Wild T-2) was used to measure movements of reference points on the ice cover. Positions of the reference points on the ice were established by measuring their distance and bearing from fixed base lines. The overall accuracy of the surveys when checked by closure was about 220 mm.
For the 1984185 season two arrays were established in November, one around Adams Island and another between Borden and Adams Island. At the same time an array of five reflectors was established at Canada Point, about 60 km south of Navy Board Inlet. All three arrays were surveyed
again in March and May. An additional array (South Array) was set up in
March about midway between Borden and Canada Point. The locations of
these arrays and typical movement vectors are shown in Figure 1. The
solid lines on this figure are for the November-February period and dashed lines for the March-May period. The arrowheads indicate the direction of movement. All three measurement areas showed movements to the north, with the largest magnitude to the east of Adams Island. The movement rates at Canada Point and the South Array were much less than those at Adams Island.
The northerly ice movement past Adams Island has been explained in terms
of a tidal jacking process (Frederking et al., 1986). An analytical
model developed at the University of Waterloo (Cushon and Sykes, 1985) supports this as a plausible explanation. The Borden and Adams Island arrays showed movements similar to those of previous winters at these
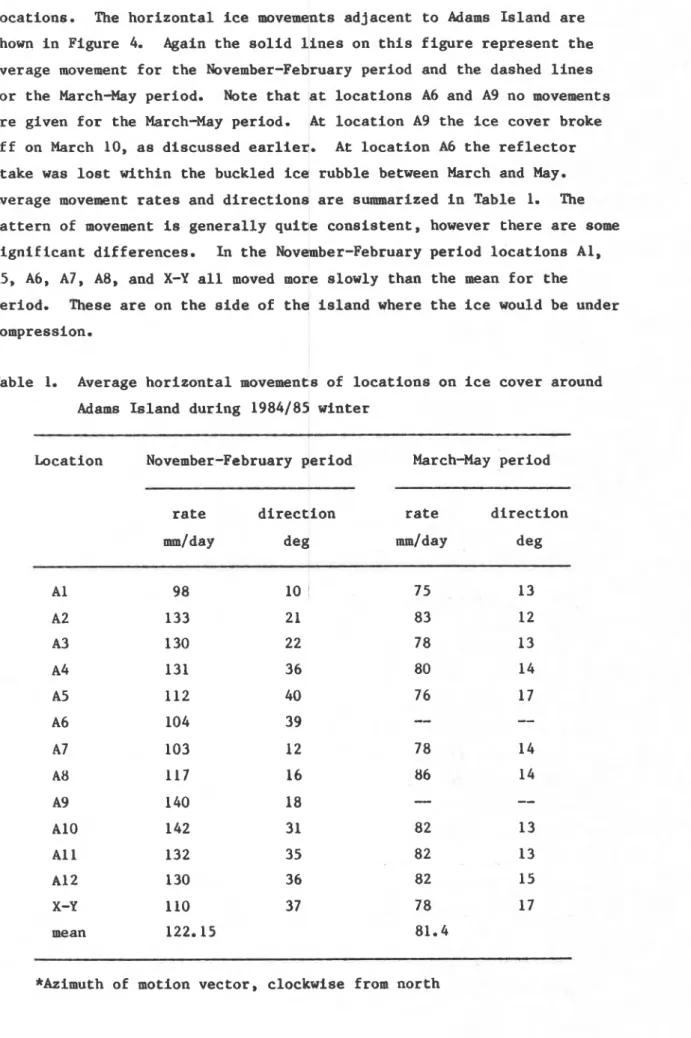
locations. The horizontal ice movemeats adjacent to Adams Island are
shown in Figure 4. Again the solid lines on this figure represent the
average movement for the November-February period and the dashed lines for the March-May period. Note that at locations A6 and A9 no movements are given for the March-May period. At location A9 the ice cover broke off on March 10, as discussed earlier. At location A6 the reflector
stake was lost within the buckled ice rubble between March and May.
Average movement rates and directions are summarized in Table 1. The
pattern of movement is generally quite consistent, however there are some significant differences. In the November-February period locations Al, A5, A6, A7, A8, and X-Y all moved more slowly than the mean for the
period. These are on the side of the island where the ice would be under compression.
Table 1. Average horizontal movements of locations on ice cover around
Adams Island during 1984185 winter
Location November-February period March-May period
rate direction rate direction
mlday deg mm/day deg
A1 9 8 10 75 13 A2 133 2 1 8 3 12 A3 130 2 2 78 13 A4 131 3 6 80 14 A5 112 40 7 6 17 A6 104 39
--
--
A7 103 12 7 8 14 AS 117 16 86 14 A9 140 18-
--
A10 142 31 8 2 13 A1 1 132 3 5 8 2 13 A1 2 130 36 82 15 X-Y 110 37 78 17 mean 122.15 81.4I I
A D A M S I S L A N D\
*'
?d
A 5
X - Y
i
SCALE OF ICE COVER M O V I M I N I S d N O V -I L U MAR -MAY A 1 2 -- ---- IO m 20 nn-
STRESS PANELS F I G U R E 4 H O R I Z O N T A L M O V E M E N T S OF I C E C O V E R A N D L O C A T I O N OF S T R E S S P A N E L S A D J A C E N T T O A D A M S I S L A N D . W I N T E R 1 9 8 4 1 8 5 STRESS MEASUREMENT Stress PanelsIn November 1984 six l-m wide by l-m deep panel-type transducers
("IDEAL") were installed in a 75-m wide array southeast of the island, about 75 m from shore (Figure 4). ,Each panel was sectored horizontally into two 5 0 r m deep strips. Owing to problems with the recording system no record was obtained until April 1985. From this time, however, a 3-week long record with a 15-minute recording frequency was obtained.
The record from the most westerly panel is presented in Figure 5. Shown on this plot are actual stress levels, and a 48-hour sliding mean of stress for the upper (0-0.5 m) and lower (0.5-1.0 m) sectors of the panel. Also shown on Figure 5 is an envelope of the predicted tidal range. There is apparently a strong short-term periodicity (12.5 hours) in the results, which corresponds to the semi-diurnal tidal cycle, the stress peaks corresponding to the low tide. All of the panels showed a
A P R I L M A Y 1 9 8 5 F I G U R E 5 R E C O R D F R O M W E S T E R N - M O S T S T R E S S P A N E L A N D T I D A L R A N G E P R E D I C T E D F R O M D U N D A S H A R B O U R . A P R I L - M A Y 1 9 8 5
similar periodicity. It can also be seen that the amplitude of the stress variation increased and decreased with the tidal range. The 48-hour sliding mean stress value increased with increasing tidal range. Measurements of displacements showed that the average horizontal
ice-movement rate was directly proportional to the tidal range, although
with considerable scatter (Figure 3). Therefore the higher mean stresses
could be associated with higher ice velocities. An unusual aspect of the
panel results is that the stress in the upper sector is lower than in the lower sector. At the time of the site visit in mid-May, 1985 it was observed that a crack had formed in the ice immediately adjacent to the panel. The crack extended to a depth of about 20 cm. The presence of this crack could explain the lower surface stress. Similar stress distributions and cracks were observed at the other panels.
Biaxial Stress Transducers
A number of small 501mn diameter cylindrical transducers supplied by IRAD
Gage (type VBS-3) were used to measure in-situ stresses in the ice. These transducers are capable of determining magnitude and direction of the principal stresses in the plane of the ice cover. With corrections for temperature and drift, accuracy of the stress measurements is
For the 1984185 winter eight gauges were installed initially around the southern perimeter of the island at a distance of 80 to 100 m. Logging started on November 21 and continued at 4-hour intervals until December 4 when the batteries failed. In March, 1985 seven additional gauges were installed to provide a network completely encircling the island. The normal installation depth was 0.2 m below the ice surface. The logging
system was reactivated on March 14 and operated until April 6. A final set of readings at half-hour intervals was obtained during the period Nay 15 to 18, after which the gauges were removed from the ice. An
almost continuous record of stress was obtained from November to Nay, with a few interruptions. The stress record from March 14 to April 6,
1985 for transducer #505 is shown in Figure 6. These results had a semi-diurnal cyclic behaviour similar to that of the stress panels. The major principal stress at this location was oriented towards the north
(PHI = '0 in Figure 6). There is also a trend of increasing stress with
increasing ice temperature. At a few locations transducers were
installed at depths of 0.7 and 1.2 m. The transducers at 0.2 and 0.7 m showed similar stress magnitude and direction. The transducers at 1.2 m showed negligible stresses.
-90 1 t I t I I 14 19 24 29 3 MARCH APRIL 1985 F I G U R E 6 B l A X l A L S T R E S S R E C O R D F R O M T R A N S D U C E R N o . 5 0 5 ( S E E F I G . 7 FOR L O C A T I O N ) A T A D E P T H OF 0.2 rn F O R P E R I O D OF 1 4 M A R C H TO 7 A P R I L , 1 9 8 5 N O T E : P H I I S O R I E N T A T I O N OF M A J O R P R I N C I P A L S T R E S S F R O M N O R T H
STRESS SCALE: 100 kPa FORCE SCALE: 2 0 MN F I G U R E 7 " S U R F A C F I N T E G R A L M F T H O D " F O R C A L C U L A T I O N O F T O T A L L O A D O N A D A M S I S L A N D . 31 M A R C H 1985 A T 13:OO Discussion of S t r e s s Measurements
The " s u r f a c e i n t e g r a l method" suggested by Johnson (1983) was a p p l i e d t o t h e s t r e s s e s measured w i t h t h e b i a x i a l t r a n s d u c e r s t o c a l c u l a t e t h e g l o b a l load a c t i n g on t h e i s l a n d . P r i n c i p a l s t r e s s e s a t depths of 0.2 and 0.7 m showed s i m i l a r o r i e n t a t i o n and magnitude. Transducers a t a depth of 1.2 m measured n e g l i g i b l e stresses. Therefore t h e average s t r e s s i n t h e t o p 1 m of t h e i c e cover was used t o c a l c u l a t e t h e t o t a l load i n t h e i c e . Ten t r a n s d u c e r s were d i s t r i b u t e d i n a c i r c u l a r a r r a y around t h e i s l a n d (Figure 7). A ten-sided polygon was drawn t o r e p r e s e n t a c i r c l e (dashed l i n e of Figure 7) p a s s i n g through a l l t h e t r a n s d u c e r s d i s t r i b u t e d around t h e i s l a n d . For each s i d e of t h e polygon t h e normal and s h e a r stresses, and consequently t h e f o r c e s , were determined. The v e c t o r sum of t h e f o r c e s on t h e s i d e s of t h e polygon i s t h e t o t a l i c e f o r c e on t h e i s l a n d . For t h e stress shown i n Figure 7 on March 3, 1985 a t 1300 hours t h e t o t a l f o r c e was 64 MN t o t h e northwest. S i x hours l a t e r , t h e f o r c e was reduced t o 59 MN and d i r e c t e d towards t h e w e s t .
The results of the stress panels were also used to calculate the total ice load on the island. The results of the three panels that were
operational over the 3-weeks measuring period were averaged to obtain an inferred global load on the 200- wide island. Only the stress in the top 1 m of the ice cover was considered, The total load had a
semi-diurnal cyclic character. The maximum load was 62 MN and occurred
on May 5 at 1900 hours. Over the 3-weeks period the calculated total
load was never less than 5 MN and averaged about 20 MN.
The 48-hour sliding mean stress averaged through the top 1 m of the ice cover (Figure 5) can be compared to average inferred movement rates. At the time of maximum tide range on May 7 the average stress was about 200 kPa, while at the times of minimum tide range, April 29 and May 13, the average stress was about 100 kPa. Fox the tidal range on these
dates, and using the ice-displacement rate-tide relationship in Figure 3, the corresponding movement rates would be about 200 and 50 mm/day
respectively. Using the reference stress method (Sanderson, 1984) on
columnar grained sea ice (salinity 5%, average temperature -7OC), the
stress at the higher and lower rates would be 130 and 80 kPa
respectively. .These calculated values are substantially lower than the
measured ones. The calculated values, however, are for the full depth of
the ice cover, in this case 1.65 m. Since our measurements showed that
almost all of the stress is taken in the top 1 m of the ice cover the
calculated stresses should be multiplied by a factor of 1.65. Therefore
the calculated stresses become 210 and 130 kPa, more comparable to the measured values.
CONCLUSIONS
Horizontal movements of the ice cover in Navy Board Inlet exhibit a consistent pattern of northward movement into Lancester Sound, with larger magnitudes at the north end. Seasonal movement rates average 0.1 m/day, but the maximum daily rate reached 0.3 to 0.4 mlday. Oceanographic and meteorological factors play an important part in characterizing ice movements, but the exact nature of this relation has not yet been established.
The measured stresses in the ice cover are related to daily and fortnightly tidal variations. This relationship can be explained in
terms of h o r i z o n t a l ice-cover movement r a t e s . Using i n f e r r e d movement r a t e s t h e stresses p r e d i c t e d by t h e r e f e r e n c e s t r e s s method a g r e e w i t h t h e values of measured stresses.
The maximum t o t a l load g e n e r a t e d on t h e i s l a n d was 64 MN, e q u i v a l e n t t o an average stress of 320 kPa over t h e t o p 1 m of t h e i c e t h i c k n e s s and 200 m width. Local p r e s s u r e s o v e r an a r e a of 0.5 m2 reached a maximum of 500 kPa. While t h e maximum i c e load was n o t l a r g e , a continuous load a t l e a s t o n e - q u a r t e r of t h e maximum p e r s i s t e d f o r weeks and perhaps months.
ACKNOWLEDGEMENTS
The f i n a n c i a l support of t h e Panel on Energy Research and Development is g r a t e f u l l y acknowledged, a s i s t h e l o g i s t i c s u p p o r t provided by t h e P o l a r C o n t i n e n t a l Shelf P r o j e c t . The u s e of t h e f a c i l i t i e s a t Borden S t a t i o n owned by t h e Canada Department of F i s h e r i e s and Oceans, and t e c h n i c a l support i n t h e f i e l d provided by t h e A r c t i c Research Establishment, Pond I n l e t , g r e a t l y f a c i l i t a t e d t h e work. A s s i ~ t a n c e i n p r e p a r a t i o n s and i n t l ~ t ? f i e l d provlcted by 1'. Jochmann and W. Neper of t h e Ha~nburgCuche
Schiffbau-Versuchsanstalt GmbH., (HSVA), J.D. Neil, Technical O f f i c e r ,
National Research Council of Canada, A.H. Headly, Atmospheric Environment S e r v i c e , Environment Canada, and C. Lebine, Campbell S c i e n t i f i c ,
Edmonton, A l b e r t a i s g r a t e f u l l y acknowledged. F i n a n c i a l support of t h e German M i n i s t r y of Research and Technology made p o s s i b l e t h e
p a r t i c i p a t i o n of HSVA i n t h e p r o j e c t .
REFERENCES
Cushon, J.D. and Sykes, J.F., 1985. Modelling and s e n s i t i v i t y a n a l y s i s of ice motion n e a r Adams I s l a n d . Report on Waterloo Research I n s t i t u t e P r o j e c t No. 308-12, U n i v e r s i t y of Waterloo, Waterloo, O n t a r i o , J u l y 1985.
Danielewicz, B.W., Metge, M., and Dunwoody, A.B., 1983. On e s t i m a t i n g l a r g e s c a l e ice f o r c e s from d e c e l e r a t i o n of i c e f l o e s . VTT
Symposium 38, 7 t h I n t e r n a t i o n a l Conference on P o r t and Ocean Engineering under A r c t i c Conditions, H e l s i n k i , Finland, Vol. 4,
p. 537-546.
Frederking. R., Sanderson, T., Wessels, E., and Inoue, M., 1983. I c e behaviour around a small A r c t i c i s l a n d . VTT Symposium 28, 7th
International Conference on Port and Ocean Engineering under Arctic Conditions, lklsinki, Finland, Vol. 2, p. 875-887.
Frederking, R.M.W., Sayed, M., Wessels, E., Child, A.J., and
Bradford, D., 1984. Ice interaction with Adams Island, winter 1982-1983. Proceedings, IAHR Lee Symposium, Hamburg, Vol. 3, p. 187-201.
Frederking, R., Wessels, E., Maxwell, J.B., Prinsenberg, S., and Sayed, M., 1986. Ice pressures and behaviour at Adams Island, winter 1983184. Canadian Journal of Civil Engineering, Vol. 13(2), p. 140-149.
Hawkins, J.R., James, D.A., and Der, C.Y., 1983. Design, construction and installation of a system to measure environmental forces on a caisson retained island. VTT Symposium 38, 7th International Conference on Port and Ocean Engineering under Arctic Conditions, Helsinki, Finland, Vol. 4, p. 770-779.
Johnson, J.B., Cox, G.F.N., and Tucker, W.B., 1985. Kadluk Ice Stress Measurement Program. 8th International Conference on Port and Ocean Engineering under Arctic Conditions (POAC), Narssarssuaq, Greenland, 1985, Vol. 1, p. 88-100.
Johnson, J.G., 1983. A surface integral method for determing ice loads on offshore structures from in-situ measurements. Annals of
Glaciology, Vol. 4, p. 124-128.
Kovacs, A. and Sodhi, D., 1981. Sea ice piling at Fairway Bock, Bering Strait, Alaska: Observations and theoretical analysis. 6th
International Conference on Port and Ocean Engineering under Arctic Conditions, Quebec, Vol. 2, p. 985-1000.
Langleben, M.P., 1986. On the thermal diffusivity of sea ice. IAHR Symposium on Ice, Iowa City, August 18-22, 1986.
Metge, M., 1976. Ice conditions and ice defence at Netserk B-44 and Adgo P-25 during the winter of 1974-75. Arctic Petroleum Operators' Association, Calgary, APOA Report No. 104-1.
Pilkington, R., Blanchet, D., and Metge, M., 1983. Full-scale
measurements of ice forces on an artificial island. VTT Symposium 38, 7th International Conference on Port and Ocean Engineering under Arctic Conditions, Helsinki, Finland, Vol. 4, p. 818-834.
Sanderson, T.J.O., 1984. Theoretical and measured ice forces on wide structures. Proceeding, IAHR ice Symposium, Hamburg. Vol. 4, p. 151-207.
Semeniuk, A., 1977. Ice pressure measurements at Arnak 6 3 0 and Kannerk G42. Arctic Petroleum Operators' Association, Calgary, APOA Report No. 122-1.
Shirasawa, K., 1985. The effects of water drag and ocean currents on ice displacements at Adams Island, N.W.T., Winter 1984185.
Unpublished Report of Centre for Cold Ocean Resources Engineering, Memorial University, St. John's, Newfoundland, December 1985. On
file, Institute for Research in Construction, National Research Council of Canada, Ottawa.
Stander, E., 1986. The measurement and analysis of strainmeter data from A d a m Island, November 1984 to January 1985. Unpublished Report of Centre for Cold Ocean Resources Engineering, Memorial University, St. John's, Newfoundland. On file, Institute for Research in Construction, National Research Council of Canada, Ottawa.
To, N.M., 1985. A method of calculating the global ice load on Esso's caisson retained island at Kadluk. 8th International Conference on Port and Ocean Engineering under Arc tic Condit ions, Greenland, Vol. 2, p. 667-676.
T h i s paper i s being d i s t r i b u t e d i n r e p r i n t form by t h e I n s t i t u t e f o r Research i n C o n s t r u c t i o n . A l i s t of b u i l d i n g p r a c t i c e and r e s e a r c h p u b l i c a t i o n s a v a i l a b l e from t h e I n s t i t u t e may be o b t a i n e d by w r i t i n g t o t h e P u b l i c a t i o n s S e c t i o n , I n s t i t u t e f o r Research i n C o n s t r u c t i o n , N a t i o n a l Research C o u n c i l of C a n a d a , O t t a w a , O n t a r i o , K1A OR6.
Ce document e s t d i s t r i b u g sous forme de t i r e - a - p a r t p a r 1 ' I n s t i t u t de r e c h e r c h e e n c o n s t r u c t i o n . O n peut o b t e n i r une l i s t e d e s p u b l i c a t i o n s de 1' I n s t i t u t p o r t a n t s u r l e s t e c h n i q u e s ou l e s r e c h e r c h e s e n m a t i s r e d e bdtiment e n e c r i v a n t 3 l a S e c t i o n d e s p u b l i c a t i o n s , I n s t i t u t de r e c h e r c h e en c o n s t r u c t i o n , C o n s e i l n a t i o n a l d e r e c h e r c h e s du Canada, Ottawa ( O n t a r i o ) , KIA 0R6.