BCL2A1 is a lineage-specific antiapoptotic melanoma
oncogene that confers resistance to BRAF inhibition
The MIT Faculty has made this article openly available.
Please share
how this access benefits you. Your story matters.
Citation
Haq, R., S. Yokoyama, E. B. Hawryluk, G. B. Jonsson, D. T. Frederick,
K. McHenry, D. Porter, et al. “BCL2A1 is a lineage-specific
antiapoptotic melanoma oncogene that confers resistance to BRAF
inhibition.” Proceedings of the National Academy of Sciences 110,
no. 11 (March 12, 2013): 4321-4326.
As Published
http://dx.doi.org/10.1073/pnas.1205575110
Publisher
National Academy of Sciences (U.S.)
Version
Final published version
Citable link
http://hdl.handle.net/1721.1/80720
Terms of Use
Article is made available in accordance with the publisher's
policy and may be subject to US copyright law. Please refer to the
publisher's site for terms of use.
BCL2A1 is a lineage-specific antiapoptotic melanoma
oncogene that confers resistance to BRAF inhibition
Rizwan Haqa,b,1, Satoru Yokoyamab,c,1, Elena B. Hawrylukb, Göran B. Jönssond, Dennie Tompers Fredericke, Kevin McHenryf, Dale Porterf, Thanh-Nga Tranb, Kevin T. Loveg, Robert Langerg,h, Daniel G. Andersong,h,
Levi A. Garrawayi, Lyn McDivitt Duncanj, Donald L. Mortonk, Dave S. B. Hoonl, Jennifer A. Wargoe, Jun S. Songl,m,2,
and David E. Fishera,b,2
aDivision of Medical Oncology, Department of Medicine,bDermatology and Cutaneous Biology Research Center,eSurgery, andjPathology Service,
Massachusetts General Hospital, Boston, MA 02115;cDivision of Pathogenic Biochemistry, Institute of Natural Medicine, University of Toyama, Toyama 930-0194,
JapandDepartment of Oncology, Clinical Sciences, Lund University, SE-221 00 Lund, Sweden;fNovartis Institutes of Biomedical Research, Oncology Drug
Discovery, Cambridge, MA 02139;gDepartment of Chemical Engineering, Massachusetts Institute of Technology, Cambridge, MA 02139;hDavid H. Koch
Institute for Integrative Cancer Research, Harvard-MIT Division of Health Sciences and Technology, Massachusetts Institute of Technology, Cambridge, MA 02139;iBroad Institute of Harvard and MIT, Cambridge, MA 02142;kDepartment of Molecular Oncology, John Wayne Cancer Institute, Santa Monica, CA
90404;lInstitute for Human Genetics; andmDepartment of Epidemiology and Biostatistics, University of California, San Francisco, CA 94107
Edited by Antoni Ribas, Ronald Reagan UCLA Medical Center, Los Angeles, CA, and accepted by the Editorial Board December 11, 2012 (received for review April 3, 2012)
Although targeting oncogenic mutations in the BRAF serine/threo-nine kinase with small molecule inhibitors can lead to significant clinical responses in melanoma, it fails to eradicate tumors in nearly all patients. Successful therapy will be aided by identification of intrinsic mechanisms that protect tumor cells from death. Here, we
used a bioinformatics approach to identify drug-able,“driver”
oncogenes restricted to tumor versus normal tissues. Applying this method to 88 short-term melanoma cell cultures, we show that the
antiapoptotic BCL2 family memberBCL2A1 is recurrently amplified
in∼30% of melanomas and is necessary for melanoma growth.
BCL2A1 overexpression also promotes melanomagenesis of
BRAF-immortalized melanocytes. Wefind that high-level expression of
BCL2A1 is restricted to melanoma due to direct transcriptional control by the melanoma oncogene MITF. Although BRAF inhibitors lead to cell cycle arrest and modest apoptosis, wefind that apo-ptosis is significantly enhanced by suppression of BCL2A1 in
mela-nomas withBCL2A1 or MITF amplification. Moreover, we find that
BCL2A1 expression is associated with poorer clinical responses to BRAF pathway inhibitors in melanoma patients. Cotreatment of melanomas with BRAF inhibitors and obatoclax, an inhibitor of BCL2A1 and other BCL2 family members, overcomes intrinsic re-sistance to BRAF inhibitors in BCL2A1-amplified cells in vitro and in vivo. These studies identify MITF-BCL2A1 as a lineage-specific on-cogenic pathway in melanoma and underscore its role for im-proved response to BRAF-directed therapy.
H
igh-resolution somatic copy number and genome sequencing of cancer have identified key driver mutations that form the basis for rationally targeted therapeutics. In melanoma, the most commonly mutated molecule, the protein kinaseBRAF gene, is mutated in ∼50% of cases. The majority of BRAF mutations result in the substitution of valine by glutamic acid at position 600 (termed V600E), leading to a∼500-fold increase in its kinase activity (1). BRAF(V600E) promotes oncogenesis through acti-vation of the MEK1/2 kinases and the MAPK signal transduction cascade. BRAF has been shown by overexpression and knock-down experiments to be a critical mediator of melanomagenesis. Introduction of mutated BRAF into immortalized melanocytes leads to anchorage-independent growth and tumors in mice. How-ever, oncogenesis induced by BRAF requires other genetic alter-ations, because oncogenic BRAF induces cellular senescence in primary melanocytes. In mice, dysregulation of BRAF, in co-operation with inactivation of the tumor suppressorsPTEN or INK4A, leads to development of melanoma with short latency (2, 3). Conversely, suppression of BRAF by RNA interference or small molecule inhibitors leads to cell cycle arrest and apoptosis in preclinical models (4–7). BRAF mutations generally predict response to the BRAF inhibitor vemurafenib (PLX4032), yet some BRAF mutant melanoma cell lines are relatively resistant (8–10). Treatment of most patients whose tumors have the BRAF(V600E)mutation also leads to tumor regression and improved survival (11). However, the duration of such responses is highly variable and virtually all patients eventually relapse (11–13), indicating that resistance mechanisms limit both the magnitude and dura-tion of clinical response.
Here we undertook an integrated bioinformatic and functional analysis to identify genomically amplified therapeutic targets in melanoma and other malignancies. We identify the antiapoptotic factor BCL2A1 as a unique melanoma oncogene located on chromosome 15q. This region is significantly amplified in ∼30– 40% of melanomas by large-scale copy number analyses and was previously observed to correlate with resistance of melanomas to chemotherapy (14). Unexpectedly, we find that high-level ex-pression ofBCL2A1 is largely restricted to melanomas compared with other tumor types. The lineage-specific expression was at-tributable to its direct regulation by the melanoma oncogene MITF. BCL2A1 is essential for survival in those melanomas in which it is amplified, and its overexpression is shown to promote tumorigenesis in cooperation with BRAF(V600E). Although BRAF inhibitors lead to cell cycle arrest and modest apoptosis, apoptosis is significantly enhanced by suppression of BCL2A1 in melanomas harboringBCL2A1 or MITF amplification. Finally, the combination of a BRAF inhibitor and obatoclax, an inhibitor of BCL2 family members including BCL2A1 currently in clinical trials, enhances apoptosis and tumor regression in vitro and in vivo.
Results
Bioinformatic Analysis Identifies Targets of Genomic Amplification.
High-resolution somatic copy number amplifications combined with gene expression profiles have been previously applied to identify causal oncogenes in a variety of malignancies (15–21). However, considerable obstacles exist to translation of these analyses to the clinic. Reasoning that the ability to identify amplified genes that are restricted to tumor cells compared with host tissues could aid the development of targeted therapy with decreased risk of toxicity, we performed a bioinformatics screen for candidate oncogenes in several tumor types, including breast,
Author contributions: R.H., S.Y., D.T.F., and D.E.F. designed research; R.H., S.Y., E.B.H., D.T.F., and J.S.S. performed research; R.H., S.Y., K.M., T.-N.T., K.T.L., R.L., D.G.A., L.A.G., L.M.D., D.L.M., D.S.B.H., and J.S.S. contributed new reagents/analytic tools; R.H., S.Y., G.B.J., D.T.F., K.M., D.P., L.M.D., D.S.B.H., J.A.W., J.S.S., and D.E.F. analyzed data; and R.H., S.Y., J.S.S., and D.E.F. wrote the paper.
The authors declare no conflict of interest.
This article is a PNAS Direct Submission. A.R. is a guest editor invited by the Editorial Board.
1R.H. and S.Y. contributed equally to this work.
2To whom correspondence may be addressed. E-mail: dfisher3@partners.org or SongJ@
humgen.ucsf.edu.
This article contains supporting information online atwww.pnas.org/lookup/suppl/doi:10.
1073/pnas.1205575110/-/DCSupplemental.
GENET
glioblastoma, colon, and melanoma for which comprehensive genomic datasets were publically available. For each tumor type, we compared gene expression to a pooled set of 72 normal tissues and identified genes whose expression was significantly higher in cancer compared with normal tissues [at false discovery rate (FDR)= 0] and that were significantly genomically amplified by the GISTIC algorithm (22). We considered genomic copy number of 3 or more as significant, given that this level of amplification can meaningfully affect protein expression and sensitivity to knockdown (15). The analysis yielded several known oncogenes includingERBB2 (23) and CCND1 in breast cancer (SI Appendix,
Table S1). In melanoma, eight genes overlapped between the
two analyses (Fig. 1A andSI Appendix, Fig. S1A), including the
lineage-specific transcription factor MITF, consistent with its previously described amplification (21). Of particular interest was BCL2A1, one of six antiapoptotic BCL2 family members that has not been previously described as a human oncogene (24). Other BCL2 family members have been described as oncogenes by amplification or translocation, and several approaches to phar-macologically target these proteins, including BCL2A1, are in clinical development (25–29). To confirm these results, we also evaluated an independent microarray dataset (30).BCL2A1 and MITF mRNA were higher in melanoma compared with skin, which predominantly consists of nonmelanocytes (SI
Appen-dix, Fig. S2). To confirm that BCL2A1 genomic amplification
occurs within primary tumor specimens, in addition to the early passage melanoma cultures we examined above, we ex-amined data from The Cancer Genome Atlas Project (www.
broadinstitute.org/tcga/home). This dataset demonstrated
that bothBCL2A1 and MITF were amplified significantly only in melanoma and that 30.8% of primary melanoma biopsies hadBCL2A1 amplification.
The genomic region 76–100 Mb of chromosome 15q encom-passingBCL2A1 was amplified in 28 of 88 melanoma cell lines (31.8%), early passage tumors, and primary specimens evaluated (GISTIC analysis,q = 6.7 × 10⁻⁶) (31, 32) (Fig. 1B). Because SNP arrays are only semiquantitative with respect to copy number, we confirmed BCL2A1 copy number using genomic quantitative PCR (SI Appendix, Fig. S3A). Genomic amplification of BCL2A1
was observed in melanoma and was not seen in other tumor types (SI Appendix, Fig. S1B). Different parts of the amplicon were mainly coamplified, with an 80% overlap among samples amplified at different loci in two independent datasets (SI Appendix,
Fig. S1C and D). Afterfiltering undetectable or weakly expressed
genes (SI Appendix, Fig. S1E), only four genes within the 15q amplicon were expressed twofold or greater in amplified versus unamplified cells, including BCL2A1 (Fig. 1B). BCL2A1 mRNA
(SI Appendix, Fig. S3B) or protein (SI Appendix, Fig. S3D)
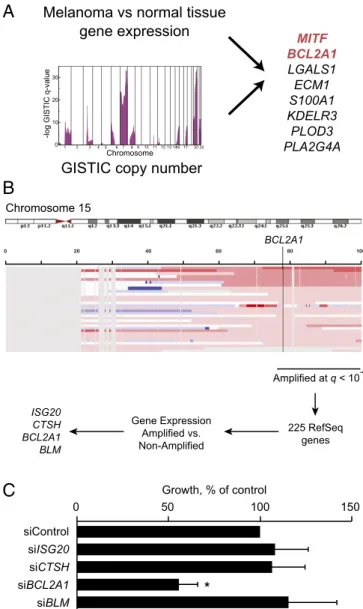
cor-related well with its amplification level. There was a significant correlation between mRNA expression and protein expression (Pearson correlationR = 0.88, P = 0.03). We evaluated whether BCL2A1 or other candidate genes were required for proliferation of an amplified melanoma cell line, M14. Knockdown of BCL2A1 by siRNA significantly reduced proliferation, whereas knock-down of each of the other genes did not affect growth (Fig. 1C), despite>80% knockdown of mRNA (SI Appendix, Fig. S4A) or protein (SI Appendix, Fig. S4B). Similar results were seen in an additional 15q-amplified cell line (SI Appendix, Fig. S4C). We were unable to reliably detect Cathepsin H (CTSH) by validated antibodies, although mRNA was significantly suppressed at 72 h. Thus, we cannot exclude the possibility that CTSH is functionally required for the growth of 15q-amplified melanoma cells, in addition to BCL2A1, despite the absence of a phenotype under conditions where its mRNA levels are significantly suppressed. We did not detect any relationship betweenBCL2A1 amplifi-cation andMITF amplification (Fisher’s exact test, P = 0.06) or BRAF mutations (Wilcoxon test,P = 0.30), although MITF am-plification correlated with higher BCL2A1 expression (see below).
BCL2A1 Is Dysregulated in Melanoma.To examine whether BCL2A1
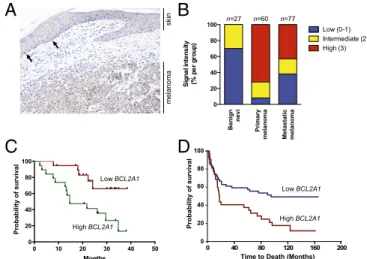
expression was increased in melanomas compared with normal melanocytes (and not simply a marker of the melanocytic lineage), we stained primary human melanomas with a BCL2A1-specific monoclonal antibody (SI Appendix, Fig. S5). In a representative case, we observed that BCL2A1 was highly expressed in the melanoma but had much lower expression in normal melanocytes of adjacent skin (Fig. 2A). Using a tumor progression tissue array consisting of benign nevi, primary cutaneous melanomas, and melanoma metastases, we observed no or low expression in 70% of nevi (n = 27), and no nevi had robust (3+) staining (Fig. 2B and Materials and Methods). In contrast, robust expression was observed in 72% of primary melanomas (n = 60, P < 0.0001 for nevi versus melanoma, Fisher’s exact test). A comparison of an independent set of primary melanoma and benign skin nevi (30) also demonstrated significantly increased expression of BCL2A1 in melanoma (P = 5.4 × 10⁻¹⁵, Wilcoxon rank sum test). We also
A
C
B
siControl siISG20 siCTSH siBCL2A1 siBLM * Growth, % of controlMelanoma vs normal tissue
gene expression
Chromosome 15
GISTIC copy number
0 50 100 150
Fig. 1. Scheme for identification of unique amplified oncogenic targets. (A) Diagram showing intersection of amplified genes that were significantly increased in melanoma compared with pooled normal tissues. (B) Approach for identification of oncogenes located on chromosome 15q. Eighty-eight melanomas with copy number analysis and gene expression were analyzed by GISTIC analysis andfiltered for higher expression in 15q-amplified versus nonamplified melanomas (P < 0.05, Wilkcoxon test). (C) Dependence of M14 melanoma cell line on BCL2A1 and other candidate genes located in the 15q amplicon. M14 cells were transfected with siRNA targeting BCL2A1 or con-trol. Colony formation is normalized to control siRNA 72 h after transfection. Data represent an average of at least six independent experiments with reported SE. *P< 0.05 versus siControl.
examined whether expression of BCL2A1 predicted prognosis. We found that in a series of stage III and stage IV melanomas, high BCL2A1 mRNA (Fig. 2C) or protein (Fig. 2D and SI
Ap-pendix, Fig. S6) expression were associated with decreased survival
after diagnosis. Collectively, these data suggest an important role of BCL2A1 dysregulation in melanoma pathogenesis.
BCL2A1 Is a Melanoma Oncogene.To evaluate the functional
re-quirement for BCL2A1 in melanoma, we suppressed BCL2A1 by siRNA and evaluated growth in a colony formation assay. A breast cancer cell line, MCF7, which does not express BCL2A1, was not sensitive to BCL2A1 knockdown (Fig. 3A). However, melanomas with 15q amplifications were dependent on BCL2A1. In contrast, BCL2A1-nonamplified melanomas were not de-pendent on BCL2A1, despite efficient knockdown (SI Appendix,
Fig. S3C).BCL2A1 knockdown by shRNA (SI Appendix, Fig. S4D)
also significantly impaired the tumorigenicity of M14 melanoma cells in mouse xenografts (Fig. 3B). To evaluate whether BCL2A1 can promote transformation, we used a previously described assay using genetically immortalized human melanocytes that exhibit soft-agar clonogenic growth upon oncogenic transformation (21). BCL2A1 expression (Fig. 3C) together with BRAF(V600E) effi-ciently promoted growth of these cells in soft agar compared with control-infected cells (Fig. 3D).
Lineage Restricted BCL2A1 Expression in Melanoma Owing to Its
Direct Regulation by MITF. We next evaluated expression of
BCL2A1 across a panel of melanoma and other tumor cell lines. The expression ofBCL2A1 was strikingly restricted to melanomas compared with tumors from other tissue types (Fig. 4A; P = 6.05 × 10⁻¹⁰, Wilcoxon rank sum test). These results were confirmed in other datasets (Fig. 4B; P = 2.99 × 10⁻⁶, t test). Consistent with prior reports, moderate expres-sion was found in some lymphoid malignancies (33) in a larger collection of 319 cancer cell lines, althoughBCL2A1 was not amplified in these tissues (SI Appendix, Fig. S1B).
We identified transcription factors whose expression was as-sociated with BCL2A1 expression (SI Appendix, Table S2). Levels ofMITF were strongly correlated with BCL2A1 expres-sion (Pearson correlation 0.56, P = 4.4 × 10⁻⁹). Moreover, BCL2A1 was correlated with other genes known to be directly regulated byMITF, such as SILV, TYR, and DCT (34–36), but not other highly expressed genes (SI Appendix, Fig. S7C).MITF
itself has been previously identified as a lineage-specific onco-gene that regulates melanoma growth and survival (21). Al-though it is amplified in only ∼15–20% of melanomas, it is essential for the survival of most melanomas. Although MITF directly regulates the BCL2 gene (37), which is functionally re-lated to BCL2A1, MITF deficiency produces a significantly more severe melanocyte defect (embryonic melanocyte lineage loss) than BCL2 deficiency (postnatal melanocyte loss), suggesting that other MITF target genes contribute importantly to MITF’s melanocytic survival phenotype. Unlike other mammalian spe-cies, the mouse genome contains four closely related homologs of BCL2A1 (38), precluding straightforward analysis of its ge-netic contribution to the murine melanocyte lineage.
To evaluate whether MITF is sufficient to activate BCL2A1, we treated primary melanocytes with the cAMP agonist, for-skolin, which increased MITF expression within 2–3 h (39) (Fig. 4C). BCL2A1 was also induced by forskolin and was delayed relative to MITF, similar to another direct MITF target,TRPM1. Forced lentiviral overexpression of MITF in melanocytes was also sufficient to induce BCL2A1 mRNA (SI Appendix, Fig. S7A). To evaluate whether MITF is required forBCL2A1 expression we suppressed endogenousMITF by siRNA in primary melanocytes and several melanoma cell lines (Fig. 4D). BCL2A1 mRNA was significantly reduced in all cells examined. Similar results were seen at the protein level using two lentiviral-delivered shRNAs targeting MITF (Fig. 4E). MITF knockdown suppressed BCL2 in some but not all melanocytic cells and did not suppress other
A
B
D
C
Benign nevi Primarymelanoma Metastatic melanoma 0 20 40 60 80 100 Low (0-1) Intermediate (2) High (3) n=27 n=60 n=77 S igna lint ens ity (% pe r gr ou p) melanoma skin 0 10 20 30 40 50 0 20 40 60 80 100 0 20 40 60 80 100 Low BCL2A1 High BCL2A1 Months 0 40 80 120 160 200
Time to Death (Months)
Probability of survival
Probability of survival
Low BCL2A1
High BCL2A1
Fig. 2. BCL2A1 is dysregulated in melanoma. (A) A primary melanoma with overlying attenuated overlying epidermis was stained with anti-BCL2A1. The arrows show examples of intraepidermal melanocytes, which uniformly have weak BCL2A1 staining, whereas most melanoma cells have robust BCL2A1 expression. (B) Melanoma progression array showing correlation of BCL2A1 staining with tumor progression. High BCL2A1 mRNA (C) or staining (D) is associated with poorer overall survival of stage III and stage IV melanoma patients (P= 0.0076 and P = 0.0064, respectively).
0 50 100 150 siControl siBCL2A1 Unamplified melanoma 15q amplified melanoma *** *** ***
A
0 5 10 15 0 200 400 600 *** Sites injected Tumors formed 5 5 5 2C
D
B
Ve c to r HA-BCL2A1 SoftAgar Growth (LU)
T u mor volume (mm3) Growth, % of control HA α-tubulin BCL2A1 Ve c to r B CL2A1 shControl sh BCL2A1 MCF7 UACC257 UACC62 A375 M14 501mel WM3619
Fig. 3. Requirement of BCL2A1 for melanoma growth. (A) Colony forma-tion assay of cell lines 72 h after transfecforma-tion with siRNA targeting BCL2A1. Results are normalized to control siRNA. Data represent an average of at least three independent experiments with SE. ***P< 0.001 compared with siControl. (B) Effect of BCL2A1 knockdown on growth of M14 melanoma xenotransplants. Volume of tumors was determined 12 d after injection. Representative tumors from mice are shown for each shRNA. (C) Expression of HA-tagged BCL2A1 in pmel*BRAF(V600E) (21) detected by Western blotting. (D) BCL2A1 overexpression promotes soft-agar growth in oncogenic BRAF-transformed melanocytes. Cell number was determined after 2 wk.
GENET
antiapoptotic BCL2 family members (BCL2L1, BCL2L2, or MCL1) (SI Appendix, Fig. S7B).
We compared the promoters ofBCL2A1 in mammalian species (Fig. 4F) and identified putative MITF binding sites (E-boxes), located 7 kb upstream of the transcriptional start site and within the 50untranslated region. These sequences were found in all species examined except Mus musculus, which as stated above has four distinctly encodedBCL2A1 genes (38). To detect in vivo occupancy of MITF at these binding sites, we performed ChIP using primers spanning each region. Strong MITF binding was detected at−7 kb at levels similar to another MITF target, ty-rosinase (Fig. 4G). Weak binding was detected at the 50UTR site. We also evaluated whetherBCL2A1 transcription was dependent on the conserved E-boxes and observed that mutation of the E-box at−7 kb suppressed basal activity of the promoter by 44% com-pared with the wild-type promoter (Fig. 4H). shRNA targeting of MITF reduced BCL2A1 promoter activity by 50% in an E-box– dependent manner. Conversely, overexpressed MITF increased BCL2A1 promoter activity, also in an E-box–dependent fashion.
BCL2A1 Confers Resistance to BRAF Inhibitors.We evaluated geno-mic amplification of the prosurvival BCL2 family in melanoma and other cancer types. Both MCL1 and BCL2A1 were genomically amplified in subsets of melanomas (SI Appendix, Fig. S8). Whereas MCL1 is known to be amplified in multiple human tumor types (15), BCL2A1 amplification is seen exclusively in melanoma. Because amplification of BCL2 family members may limit the effectiveness of chemotherapy or targeted therapy, we evaluated whether BCL2A1 might mediate relative intrinsic resistance to BRAF inhibitors (refer to SI Appendix, Table S3 for BRAF mutation and BCL2A1 amplification of cell lines used). In a BCL2A1-unamplified BRAF-mutant cell line, overexpression of BCL2A1 inhibited the antiproliferative effect of PLX4720 (SI
Appendix, Fig. S9A) or chemotherapy (SI Appendix, Fig. S10E)
and protected from apoptosis (Fig. 5A) but not cell cycle arrest
(SI Appendix, Fig. 10 A and B). BCL2A1 did not affect the ability
of BRAF pathway inhibitors to suppress ERK activity (Fig. 5B). Conversely, in aBCL2A1-amplified cell line that also contains an oncogenic mutation in BRAF, knockdown ofBCL2A1 signifi-cantly increased sensitivity to PLX4720 (Fig. 5C and D andSI
Appendix, Fig. S9B). Similar results were obtained with the
structurally unrelated MEK inhibitor, GSK1120212, diminishing the likelihood of off-target effects (Fig. 5A and D andSI Appendix,
Fig. S10D). To further minimize the likelihood of off-target
effects, we knocked down BCL2A1 using individual, rather than pooled, siRNAs (SI Appendix, Fig. S9F). The sensitization to apoptosis correlated with the degree ofBCL2A1 knockdown by each siRNA. The sensitivity to PLX4720 in a cell line carrying wild-type BRAF and noBCL2A1 amplification was not affected by the knockdown of BCL2A1 (Fig. 5E), despite similar knockdown to BCL2A1-amplified M14 cells (SI Appendix, Fig. S9G). PLX4720 only modestly induced apoptosis, consistent with observations that the drug has predominately a cytostatic, noncytocidal effect on many melanoma cell lines in vitro (4–7). Suppression of BCL2A1 significantly enhanced apoptosis in BRAF-mutantBCL2A1- or MITF-expressing cell lines or short-term cultures, but not in melanomas lacking BCL2A1 or a BRAF-mutant colon cancer cell line (Fig. 5F). We also found that suppression ofBCL2A1 by shRNA significantly reduced the number of resistant clones after 2 wk of PLX4720 treatment (SI
Appendix, Fig. S9C).MITF knockdown also enhanced overall
cytotoxicity of BRAF inhibitors (SI Appendix, Fig. S9 D and E). Consistent with these genetic data, treatment with a pan-BCL2 family inhibitor, obatoclax, synergistically induced apoptosis of a BCL2A1-amplified cell line (Fig. 5G and SI Appendix, Fig. S11A), whereas ABT-737 (an inhibitor of BCL2, BCL2L1, and BCL2L2 but not of MCL1 or BCL2A1) did not. To evaluate this combination in vivo, we treated mouse xenotransplants of A375 cells (which do not express appreciableBCL2A1) or derivatives expressing BCL2A1 (Fig. 5A) with PLX4720, obatoclax, or the combination for 2 wk (Fig. 5H). PLX4720 modestly decreased the size of the control tumors over this period, whereas tumors BCL2A1 MITF SILV TYR DCT MCL1 BCL2L1 BCL2L2 BCL2L10 00 2 4 6 8 10 1 2 3 4 5 Forskolin, hours siScr Donor 1 2 3 4
siMITF siScr siMITF 0.0 siScr siMITF
0.5 1.0 1.5 ACTB MITF BCL2A1 SK-MEL-5 MALME UACC-62 0.0 0.5 1.0 1.5 0.0 0.5 1.0 1.5 0.0 0.5 1.0 1.5 Primary melanocytes
Luciferase Activity (LU) MITF
shControl shMITF #2 shMITF #4
BCL2A1 -tubulin
A
C
D
E
LOXIMVIM14MALME 3MMDA-MB-435MDA-NSKMEL28SKMEL2SKMEL5UACC257UACC62786-OA498A549A
T
CC
ACHNBT549CAKI-1CCRF-CEMCOLO205DU145EKVXHCC2998HCT1
1
6
HCT15HL60HOP62HOP92HS578THT29IGROV1_2IGROV1K562KM12MCF7MDA-MB-231MOL
T4
NCIADRRESNCIH226NCIH322MNCIH460NCIH522OVCAR3OVCAR4OVCAR5OVCAR8PC3RPMI8226RXF393SF268SF295SF539SKOV3SN12CSNB19SNB75SRSW620T47DTK10U251UO31
MITF TRPM1 BCL2A1
B
12 10 8 6F
1 2 5´UTR ChIP primers -7kb ChIP primers 5’UTR CATGTG -7kb CATGTG 5’ 10kb H. sapiens P. troglodytes G. gorilla M. mulatta C. jacchus T. syrichta R. norvegicus M. musculusgcatagtgactggactgccatatgctaagCA---CATGataaacgctgactg gcatagtgactggactgccatatgctaagCA---CATGagaaacgctgactg gcatagtgacttgactgccatatgctaagCA---CATGataaatgctgactg gcatagtgactggactgcCACATGctaagca---cacgataaacgctgactg gcatagtgactggactgccatatgctaagCA---CATGagaaacgctgactg gcatagtgactggactgccatatgctaagCA---CATGatgaacgctgactg gtatggca--tag---caataggtatgtataaagCAC---ATGataaatgtttgctg gt---ccacacagactggtcaagcaa-aggcaagataatgctgcctta 6 2 2 1 7 2 0 8 8 7 1 1 7 2 0 8
G
R Y T T C A B 5'UTR k 7 – b R Y T T C A B 5'UTR k 7 – b R Y T T C A B 5'UTR k 7 – b R Y T T C A B 5'UTR k 7 – b 0.0 0.5 1.0 1.5 2.0 Input (0.1%) No Antibody -MITF Rabbit IgG Relative occupancy 1 A 2 L C B 1 A 2 L C B 1 A 2 L C B 1 A 2 L C B *** *** ** 2A1 pGL3 Basic L C B 0.0 0.5 1.0 1.5 2.0 shControl shMITF#2 shMITF#4 pcDNA3 pcDNA3 MITF *** *** ***H
melanoma non-melanomaMelanoma Prostate Leukemia Colorectal Lung Renal
Breast
Ovarian Neural Log2 Expression Index Normalized mRNA
Normalized
mRNA
Normalized mRNA
siMITF relative to siScr
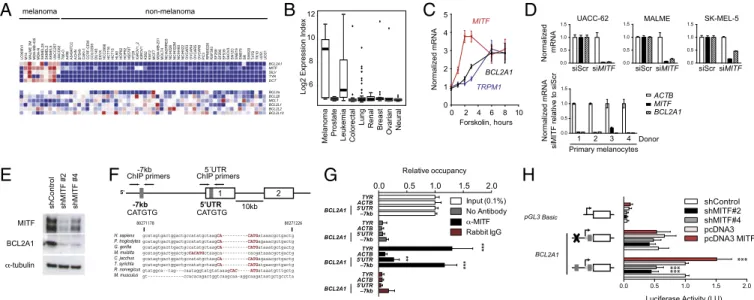
Fig. 4. MITF directly regulates BCL2A1 in the melanocytic lineage. Expression of antiapoptotic BCL-2 family members, MITF, and MITF-regulated targets in (A) the NCI-60 tumor panel and (B) an independent dataset of 954 cancer cell lines (GlaxoSmithKline). (C) The cAMP agonist forskolin (20μM) induces MITF, TRPM1 (a known MITF target), and BCL2A1 mRNA. A representative of three independent experiments using different donors is shown. (D) Knockdown of MITF by siRNA suppresses BCL2A1 expression in melanoma cells and primary melanocytes of different donors. Indicated RNA was quantified 72 h after siRNA transfection. (E) Knockdown of MITF by two independent lentiviral-expressed shMITFs suppresses BCL2A1 in UACC-62 melanoma cells. (F) Genomic structure of BCL2A1 promoter with conserved E-box at−7 kb site and within 59UTR (gray boxes), showing exons 1 and 2 and location of primers used for chromatin precipitation. Below, alignment
of the BCL2A1 promoter among mammalian species at the−7 kb site, based on Feb 2009 Build. (G) Chromatin immunopreciptation of indicated genomic region with no antibody, anti-MITF, or rabbit IgG. Precipitated DNA was amplified using primers surrounding the −7 kb or 59UTR E-boxes. Results are normalized to input
DNA. ***P< 0.001 compared with rabbit IgG control; **P < 0.01. (H) BCL2A1 promoters were cloned upstream of the luciferase gene as indicated. UACC-62 cells were transfected with the indicated promoters and two distinct shRNA hairpins targeting MITF (#2 and #4). Forty-eight hours later, luciferase activity was de-termined. Results reported are averages of at least three independent experiments, performed in duplicate and normalized for transfection efficiency using Renilla luciferase. All data are normalized to the wild-type BCL2A1 promoter transfected with the control. ***P< 0.001 compared with control.
overexpressing BCL2A1 slightly grew in size. Obatoclax alone did not significantly affect the growth of tumors, but in combination with PLX4720 it significantly decreased tumor volume of both BCL2A1-overexpressing and control tumors. Two offive animals treated with the combination had no detectable tumors present after 2 wk. Moreover, we did not observe any overt toxicity of the combination of PLX4720 and obatoclax or significant dif-ference in weight of the animals (SI Appendix, Fig. S11B). These data indicate that the combination of BRAF inhibitors and obatoclax may be an attractive therapeutic combination for melanomas with high expression of BCL2A1, either by genomic amplification or dysregulation of its upstream regulator, MITF.
To evaluate the clinical relevance of BCL2A1 in conferring resistance to BRAF inhibitors, we evaluated 19 melanoma patients for whom we have biopsies before treatment to either vemur-afenib or the combination of GSK1120212 (MEK inhibitor) and GSK2118436 (BRAF inhibitor) (refer toSI Appendix, Table S4
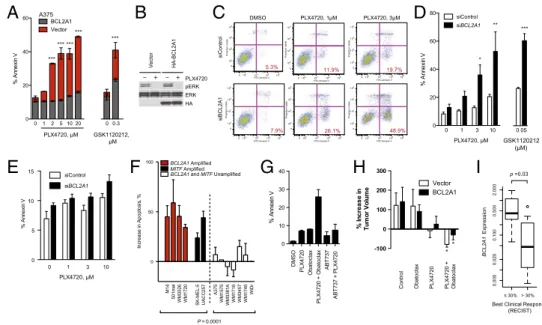
for patient details). Tumors from patients with objective RECIST responses exhibited significantly lower levels of BCL2A1 expression (P = 0.03) compared with those that had no objective response (Fig. 5I). Collectively these data suggest that identification of patients with dysregulated BCL2A1 may have poorer clinical outcomes that may be improved by concomitant treatment with BCL2 antagonists such as obatoclax.
Discussion
Small molecule suppression of the BRAF/MEK pathway in mel-anoma produces clinical responses in a majority of melmel-anoma patients (13), but the responses are variable and all patients eventually relapse. Although recent reports have elucidated several mechanisms by which melanomas acquire resistance to BRAF inhibitors (40–42), it is notable that patients treated with BRAF inhibitors rarely have complete initial responses. We propose that amplification of BCL2A1 or its direct regulator MITF may limit the primary efficacy of BRAF-directed therapy. Although wefind a correlation between BCL2A1 expression and sensitivity to BRAF inhibitors in vitro and in patients, larger, prospective trials to evaluate the effect of BCL2A1 dysregulation on BRAF inhibitor efficacy will be necessary. Moreover, it will be necessary to correlate genomic copy number with protein ex-pression in primary melanoma tissues.
Our finding that the well-established melanoma oncogene MITF directly regulates BCL2A1 suggests that it may also con-tribute to resistance to BRAF inhibitors. MITF is amplified in 15–20% of melanomas, although it is functionally required in a larger group of melanomas, including many that lack MITF amplification (21). Although there are no small molecules that target MITF, targeting downstream pathways such as BCL2A1 may be of clinical utility to this group of melanomas. In contrast, MITF-negative melanomas do not express BCL2A1 and are not sensitive to BCL2A1 suppression.
Previous work has evaluated the role of BCL2 family members in mediating resistance to targeted therapy. In lung cancer, ducing MCL1 expression sensitized epidermal growth factor re-ceptor mutant nonsmall cell lung cancers to MEK inhibitors (43). MEK inhibitors synergized with the BH3 mimetic ABT-737 in BRAF mutant colon cancer cell lines (44). In contrast, we found that ABT-737 did not synergize with PLX4720 in mela-noma. These data are consistent with the lack of efficacy of a BCL2 antisense oligonucleotide in patients with melanoma (45). The differences between melanoma and other colon cancer cell lines may be related to the inability of ABT-737 to inhibit BCL2A1 or MCL1. Indeed, BCL2A1 has been previously shown to confer resistance to ABT-737 (46). Whereas we find that BCL2A1 is genomically amplified in 30% of melanomas and is the most abundant prosurvival BCL2 family in the melanocyte lineage, we cannot exclude that other BCL2 family members may contribute to resistance to BRAF inhibitors in some cases. We have also observed that MCL1 is inversely correlated with BCL2A1 expression in melanomas (Fig. 4A). Because its over-expression would also likely suppress apoptosis, pharmacologic inhibition of MCL1 may also be therapeutically attractive, although it may engender greater toxicity risks than BCL2A1, given MCL1’s ubiquitous distribution compared with the mela-nocyte-restricted expression of BCL2A1. Collectively, our data suggest that dysregulation of antiapoptotic BCL family members in melanoma, particularly BCL2A1, may be important in the management of patients treated with BRAF inhibitors.
Materials and Methods
Cell Lines and Cultures. Cell lines were from American Type Culture Collection and were maintained as described inSI Appendix, SI Text.
B
A
C
D
pERK PLX4720 HA-BCL2A1 Ve c to r – + – + ERK HA 0102 103 104 105 FITC-Annexin V 0 102 103 104 105 Propidium Iodide 0102 103 104 105 FITC-Annexin V 0 102 103 104 105 Propidium Iodide 11.9% 5.3% 0102 103 104 105 FITC-Annexin V 0 102 103 104 105 Propidium Iodide 19.7% 0102 103 104 105 FITC-Annexin V 0 102 103 104 105 Propidium Iodide 7.9% 0102 103 104 105 FITC-Annexin V 0 102 103 104 105 Propidium Iodide 26.1% 0102 103 104 105 FITC-Annexin V 0 102 103 104 105 Propidium Iodi de 48.9% siControl siBCL2A1 DMSO PLX4720, 1 M PLX4720, 3 M 0 1 3 10 0.05 0 20 40 60 80 siControl siBCL2A1 * ** GSK1120212 (μM) %A n n e x in V 0 01 25 10 20 0.3 0 20 40 60 BCL2A1 Vector PLX4720, μM PLX4720, μM PLX4720, μM GSK1120212, μM %A n n e x in V *** *** *** *** *** *** A375E
F
G
H
I
%I nc re as ei n Tu mo r V olum e -100 0 100 200 300 Vector BCL2A1 ** 0 1 3 10 0 5 10 15 %A n n e x in V siControl siBCL2A1 M14 501me l WM3526 WM1 720 SK-MEL-5 UA CC 2 57 A375 WM1 575 W M33 81 A WM17 1 6 WM3 4 57 W M17 4 5 WiDr 0 50 100 P = 0.0001 In c reas e in A p op to s is ,% BCL2A1 Amplified MITF Amplified BCL2A1 and MITF UnamplifiedDMSO
Control Obatoclax PLX4720 PLX4720 + Obatoclax PLX4720 Obato c la x PLX4720 + Obatocla x ABT737 ABT737 + P LX4 72 0 0 10 20 30 40 %A nnexin V 0.005 0 .020 0.100 0 .500 2.000 BCL2A1 Expression ≤ 30% > 30% Best Clinical Response
(RECIST)
p = 0.03 Fig. 5. BCL2A1 and MITF mediate
re-sistance to BRAF-directed therapy. (A) BRAF-mutant A375 melanoma cells with overexpressed BCL2A1 were treated with PLX4720 or GSK1120212 and apoptosis was measured by Annexin V staining after 48 h of drug treatment. (B) Effect of BCL2A1 overexpression on ERK sig-naling after 4 h of treatment with 3μM PLX4720. (C ) Effect of concomitant BCL2A1 suppression by siRNA and PLX4720 in BCL2A1 amplified cell line, M14. Quantification of three inde-pendent experiments is shown in D. (E ) Effect of siBCL2A1 and PLX4720 in BRAF-wild-type (15q-unamplified) cell line MeWo. (F) Effect of siBCL2A1 and PLX4720 (3μM) on apoptosis in cell lines and short-term cultures. WDir is a colon cancer cell line with BRAF V600E muta-tion. (G) Effect of obatoclax (100 nM), ABT-737 (1μM), and PLX4720 (3 μM) on apoptosis of BCL2A1-amplified cell line 501mel after 48 h of treatment. (H) Effect of PLX4720 alone or in combination with
obatoclax in mouse xenotransplants. A375 cells expressing BCL2A1 or control vector (five biological replicates each) were injected into mice. Treatment of mice began 12 d after implantation, and tumor volume was measured at baseline and on the 12th d of treatment. *P< 0.05 compared with control. (I) Box-whisker plot comparing BCL2A1 mRNA expression in melanomas from patients before treatment with vemurafenib or GSK1120212+ GSK2118436 (SI Appendix, Table S4). Normalized expression (arbitrary units) was compared in patients who achieved objective responses by standard RECIST criteria (n= 12)
versus those without objective responses (n= 7). GENET
Western Blotting and Immunohistochemistry. Antibodies used were MITF C5 hybridoma, BCL2A1 (Cell Signaling Technology),α-tubulin (clone DM1A; Sigma), GAPDH (Cell Signaling Technology), BLM (Epitomics), ISG20 (Sigma), and HA (3F10; Roche). For immunohistochemistry, tumor arrays were stained with anti-BCL2A1 (rabbit monoclonal clone 1639–1, 1:50 dilution; Epitomics). Details of tissue microarray, staining, and scoring are described in
SI Appendix, SI Text.
RNA Isolation, Chromatin Immunoprecipitation, and Quantitative Real-Time PCR. Total RNA was isolated using RNeasy RNA kits (Qiagen) and quantitative real-time PCR was performed on an Applied Biosystems 7700 machine. Primers and conditions for PCR are described inSI Appendix, SI Text. siRNA Delivery and Analysis. siRNAs SMARTpools (Dharmacon) were trans-fected into melanomas or primary melanocytes using the lipidoid delivery agent C12-133-B as described inSI Appendix, SI Text. Lentivirus was prepared by transfection in 293T cells as described inSI Appendix, SI Text.
Cell Growth and Soft-Agar Assays. pLEX HA-MYC BCL2A1 (Open Biosystems) was packaged in 293T cells and infected into indicated cells as described inSI Appendix, SI Text. Infected pmel* BRAFV600E cells were plated onto soft agar as described (21) and cell number was estimated with the CellTiter-Glo luminescence assay after 2 wk. All mouse experiments were done in accordance with Institutional Animal Care and Use Committee (IACUC) approved animal protocols at Massachusetts General Hospital.
Promoter Assays and Luciferase Experiments. The BCL2A1 promoter was am-plified from discarded human foreskin and cloned into the pGL3-Basic
vector. Mutagenesis was performed using the QuikChange Mutagenesis Kit (Stratagene). Primer sequences for mutagenesis are indicated inSI Appendix, SI Text. Luciferase readings were normalized to cotransfected pRL-CMV Renilla Control.
Apoptosis and Flow Cytometry Assays. Cells were reverse-transfected with 25 nM siRNA as above and treated with PLX4720 (Sai Advantium Pharma Limited), GSK1120212 (Active Biochem), ABT-737, or obatoclax (Selleck Chemicals) for 48 h. Apoptosis was measured using the Annexin V Apoptosis Kit (Becton Dickinson). Cell cycle analysis was done 72 h after treatment with drug using propidium iodide. Cell cycle phases were estimated using FlowJo software (Treestar Software).
ACKNOWLEDGMENTS. We thank Meenhard Herlyn (Wistar Institute) for cell lines, Gideon Bollag and Plexxikon for PLX4720-containing chow, Hans Widlund (Brigham and Women’s Hospital), and members of the Fisher lab-oratory for discussions and suggestions. We thank Juying Li for advice, Su-Jean Seo (Beth-Israel Deaconess Hospital) for help with microscopy, and Myung-Shin Sims (John Wayne Cancer Institute) for statistical help. This work was supported by the American Skin Association (R.H.); National Institute of Arthritis and Musculoskeletal and Skin Diseases/National Institutes of Health (NIH); the Melanoma Research Alliance; the Dr. Miriam and Sheldon G. Adelson Medical Research Foundation (D.L.M., D.S.B.H., and D.E.F.); and Grant-in-Aid 24700971 for Young Scientists (B) (to S.Y.) from the Ministry of Education, Culture, Sports, Science, and Technology, Japan. D.G.A. is supported by NIH Grant eb00244. J.S.S. acknowledges support from the PhRMA Foundation, University of California at San Francisco (UCSF), Com-mittee on Research, UCSF Research Allocation Program, and National Cancer Institute Grant R01CA163336. D.E.F. is a Distinguished Clinical Scholar of the Doris Duke Medical Foundation.
1. Wan PT, et al.; Cancer Genome Project (2004) Mechanism of activation of the RAF-ERK signaling pathway by oncogenic mutations of B-RAF. Cell 116(6):855–867. 2. Dhomen N, et al. (2009) Oncogenic Braf induces melanocyte senescence and
mela-noma in mice. Cancer Cell 15(4):294–303.
3. Dankort D, et al. (2009) Braf(V600E) cooperates with Pten loss to induce metastatic melanoma. Nat Genet 41(5):544–552.
4. Joseph EW, et al. (2010) The RAF inhibitor PLX4032 inhibits ERK signaling and tumor cell proliferation in a V600E BRAF-selective manner. Proc Natl Acad Sci USA 107(33):14903–14908. 5. Solit DB, et al. (2006) BRAF mutation predicts sensitivity to MEK inhibition. Nature
439(7074):358–362.
6. Smalley KS, Flaherty KT (2009) Integrating BRAF/MEK inhibitors into combination
therapy for melanoma. Br J Cancer 100(3):431–435.
7. Haass NK, et al. (2008) The mitogen-activated protein/extracellular signal-regulated ki-nase kiki-nase inhibitor AZD6244 (ARRY-142886) induces growth arrest in melanoma cells and tumor regression when combined with docetaxel. Clin Cancer Res 14(1):230–239. 8. Paraiso KH, et al. (2011) PTEN loss confers BRAF inhibitor resistance to melanoma cells
through the suppression of BIM expression. Cancer Res 71(7):2750–2760. 9. Tap WD, et al. (2010) Pharmacodynamic characterization of the efficacy signals due to
selective BRAF inhibition with PLX4032 in malignant melanoma. Neoplasia 12(8): 637–649.
10. Søndergaard JN, et al. (2010) Differential sensitivity of melanoma cell lines with BRAFV600E mutation to the specific Raf inhibitor PLX4032. J Transl Med 8:39. 11. Chapman PB, et al.; BRIM-3 Study Group (2011) Improved survival with vemurafenib
in melanoma with BRAF V600E mutation. N Engl J Med 364(26):2507–2516. 12. Bollag G, et al. (2010) Clinical efficacy of a RAF inhibitor needs broad target blockade
in BRAF-mutant melanoma. Nature 467(7315):596–599.
13. Flaherty KT, et al. (2010) Inhibition of mutated, activated BRAF in metastatic mela-noma. N Engl J Med 363(9):809–819.
14. Nessling M, Kern MA, Schadendorf D, Lichter P (1999) Association of genomic im-balances with resistance to therapeutic drugs in human melanoma cell lines. Cyto-genet Cell Genet 87(3–4):286–290.
15. Beroukhim R, et al. (2010) The landscape of somatic copy-number alteration across
human cancers. Nature 463(7283):899–905.
16. Kim M, et al. (2006) Comparative oncogenomics identifies NEDD9 as a melanoma
metastasis gene. Cell 125(7):1269–1281.
17. Bass AJ, et al. (2009) SOX2 is an amplified lineage-survival oncogene in lung and esophageal squamous cell carcinomas. Nat Genet 41(11):1238–1242.
18. Scott KL, et al. (2009) GOLPH3 modulates mTOR signalling and rapamycin sensitivity in cancer. Nature 459(7250):1085–1090.
19. Firestein R, et al. (2008) CDK8 is a colorectal cancer oncogene that regulates beta-catenin activity. Nature 455(7212):547–551.
20. Weir BA, et al. (2007) Characterizing the cancer genome in lung adenocarcinoma. Nature 450(7171):893–898.
21. Garraway LA, et al. (2005) Integrative genomic analyses identify MITF as a lineage survival oncogene amplified in malignant melanoma. Nature 436(7047):117–122. 22. Beroukhim R, et al. (2007) Assessing the significance of chromosomal aberrations in
cancer: methodology and application to glioma. Proc Natl Acad Sci USA 104(50): 20007–20012.
23. Di Fiore PP, et al. (1987) erbB-2 is a potent oncogene when overexpressed in NIH/3T3 cells. Science 237(4811):178–182.
24. Vogler M (2012) BCL2A1: The underdog in the BCL2 family. Cell Death Differ 19(1):67–74.
25. Paoluzzi L, et al. (2008) Targeting Bcl-2 family members with the BH3 mimetic AT-101 markedly enhances the therapeutic effects of chemotherapeutic agents in in vitro and in vivo models of B-cell lymphoma. Blood 111(11):5350–5358.
26. Nguyen M, et al. (2007) Small molecule obatoclax (GX15-070) antagonizes MCL-1 and overcomes MCL-1-mediated resistance to apoptosis. Proc Natl Acad Sci USA 104(49): 19512–19517.
27. Oltersdorf T, et al. (2005) An inhibitor of Bcl-2 family proteins induces regression of solid tumours. Nature 435(7042):677–681.
28. Walensky LD, et al. (2004) Activation of apoptosis in vivo by a hydrocarbon-stapled
BH3 helix. Science 305(5689):1466–1470.
29. Cashman JR, et al. (2010) Inhibition of Bfl-1 with N-aryl maleimides. Bioorg Med Chem
Lett 20(22):6560–6564.
30. Talantov D, et al. (2005) Novel genes associated with malignant melanoma but not benign melanocytic lesions. Clin Cancer Res 11(20):7234–7242.
31. Thomas RK, et al. (2007) High-throughput oncogene mutation profiling in human cancer. Nat Genet 39(3):347–351.
32. Lin WM, et al. (2008) Modeling genomic diversity and tumor dependency in malig-nant melanoma. Cancer Res 68(3):664–673.
33. Karsan A, Yee E, Kaushansky K, Harlan JM (1996) Cloning of human Bcl-2 homologue: Inflammatory cytokines induce human A1 in cultured endothelial cells. Blood 87(8): 3089–3096.
34. Miller AJ, et al. (2004) Transcriptional regulation of the melanoma prognostic marker melastatin (TRPM1) by MITF in melanocytes and melanoma. Cancer Res 64(2):509–516. 35. Du J, et al. (2003) MLANA/MART1 and SILV/PMEL17/GP100 are transcriptionally
reg-ulated by MITF in melanocytes and melanoma. Am J Pathol 163(1):333–343. 36. Hoek KS, et al. (2008) Novel MITF targets identified using a two-step DNA microarray
strategy. Pigment Cell Melanoma Res 21(6):665–676.
37. McGill GG, et al. (2002) Bcl2 regulation by the melanocyte master regulator Mitf modulates lineage survival and melanoma cell viability. Cell 109(6):707–718. 38. Hatakeyama S, et al. (1998) Multiple gene duplication and expression of mouse
bcl-2-related genes, A1. Int Immunol 10(5):631–637.
39. Price ER, et al. (1998) alpha-Melanocyte-stimulating hormone signaling regulates
expression of microphthalmia, a gene deficient in Waardenburg syndrome. J Biol
Chem 273(49):33042–33047.
40. Nazarian R, et al. (2010) Melanomas acquire resistance to B-RAF(V600E) inhibition by RTK or N-RAS upregulation. Nature 468(7326):973–977.
41. Johannessen CM, et al. (2010) COT drives resistance to RAF inhibition through MAP kinase pathway reactivation. Nature 468(7326):968–972.
42. Villanueva J, et al. (2010) Acquired resistance to BRAF inhibitors mediated by a RAF kinase switch in melanoma can be overcome by cotargeting MEK and IGF-1R/PI3K. Cancer Cell 18(6):683–695.
43. Faber AC, et al. (2009) Differential induction of apoptosis in HER2 and EGFR addicted cancers following PI3K inhibition. Proc Natl Acad Sci USA 106(46):19503–19508. 44. Cragg MS, et al. (2008) Treatment of B-RAF mutant human tumor cells with a MEK
in-hibitor requires Bim and is enhanced by a BH3 mimetic. J Clin Invest 118(11):3651–3659. 45. Kitzen JM, Chi LG, Uprichard AC, Lucchesi BR (1990) Effects of combined thromboxane
synthetase inhibition/thromboxane receptor antagonism in two models of sudden cardiac death in the canine: Limited role for thromboxane. J Cardiovasc Pharmacol 16(1):68–80. 46. Vogler M, et al. (2009) Concurrent up-regulation of BCL-XL and BCL2A1 induces ap-proximately 1000-fold resistance to ABT-737 in chronic lymphocytic leukemia. Blood 113(18):4403–4413.