HAL Id: hal-02378038
https://hal.archives-ouvertes.fr/hal-02378038
Submitted on 24 Nov 2019
HAL is a multi-disciplinary open access archive for the deposit and dissemination of sci-entific research documents, whether they are pub-lished or not. The documents may come from teaching and research institutions in France or abroad, or from public or private research centers.
L’archive ouverte pluridisciplinaire HAL, est destinée au dépôt et à la diffusion de documents scientifiques de niveau recherche, publiés ou non, émanant des établissements d’enseignement et de recherche français ou étrangers, des laboratoires publics ou privés.
Crackling dynamics during the failure of heterogeneous
material: Optical and acoustic tracking of slow
interfacial crack growth
S. Santucci, M Grob, Renaud Toussaint, J. Schmittbuhl, A. Hansen, Knut
Jørgen Måløy
To cite this version:
S. Santucci, M Grob, Renaud Toussaint, J. Schmittbuhl, A. Hansen, et al.. Crackling dynamics during the failure of heterogeneous material: Optical and acoustic tracking of slow interfacial crack growth. 12th International Conference on Fracture 2009, ICF-12, 8, pp.6365-6374, 2009, 9781617382277. �hal-02378038�
Crackling dynamics during the failure of heterogeneous material:
Optical and acoustic tracking of slow interfacial crack growth
S. Santucci1,2,3, M. Grob4, R.Toussaint4,5, J. Schmittbuhl4,5, A. Hansen6, K. J. Måløy1
1Physics Dpt, Oslo University, Norway; 2Physics of Geological Processes, Oslo
University, Norway; 3 Laboratoire de Physique, Ecole Normale Superieure de Lyon, Lyon, France; 4Institut de Physique du Globe de Strasbourg, Strasbourg, France;5EOST, University of Strasbourg, Strasbourg, France; 6 Physics Dpt, NTNU, Trondheim, Norway;
1. Introduction
The failure of heterogeneous materials has been extensively studied in the recent past (see the recent reviews [1, 2] and references therein). Those various studies have been motivated by the numerous practical benefits to many engineering fields, but also by the fundamental questions brought forward in particular in statistical physics [1, 2]. Indeed, they belong clearly to a more general framework concerning the dynamics of elastic disordered systems, concerning many different physical situations, such as crack fronts [3, 4], magnetic domain walls in disordered ferromagnets [5], or wetting contact lines on rough substrates [6], where elasticity and disorder are competing to shape the interface.
A fracture front propagating in a 3d heterogeneous medium has itself a 3-d shape with different in-plane and out-of-plane roughnesses, denoted respectively ζ|| and
ζ┴ . In order to simplify this problem and shed some light on the interactions
between the crack front and material heterogeneities, a simplification to a two dimensional configuration — an interfacial crack, where the crack front is constrained to propagate within a weak heterogeneous plane of a 3d block — has been proposed both experimentally [7, 8] and theoretically [4].
In this work, we will focus on this simpler configuration, studying both the structure and the dynamics of those planar cracks. Indeed, using a transparent material and both a high resolution fast camera and two microphones, the detailed complex crack dynamics can be fully captured. Indeed we can follow the propagation of the crack front along a weak heterogeneous plane of a transparent block with a high precision both in time and space.
First, we will show that the fracture front displays a complex, jerky dynamics also called ―Crackling Noise‖: the fracture dynamics is governed by irregular avalanches with very large size and velocity fluctuations. We characterized the intermittent dynamics observed - the local pinnings and depinnings of the crack front- by measuring both the acoustic emission and the local waiting time fluctuations along the crack front during its propagation.
Then, we will focus on the morphology of the interfacial crack fronts - at rest, in order to obtain a high resolution in the description of those interfaces - by studying in details the scaling properties of the front.
2. A complex dynamics: “Crackling Noise” 2.1 Experimental set-up and method
We describe here experiments where two Plexiglas plates are annealed together to create a single block with a weak interface, as shown on Fig. 1. (for more details see [7-10]). The Plexiglas plates have the following dimensions: the main plate is 16 cm long, 14 cm large and 1 cm thick; the other ones are a set of 17 cm long, 0.4 cm thin and 1 cm wide bands. Before annealing, both plates are sandblasted on one side with 200 µm large glass beads. Sandblasting introduces a random topography which induces local toughness fluctuations during the annealing procedure. Another consequence of the blasting process is that the transparency of the Plexiglas plates is lost: light scatters because of the microstructures created. However, after annealing, the newly formed block recovers its transparency, since the contrast of the refraction index along the interface disappears, allowing a direct observation of the crack interface when opening the block in mode 1.
(a) (b)
Figure 1: Sample preparation procedure. The Plexiglas plates are sand-blasted and sintered together to form new single blocks. (a) The blasting procedure creates roughness fluctuations on the plate surface that control the local toughness during the annealing process. It also induces a loss of transparency by unpolishing the surfaces. Transparency is however recovered thanks to the sintering process. (b) Sintering process: in white, the PMMA sample; in gray, the two aluminum plates; in black, the solid frame with the screws to apply a torque of = 10 N.m. The whole block is put in an oven at 205oC during 30 minutes.
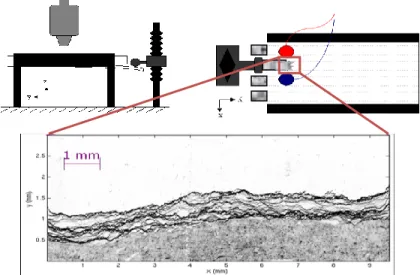
Then, we impose a normal displacement at a constant speed (between 1 μm/s up to 100 μm/s) to the lower plate, resulting in stable crack propagation in mode I. A sketch of the experimental set-up is shown in Fig. 2. Using a high speed camera (Photron Ultima) mounted on top of a microscope, up to 12288 consecutive images of the crack advance can be recorded with a spatial resolution of 1024 x 512 pixels (1 pixel ≈ 10 x 10 μm2) at an acquisition rate of 1000 frames per second (fps). It is important to notice that the width of the image acquired by the fast camera is adjusted to the width of the PMMA band, and therefore we can capture the full dynamics of the front. Moreover using two contact microphones (Wide Band acoustic sensors in the ultrasonic range 100kHz - 1MHz), placed on top of the thick Plexiglas plate, on the sides of the band, we record simultaneously at an acquisition rate of 1MHz the acoustic emissions during the propagation of the crack.
Figure 2: Sketch of the experimental setup (top left: side view; top right: view from above). The thick plate of the sample (in white) is clamped into a rigid aluminum frame (in black). A cylindrical rod imposes a displacement of the thin Plexiglas band at a constant speed. The crack propagates in the y direction and is observed from above using a high speed camera mounted on a microscope. Moreover, using two microphones, placed on top of the thick Plexiglas plate on the sides of the band, we can record simultaneously the acoustic emissions during the propagation of the crack. The figure shows a typical image recorded by the high resolution fast camera during an experiment with an average crack front speed ‹V› ≈ 200 µm/s. We superimpose 6000 fronts recorded at an acquisition rate of 1000 fps.
2.2 A complex intermittent dynamics: “Crackling Noise” On Fig.2, we show a typical image recorded by the high resolution fast camera during an experiment with an average crack speed ‹V› ≈ 200 µm/s. Moreover, we superimpose on the same figure 6000 fronts recorded by the fast camera at a frame rate of 1000 fps. The spatially random toughness along the weak interface generates a rough crack line in pinning the crack front, and triggers a rich burst activity on a wide range of length scales. The various regions of gray levels (the darker parts show the longer waiting time) reveal this complex dynamics.
We characterized the intermittent dynamics observed, i.e. the local pinnings and depinnings of the crack front by measuring the local waiting time fluctuations along the interface during its propagation [10]. This analysis allowed us to define local velocity at each point of the front during its propagation, and finally avalanches or quakes, as clusters of large local velocities.
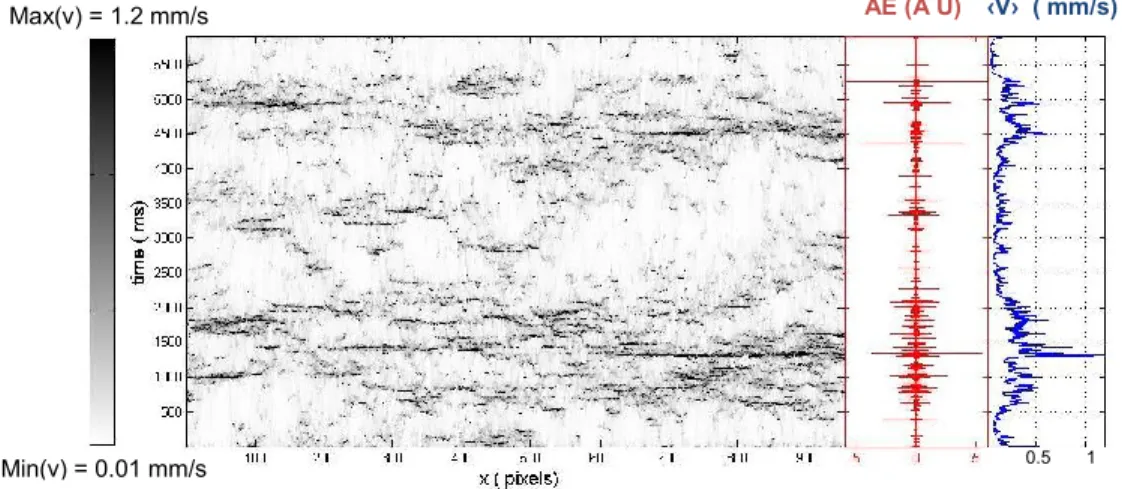
On Fig.3, we show the spatio-temporal map of the local velocity of the front, suggesting once again an intermittent dynamics on a wide range of temporal and length scales. These (optically detected) quakes can be ranked in catalogs with analogous characteristics to seismicity catalogs (epicenter location, time of occurrence and rupture area of each quake). Interestingly, in a recent work [11], we have shown that the spatial and temporal distributions of the events for our experimental quake catalogs share similar statistical features to those observed for large scale, real seismicity data, suggesting a tight link between this laboratory experimental model and natural events.
Figure 3: (a) Spatio-temporal of the local velocity of the crack front during its propagation within the weak heterogeneous plane of the Plexiglas block at an average speed of ‹V› ≈ 200 µm/s. (b) Acoustic emissions continuously recorded by one contact microphone, output signal in volts (Arbitrary Units) (Wide Band acoustic sensor 100kHz - 1MHz) at 1MHz during the crack propagation. (c) The average crack front speed shows an intermittent dynamics.
We also show on Fig 3. an acoustic signal that was acquired continuously (during the same experiment) at a rate of 1 MHz using a wide-band acoustic sensor in the ultrasonic range 100kHz-1MHz. We clearly observe a qualitative correlation between the acoustic activity and the propagation of the front. Work is in progress in order to build catalogs of acoustic events, pursuing the statistical analysis of both acoustic and optical bursts in order to investigate in detail the correlation between the acoustic emissions and the propagation of the front. In particular, we are currently measuring the acoustic energy released for each optical events and comparing their statistical features.
2.3 An ideal experimental system
We have shown here that our experimental set-up allows to fully capture the complex crackling dynamics of a fracture front propagating along a weak heterogeneous interface. We used a double experimental technique developing a
simultaneous acoustic and optical tracking of the failure of the block. This
experimental study appears relevant both in Earth sciences and statistical physics. Indeed, it is an ideal system for testing the various theoretical description proposed in the literature [12-14] in order to clarify the role of the disorder and in particular the elastic interactions between the heterogeneities within the material which give rise to such a complex intermittent behavior.
After studying the crackling dynamics of interfacial crack fronts, let us examine now the morphology of those interfaces.
AE (A U) ‹V› ( mm/s)
Max(v) = 1.2 mm/s
3. A complex morphology
- Different self-affine behavior at small and large scales- 3.1 Motivation
Since the pioneering work of Mandelbrot et al [15] revealing the self-affine character of fracture surfaces of metals, numerous studies have been devoted to the morphological properties of crack surfaces (see the reviews [1, 2]). In particular, the roughness exponent characterizing this self-affinity was shown to be very robust and further on conjectured to be Universal [1, 16, 17]. This apparent Universality led to interpret the fracture of heterogeneous materials within the framework of critical phenomena [1, 18]- following the work of Ertas and Kardar for a very different system i.e. the motion of vortex lines in superconductors [19]. In this approach, the failure of heterogeneous material appears as a depinning transition of an elastic line through a disordered landscape, and the crack surface corresponds to the trace left by the front during its propagation.
Although qualitatively appealing, this description failed to reproduce quantitatively the scaling exponents experimentally observed and therefore triggered an upsurge of studies [1]. Despite the plethoric literature concerning the morphology of rough crack surfaces, a clear understanding of the role of material heterogeneities leading to those self-affine long range correlations is still lacking, with up to now an apparent disagreement between the scaling exponents obtained both theoretically and numerically and those measured experimentally [1, 2, 4, 7, 8, 20, 21, 22]. In particular, the morphological properties of in-plane cracks - which were proposed to simplify the original 3d problem remain a very controversial issue. Indeed, the in-plane roughness exponent measured experimentally till now ζexp~0.6 [7, 8, 23] is significantly larger than the one predicted either theoretically via renormalization group calculations or numerical simulations ζth~0.39 [4, 20, 21, 22]. A percolation-like approach recently proposed [12, 13] to account for the local damage ahead of the crack front was able for the first time to reproduce the scaling behavior of those interfacial fronts. However, this description has been tremendously debated [24, 25].
Therefore, it appears of crucial importance to clarify this controversy by obtaining a clear and detailed experimental description of the scaling behavior of those planar cracks.
3.2 Experimental set-up and method
We will focus here on the morphology of the interfacial crack fronts at rest in order to obtain a high resolution description of the height fluctuations of the interface. The experimental set-up is identical to the one described in the previous section. We just changed the dimensions of the Plexiglas plates (32 cm x 14 cm x 1 cm and 34 cm x 12 cm x 0.4 cm), and the loading procedure: we impose a normal displacement to the lower plate, resulting in a stable crack propagation in mode I; when the front has advanced of a few millimeters (typically 5 mm), the
plate is unloaded in order to arrest the front. Then, we take high resolution pictures of the crack interface using a Nikon camera (3871 x 2592 pixels) mounted on a microscope, placed itself on a translation stage that can move in the direction parallel and perpendicular to the propagation plane (x,y). During each loading stop, the table is translated along the front x-axis, and neighboring pictures are taken.
Figure 1 : Assembling up to 15 high resolution pictures of an interfacial crack front at rest provides a large front description with around 16 000 data points and a pixel size of 1 µm.
The assemblage of up to 15 high resolution pictures of an interfacial crack front at rest provides a large front description with around 16 000 data points and a pixel size of a = 1 µm. This procedure was repeated 20 times in order to obtain 20 different and independent fracture fronts. The total length of each analyzed crack was around 16 mm, with a typical example shown on Fig.1. Finally, in order to modify the heterogeneities within the weak plane of the block, we prepared different samples using glass beads of different diameters during the sand-blasting procedure, respectively Ø1 ~ 50 µm and Ø2~ 200 µm.
3.3 A complex self-affine behavior
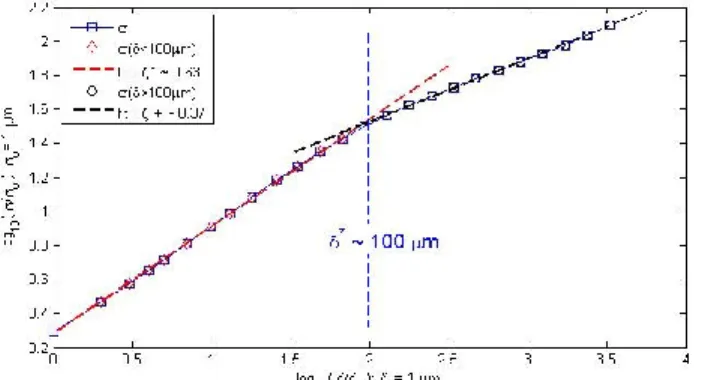
We aim at characterizing the scaling properties of the height fluctuations of the interfacial crack fronts Δh(δ) = h(x+δ) – h(δ). On Fig. 4, we plot the standard deviation σ of the height fluctuations Δh(δ) of the crack interfaces as a function of the scale δ for samples roughened with glass beads of diameter Ø2 ~ 200 µm
during the blasting procedure.
Figure 2 : Scaling behavior of interfacial crack fronts at rest. We plot the standard deviation σ of the height fluctuations Δh(δ) of the crack interfaces as a function of the scale δ. The glass beads used for preparing the samples – blasting and roughening of the Plexiglas plates – had a diameter of Ø ~ 200 µm.
At small scales, below δ* ~ 100 µm, we observe a self-affine scaling behavior σ(δ<δ*) ~ δζ- with a roughness exponent around ζ- ~ 0.63 which is in agreement with previous observations [7, 8] and the percolation-like approach recently proposed [12, 13] to account for the local damage ahead of the crack front.
However, interestingly, at scales larger than δ* ~ 100 µm, we observe a cross-over to another scaling regime σ(δ > δ*) ~ δζ+ with a smaller roughness exponent ζ+ ~ 0.37. It is important to emphasize that this is the first time that such a scaling regime is reported for in-plane crack fronts. Moreover, this value appears in agreement with the prediction of a depinning model [4, 20, 21, 22].
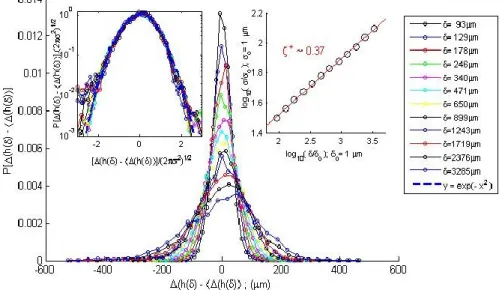
In order to analyze in more details this scaling behavior at large scales, we define height fluctuations at a given scale as Δh(δ,x)=h(x+ δ)-h(x), and propose to examine the statistical distribution of the height fluctuations P[Δh(δ)] on that range of scales δ> δ*~100µm .
Figure 3 : Statistical distributions of the height fluctuations Δh(δ)-
‹
Δh(δ)›
, for logarithmically increasing length scales δ. We observe on that range of scales (δ ≥ 100 µm) that the statistical distributions P[Δh(δ)-‹
Δh(δ)›
] follow a Gaussian shape, with a width increasing with the range of scales studied δ. The self-affine behavior of those distributions enters through the scaling behavior of the standard deviation σ of the height fluctuations Δh(δ)-‹
Δh(δ)›
, σ ~ δζ+, with a roughness exponent ζ+ ~ 0.37, as we can observe on the insettop-right. The Gaussian statistics is confirmed in the figure top-left where we observe a collapse of all the various distributions when plotting on a semilog scale
P[Δh(δ)-‹
Δh(δ)›
].(2πσ2)1/2 as a function of [Δh(δ)-‹
Δh(δ)›
]/(2πσ2)1/2. The blue dotted line representsthe curve y=exp(-x2) and fits perfectly the experimental rescaled distributions.
It is important to remark that our experimental data set is large enough to perform such a direct reliable measurement. In Fig.2, we show the distributions of the height fluctuations for logarithmically increasing length scales δ. On that range of
scales, above δ*, δ>δ*~100µm, we clearly observe that the distributions P[Δh(δ)] follow a Gaussian statistics. The self-affine character of the height fluctuations of the fronts appears through the scaling behavior of the standard deviation σ of those distributions P[Δh(δ)], σ ~ δζ+ with a unique roughness exponent ζ+ ~ 0.37.
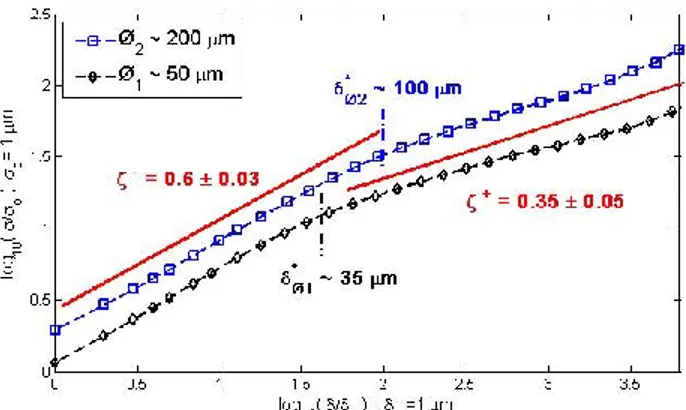
3.4 Effect of the disorder and the material microstructure Let us now examine and discuss the crossover length scale δ* separating the large and small scale behavior of the height fluctuations. In order to check the effect of disorder and material microstructure on the scaling behavior of the interfacial crack fronts, we modified the heterogeneities within the weak plane of the block, preparing different samples using glass beads of different diameters Ø1 ~ 50 µm
and Ø2 ~ 200 µm for the blasting procedure.
Figure 4 : Effect of disorder on the self-affine scaling of interfacial crack fronts. We plot the standard deviation σ of the height fluctuations Δh(δ) of the crack interfaces as a function of the scale δ. We analyzed two different sets of data, prepared with glass beads of different diameters respectively Ø1~50µm and Ø1~200µm.
We show on Fig.4. the scaling behavior of the interfacial crack fronts for those different samples. We observe mainly the same features as on previous figure with the two different scaling behaviors separated by a characteristic size respectively δ*Ø1 ~ 35 µm, and δ*Ø2 ~ 100 µm. It is important to note that the
scaling regime at small scales up to the characteristic sizes δ*Ø1 andδ*Ø2 can be
associated to the material heterogeneities. Indeed, when using larger glass beads for roughening the Plexiglas plates, the amplitude of the height fluctuations of the fronts increases (vertical shift of the blue curves) as well as the scaling range at small scales, providing a roughness exponent ζ- ~ 0.6 up to the scale δ*Ø2 ~ 100
µm. It is important to notice that those results appear by analogy, in agreement with recent experimental observations on 3-d fracture surfaces of phase separated glasses [26]. However, more work is needed, in order to obtain a characterization of the disorder produced by the indentation impacts during the blasting process and finally to be able to compare this typical size δ* (separatingthe two different scaling regimes) with the typical scale of the heterogeneities. In particular, it appears important to study the influence of the crack growth velocity, the mechanical properties of the plates on this typical size δ*and its eventual link to the damage process zone [27].
4. Conclusion
Finally, we can conclude by insisting on the fact that our high resolution experimental set-up allows to obtain a detailed description of the failure of heterogeneous materials. Indeed, we can fully capture the crack dynamics by observing directly the interface with a high resolution fast camera, and recording simultaneously the acoustic emissions during the front propagation along a weak heterogeneous plane of a transparent Plexiglas block.
The role of heterogeneities during crack propagation is of central importance since they induce local pinnings of the crack front and subsequently trigger a very complex burst activity, characterized by avalanches, spanning over a broad range of temporal and length scales. This intermittent dynamics also called ―crackling noise‖ is also suggested from the acoustic emission accompanying the failure process. Another consequence of this phenomenology is the roughness of fracture surfaces left by the crack. Indeed, cracks in heterogeneous media exhibit a self-affine morphology, with long range correlations. In particular, we have shown here that the interfacial crack fronts follow different scaling regime at small and large scales. For scales larger than a typical size δ*, that could be interpreted as a characteristic size of disorder, we observed a self-affine regime with a roughness exponent ζ+ = 0.35 ± 0.05 much smaller than the value measured up to now and observed here at small scales ζ- = 0.6 ± 0.03. Those different scaling regimes can be understood within the framework of recent statistical models [28].
5. References
[1] E. Bouchaud, J. Phys. Condens. Matter, volume 9, 4319, (1997).
[2] M. Alava, P.K.V.V Nukala, and S. Zapperi, Adv. Phys., 55, 349, (2006). [3] H. Gao and J. R. Rice, J. Appl. Mech. 56, 828 (1989).
[4] J. Schmittbuhl, S. Roux, J.P. Vilotte, and K.J. Maloy, Phys. Rev. Lett. 74, 1787 (1995);
[5] G. Bertotti, G. Durin, and A. Magni, J. Appl. Phys. 75,5490 (1994); G. Durin and S. Zapperi, Phys. Rev. Lett. 84, 4705 (2000).
[6] D. Ertas and M. Kardar, Phys. Rev. E 49, R2532 (1994); E. Rolley, C. Guthmann, R. Gombrowicz, and V. Repain, Phys. Rev. Lett. 80, 2865 (1998); [7] J. Schmittbuhl and K. J. Måløy, Phys. Rev. Lett. 78, 3888, (1997).
[8] A. Delaplace, J. Schmittbuhl, and K. J. Måløy, Phys. Rev. E 60, 1337 (1999). [9] K. J. Måløy and J. Schmittbuhl, Phys. Rev. Lett. 87,105502 (2001).
[10] K. J. Måløy, S. Santucci, J. Schmittbuhl, and R. Toussaint, Phys. Rev. Lett. 96, 045501, (2006);
[11] M. Grob, J. Schmittbuhl, R. Toussaint, L.Rivera, S. Santucci, K. J. Måløy to be published in Pure Appl. Geophys. (2008) .
[12] A. Hansen and J. Schmittbuhl, Phys. Rev. Lett. 90, 045504 (2003).
[13] J. Schmittbuhl, A. Hansen, and G. G. Batrouni, Phys. Rev. Lett. 90, 045505 (2003).
[14] D. Bonamy, S. Santucci, L. Ponson, PRL 101, 045501 (2008).
[15] B. B. Mandelbrot, D. E. Passoja, and A. J. Paullay, Nature (London) 308, 721 (1984);
[16] E. Bouchaud, G. Lapasset, and J. Planes, Europhys. Lett. 13, 73 (1990). [17] K. J. Måløy, A. Hansen, E. L. Hinrichsen, and S. Roux, Phys. Rev. Lett. 68, 213 (1992).
[18] O. Narayan and D. S. Fisher, Phys. Rev. B 48, 7030 (1993). [19] D. Ertas and M. Kardar, Phys. Rev Lett. 69, 929 (1992);
[20] S. Ramanathan, D. Ertas, D. Fisher, Phys. Rev. Lett. 79, 873 (1997). [21] A. Tanguy, M. Gounelle and S. Roux, Phys. Rev. 58, 1577 (1998); [22] A. Rosso and W. Krauth, Phys. Rev. E {\bf 65}, 025101(R) (2002);
[23] P. Daguier, E. Bouchaud and G. Lapasset, Europhys. Lett., 31 (7), pp. 367-372 (1995)
[24] M. Alava and S. Zapperi, Phys. Rev. Lett. 92, 049601 (2004).
[25] J. Schmittbuhl, A. Hansen, and G. G. Batrouni, Phys. Rev. Lett. 92, 049602 (2004).
[26] D. Dalmas, A. Lelarge and D. Vandembroucq, arxiv:0712.4197.
[27] S. Morel D. Bonamy, L. Ponson, and E. Bouchaud, Phys. Rev. E 78, 016112 (2008).
[28] S. Santucci, M. Grob, R. Toussaint, J. Schmittbuhl, A. Hansen, K. J. Måløy, to be submitted