of Lighting Technologies
in Bottom of the Pyramid Communities
by
Pragnya Y. Alekal
M.Eng in Civil and Environmental Engineering
Massachusetts Institute of Technology,
June
2005
B.S in Civil and Environmental Engineering
University of California at Los Angeles,
June
1999
Submitted to the Engineering Systems Division
in Partial Fulfillment of the Requirements for the Degree of
MASTER OF SCIENCE IN TECHNOLOGY AND POLICY
at the
MASSACHUSETTS INSTITUTE OF TECHNOLOGY
SEPTEMBER 2007
©
2007 Massachusetts Institute of Technology. All rights reserved.
Signature of Author... .... ... ... ...
Technology and Policy Program, Engineering Systems Division
August 10, 2007
Certified by....
...
...
.
Richard M. Locke
Alvin
J.
Siteman Professor of Entrepreneurship and Political Science
Thesis Supervisor
Accepted by ... .... . ... ... . ...
Dava J.
Newman
Professor of Aeronautics and Astronautics and Engineering Systems
Director, Technology and Policy Program
ARcHIVES
of Lighting Technologies
in Bottom of the Pyramid Communities
by
Pragnya Y. Alekal
Submitted to the Engineering Systems Division on 10 August, 2007
in Partial Fulfillment of the Requirements for
the Degree of Master of Science in Technology and Policy
ABSTRACT
This thesis deduces a set of best practices for sustainably scaling up lighting technologies in developing countries with a focus on Bottom-of-the-Pyramid (BOP) communities, whose annual incomes are US $3000 or less (in local purchasing power parity).
The best practices are derived from a comparative analysis of two heuristic case studies profiling entrepreneurs based in southern India, who have successfully scaled up lighting technologies in BOP communities. Also discussed is the impact that quality lighting has on our health, safety, socio-economic status and the environment that surrounds us. Not surprisingly the demand for quality artificial lighting is high in these communities, where access is generally limited. SELCO-India, a registered company, sells photovoltaic-based home lighting systems; while THRIVE, a nonprofit organization, sells Light Emitting Diode (LED) lanterns to remote communities in India. Both organizations use alternative models to address the same issue.
While the research presented here focuses on the lighting sector in India, it is also proven that the results are applicable in the context of entrepreneurship in BOP communities around the world.
Thesis Supervisor: Richard M. Locke
I would like to dedicate this thesis to all the forces that have made me
possible and continually inspire me to be better. You are the reason that I
am.
Special thanks to all the wonderful people who have helped me throughout this process, especially Professor Richard Locke and Professor Simon Johnson, for taking a chance on an unknown student. Equally important is the help of Professor Sarah Slaughter, the Vistakula family, Dr Ranganayakulu, Dr Harish Hande, the incredible staffs of THRIVE and SELCO, Daniel Hsu, Rohit Wanchoo, the TPP staff and class of 2007, and many more. I hope to pass on your kindness, generosity and wisdom to others as I move through my life.
I'm gonna let it shine
-unknown-Chapter
1: INTRODUCTION
...
13
1.1 Background and Motivation ... ... ... 14
1.2 Range of A pplicability... 16
1.3 M ethodology ... 17
Chapter 2: LIGHTING
... 19
2.1 Lighting: Introduction and Importance... 19
2.1.1 The Importance of Lighting in Environmental Sustainability... 20
2.1.2 The Impact of Lighting on the Health and Safety of BOP Communities... 21
2.1.3 The Impact of Lighting on the Livelihoods of Users... .23
2.1.4 The Socio-Economic Impact of Electricity Access ... 25
2.1.5 The Market Size for Rural Lighting ... ... 28
2.2 Salient Features of Electricity, Solar Power and Kerosene ... 29
2.2.1 E lectricity ... ... 29
2.2.2 Solar Energy ... ... 30
2.2.3 K erosene ... ... 31
2.3 The Technical Aspects of Lighting ... ... ... 32
2.3.1 Human Factors in Lighting ... 32
2.3.2 Light Measurability and Standards... ... 34
2.3.3 Artificial Lighting Sources... ... ... 35
Chapter 3: CASE STUDIES IN LIGHTING
...
.... 47
3.1 Background: Why SELCO-India and THRIVE... 47
3.2 The Lighting Market in India... 50
3.2.1 The Indian Kerosene Market... 50
3.2.2 The Indian Electricity Market ... ... ... 51
3.3 Case Study I: SELCO-India... ... 53
3.3.1 B ackground ... ... 53
3.3.2 SELCO: 1994-1998 ... 54
3.3.3 G row th: 1998-2006... ... 56
3.3.4 Expanding Scope: 2007 and Beyond... ... 60
3.3.5 C hallenges ... ... 60
3.4 Case Study II: TH RIV E ... 62
3.4.1 B ackground ... ... 62
3.4.2 Lighting: 2002-2003 ... 62
3.4.3 First Lighting Project: 2003-05 ... 63
3.4.5 Development Marketplace Lighting Project: 2006-present ... 68
3.4.6 Challenges of Scalability... 70
3.5 Discussion and Comparative Analysis of THRIVE and SELCO ... 73
3.6 C hallenges... ... 78
3.6.1 The Debate of Ideologies: NGO versus Corporate... 83
Chapter 4: RESULTS AND CONCLUSIONS
...
....
85
4.1 Sum m ary ... 85
4.1.1 B est Practices... 86
4.1.2 Challenges of Scalability... 90
4.2 C onclusions... 92
4.3 Recommendations for Future Work ... ... ... 94
ABBREVIATIONS
AND
ACRONYMS ...
95
REFERENCES ...
... 97
Appendix 1: HDI to Electricity Consumption Per Capita... 102
Appendix 2: SELCO-India Product Specifications
...
106
Appendix 3: THRIVE Lighting Manual
...
107
Appendix 4: LED Market Study
...
114
A 4.1 Introduction ... 115
A4.2 Market Survey ... 116
A 4.3 M ajor Players ... 117
A4.4 Current Operational Models ... 119
A4.5 Alternative Solution... 120
A 4.6 C onclusion... 123
Figure 2.1: Number of people with no access to electricity in 2002 and projected number
in 2030 if no new measures are implemented (IEA, 2006) ... 20
Figure 2.2: Percentage of population using solid fuels (WHO, 2006)... 22
Figure 2.3: The impact of indoor air pollution on human health (WHO, 2006) ... 23
Figure 2.4: Household expenditure on energy (WHO, 2006). ... 24
Figure 2.5: Hours per day spent by women collecting fuel, 1999-2003 (WHO, 2006)....25
Figure 2.6: Average annual household-lighting electricity consumption versus income in C hina (IEA , 2006) ... ... 27
Figure 2.7: Relationship between HDI and per capita energy consumption, 1999/2000 (W E A , 2004) ... ... 27
Figure 2.8: Composite map of the earth at night (NASA, 2000)... 28
Figure 2.9: Example of an incandescent light bulb (IEA, 2006) ... 39
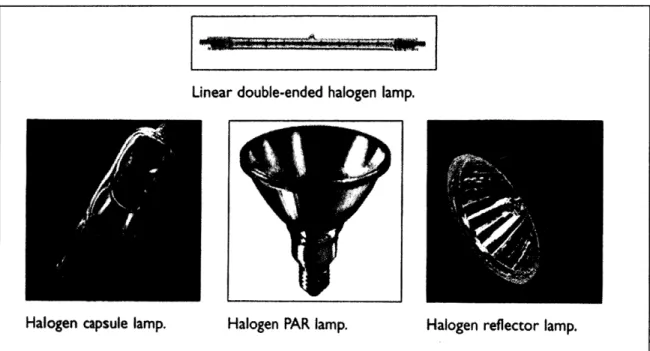
Figure 2.10: Examples of common halogen lamps (IEA, 2006) ... 39
Figure 2.11: Features of a linear fluorescent lamp (IEA, 2006) ... 40
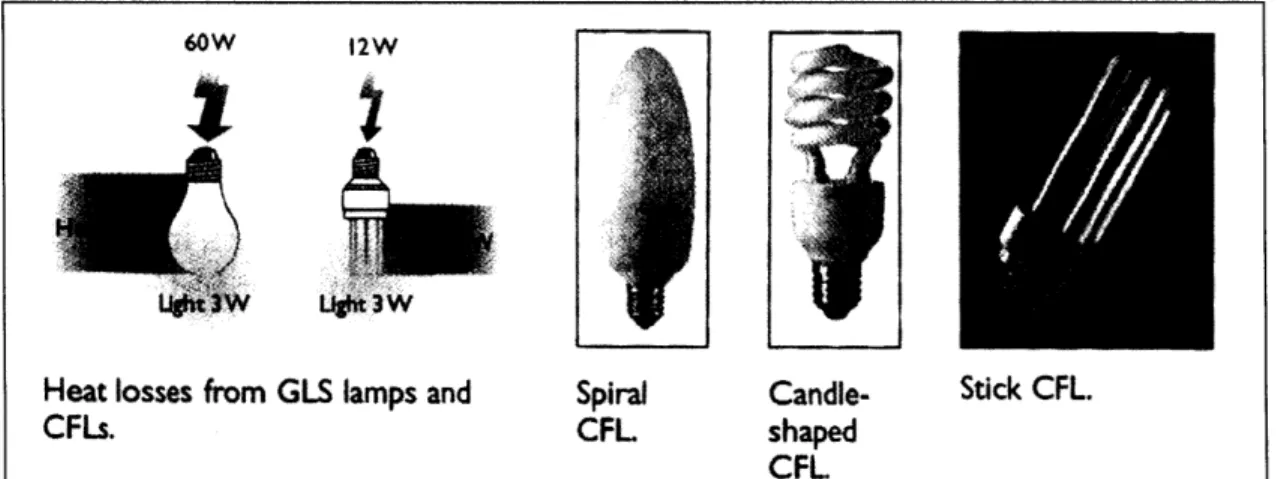
Figure 2.12: Features of a compact fluorescent light bulb (CFL) (IEA, 2006) ... 40
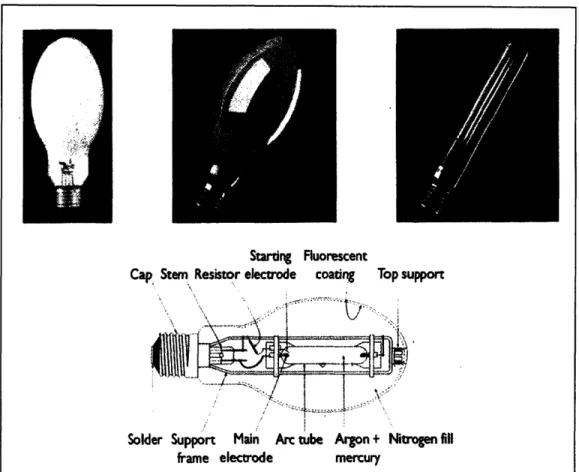
Figure 2.13: Features of HID lamps (IEA, 2006) ... ... 41
Figure 2.14: Composition of an LED (IEA, 2006) ... 41
Figure 2.15: Illumination cost comparison (Mills, 2005) ... .44
Figure 3.1: Location of SELCO, THRIVE and Ankuran (Mapsoflndia.com, 2005) ... 49
Figure 3.2: Energy sources for lighting among Indian households (Ailawadi et al., 2006) ... ... . ... ... ... 50
Figure 3.3: Status of electricity access in major states (Ailawadi et al., 2006) ... 52
Figure 3.4: SELCO-India's operation structure ... ... 58
Figure 3.5: THRIVE's first LED lighting model... 64
Figure 3.6: THRIVE lighting units.2003-2005... 65
Table 2.1: Comparison of electric lighting sources or lamps (IEA, 2006) ... 42 Table 2.2: Comparison of lighting sources during site visits in India ... 45
Table 3.1: Comparison of THRIVE versus SELCO-India... ... 48
Table 3.2: Countries with large populations without electricity access in 2000 (Ailawadi et al., 2006) ... 52
This thesis outlines a set of best practices for scaling up businesses selling small-scale technologies in developing countries without compromising social motives.' While the evidence presented focuses on lighting technologies in the poorest population (i.e., Bottom of the Pyramid (BOP)) sectors of India, the lessons learned are applicable in a much larger context. The information in this thesis will be of great value to entrepreneurs, investors, and persons generally interested in the scalability of businesses in BOP
markets in developing countries.
Before moving forward, it would be best to define two important terms - "scalability" or "scaleup" and "BOP." "Scalability" is an oft-used term in software engineering to
describe system robustness. Quite simply, a scalable system is one that can easily expand (possibly infinitely) to handle more throughputs. In the business world, the term is less well defined. As I use it, the term means, the ability of a business to expand and replicate itself beyond its original market in terms of market size and geography.
"Bottom of the Pyramid" or "BOP," is another term that has long been around but only recently popularized by C.K. Prahalad. In his book Fortune at the Bottom of the Pyramid, Prahalad defines BOP as the portion of the world's population living on less than US $2 per day (in US Purchasing Power Parity of $1500 per year), approximately four billion people (Prahalad, 2006). The World Resources Institute (WRI, 2007) recently published an extensive demographic study on BOP communities. According to them, these four billion people live on an annual income of less than US $3000 (in local purchasing power) and under. Because of its extensive and in-depth nature, I will use the WRI definition.
There is much debate about the exact size and purchasing power of the BOP sector, as well as the ethics of working in these markets. Jeffrey Sachs, for example, indicates that the poor have limited purchasing power, and what they need are skills and infrastructure before their markets can develop (Sachs, 2005). On the other hand, Prahalad (2006) and the WRI (2007) argue that the poor indeed have significant purchasing power that has consistently been ignored, which has resulted in the formation of informal economies where they are paying much more than communities operating in formal markets in the same areas. They argue for more formal investment by multinational corporations (MNCs) to formalize the informal markets of the poor. Still others, like Aneel Karnani (2006), argue that the BOP market size calculated by Prahalad is hugely bloated, and that the poor should be viewed as producers rather than as consumers, as their purchasing power is not significant.
As I use it, social motives or being socially motivated means that the organization places the advancement of the client's best interests and the general betterment of society on par with their profit bottom line. In some circles this is also referred to as socially responsible business or corporate social responsibility.
My thesis will not go into the debate on the size or functionality of BOP markets. Rather it will focus on a point of agreement of the four theorists-that there is a significant portion of the world's population that is poor and that they need access to good
infrastructure and skills in order to develop. For numerical data, I will primarily rely on the WRI (2007) study. It is an extensive and vital study that measured the variability of BOP markets across continents, countries, income brackets, and sectors, and is one of the most comprehensive studies done to date. Based on the WRI data, almost two-thirds of
the world's population-- approximately four billion people -- lives at or on less than an
annual income of US $3000 (in local purchasing power).
My overall purpose with this thesis is to equip any entrepreneurs, investors or institutions interested in serving these populations, with a set of the best practices or skills that they can use in their attempt towards furthering these goals.
1.1
Background and Motivation
In February 2005, I had the unique opportunity to work with a few Development Marketplace (DM) finalists as part of a graduate class at the Massachusetts Institute of Technology Sloan School of Business (MIT-Sloan). The DM is a worldwide grant competition administered by the World Bank (WB) to fund creative small-scale development projects with the potential to replicate. Every year, several thousand entrepreneurs from around the world compete for grants of up to US $200,000 under a rotating theme. In 2005, the theme was "water, sanitation, and energy." For the class, interested DM finalists were paired up with graduate students who offered a range of technical and business expertise with the goal of making the finalists' proposals and business plans more robust.
DM grantees are judged on five overarching benchmarks:
* Innovation
* Practicality and robustness
* Financial viability
* Organizational sustainability
* Scalability
The most interesting questions asked by my DM clients surrounded scalability: what models or literature was available, and what were the best practices. My search for
answers yielded little information - both in the regular business sector and within the
BOP community. Most entrepreneurs, venture capitalists, and strategists agree that scalability is very hard to predict, which might account for the lack of literature. Still there continues to be great interest in the field, particularly in social ventures where grant-giving agencies and BOP entrepreneurs, like my clients, want to ensure the sustainability of their investments. Some of the WB DM staff also expressed curiosity about why some of their DM winners had successfully scaled up, where several others
were struggling. It was an attempt to understand this issue that set me on the course of this thesis.
In order to study scalability more systematically, I decided to do a case-study analysis of successful organizations that had scaled up in comparative industries in BOP
communities. An exhaustive search yielded two such organizations-SELCO (Solar Electric Light Company, Private Limited) and THRIVE (Volunteers for Rural Health and Information Technology)-that sell artificial lighting technologies in BOP markets in southern India. Artificial lighting offered a very interesting industry to study because its importance and impact is often overlooked in infrastructure development and poverty alleviation. The United Nations (UN) and the WB agree that infrastructure plays an important role in poverty alleviation, as outlined in the Millennium Development Goals (MDGs), and it is one of the most difficult sectors in which to operate (WB, 2007a). While infrastructure systems such as water, electricity, sanitation, and roads provide the foundation necessary for the operation of human society, they are rarely provided to BOP consumers. This might be because infrastructure is generally publicly owned, developed, and operated, and in the absence of resources or efficient governance, its development falls apart. In many of these cases, private sector involvement or public-private
partnerships further complicate infrastructure development in these struggling economies. Most developing countries have patchy infrastructure systems that favor the higher population density of urban sectors, where residents have a higher ability to pay and more political coercion. There is also the financial incentive of developing in denser areas because there is greater infrastructure use per unit of investment. Conversely, less dense rural sectors and urban poor (BOPs) who are less likely to pay for the services are ignored. Informal and often more expensive economies develop to fill in these gaps (Prahalad, 2006). This is true for artificial lighting as well.
Over 1.6 billion people, nearly a quarter of the world's population, lacks access to electricity. This population relies on kerosene, candles, batteries, and biomass for their lighting, which has a significant impact on their health, socio-economic status, and the global environment. Yet lighting is generally ignored when prioritizing infrastructure development, often taking a backseat to water, transportation, sanitation, and other outcomes of electrification such as the mechanization of industry, even though it is extremely important for economic development. This was obvious from the lack of literature on the subject. For these reasons, lighting was an intriguing subject to study. Besides their focus on lighting technology, SELCO and THRIVE are interesting for four main reasons:
1. All of their lighting products incorporate the latest and most energy-efficient technologies, like compact fluorescent lights (CFLs), light emitting diodes (LEDs) and solar photovoltaics (PVs).
2. They are strongly socially and environmentally committed organizations, whose goal is to make quality lighting affordable to the poor. Both are unwilling to compromise on their motives.
3. Both organizations were started by and continue to be driven by bottom-up entrepreneurs. They began as small social experiments without access to funding from large MNCs or venture capitalists (VCs) and grew organically from there. The founders used the same local institutions that would be at the disposal of any average Indian citizen in order to develop. Therefore, their stories can serve as models for any other bottom-up entrepreneur in most countries.
4. Both companies had started and successfully scaled up in BOP markets, within relatively short periods of time. In other words, they proved that quality
(sometimes expensive) advanced technology was desperately needed, demanded, bought and used by an increasing number of BOP consumers. THRIVE had scaled up sales of their LED-lantern from 120 to over 33,000 clients in one year (2006-07); while SELCO had scaled up their solar PV-based system, from 100 to over 55,000 clients in eight years (1998-2006).
Despite their similarities, SELCO and THRIVE operate very differently. The former is a registered profit-generating company that sells US $200-1000 PV systems to their clients without any subsidies; the latter is a registered nongovernmental organization (NGO) that sells subsidized US $15 LED lanterns. SELCO and THRIVE are presented as heuristic case studies. Each of the organizations has been independently studied and analyzed. Their successes prove that there are alternative models, rather than a single one to solve a similar problem.
1.2 Range of Applicability
SELCO and THRIVE's ability to expand successfully within the realm of infrastructure in BOP communities creates new possibilities for other entrepreneurs and investors interested in tapping into this space. Because infrastructure is such a difficult sector to be
successful in, the lessons learned from analyzing SELCO and THRIVE are surely applicable to businesses in other sectors.
In addition, BOP sectors are some of the most challenging to operate within for a variety of reasons. Chief among them are the persistent lack of infrastructure, which greatly limits connectivity between markets and hinders supply chains; and a predominantly illiterate client base with extremely limited purchasing power. Often clients with the greatest need are located in rural, often remote communities further compounding market accessibility. To complicate things further, bottom-up entrepreneurs and BOP customers have great difficulty obtaining financing. Most lending institutions cater their financing to non-BOP customers who earn, spend and save differently from a BOP customer. For example, current lending and credit practices require a monthly loan repayment which works well for customers who earn on a monthly or biweekly basis. But most of the BOP earns on varying cycles. For example, farmers earn money on a biannual cycle,
coinciding with the harvest seasons. Their spending and savings cycles follow their earning cycle, i.e., they spends a lot immediately before and after the harvest, while
spending diminishes as time passes. To complicate matters further, harvest seasons between different crops are staggered, thereby making a single biannual payment cycle
ineffective. On the other hand, daily wage laborers subsist on a small daily income and typically save very little for the next day. Considering the varying schedules of the
different farmers and daily wage laborers who constitute a part of the larger BOP, it is very difficult to institute a single payment system. It is further understandable why a monthly system most definitely will not work for these communities.
Overcoming the obstacles outlined above, such as the lack of a skilled work force, dependable supply chains, and the constant battle of balancing the quality of their products with affordability, make operating in BOP markets extremely capital intensive.
This is why MNCs are able to get past the initial barriers, rather than bottom-up
entrepreneurs. For example, during my travels to even the remotest parts of a developing country, I saw ubiquitous bottles of Coca-Cola. Only rarely did I see a regional "brand" competitor drink outside its initial market area. It is in this context that the success stories like THRIVE and SELCO stand out. Entrepreneurs who are able to survive and thrive in these most challenging environments are likely to teach lessons that will apply
particularly throughout BOP sectors and even in mainstream business operation.
The fact that SELCO and THRIVE are operating in India adds further dimensions to their success. India is interesting because of its complexity, diversity, and challenging market environment. A country that has been experiencing astounding economic growth, it ranks 126 h out of 177 countries, on the UN Human Development Index. Almost 40% of the
population is still illiterate (UNDP, 2006c), and 60% of the workforce is employed in the agricultural sector, contributing less than 20% to GDP (CIA, 2007). Over 35% of the population or almost 580 million people lack access to electricity, the largest amongst all populations in the world (IEA, 2002). India is also a melting pot of castes, cultures,
languages, and colors, each of which poses its own set of issues in terms of scaling up. BOP communities speak, read, and write in different languages both within and across different states, and the caste system further complicates social structure. Considering these immense challenges of basic business operability, the fact that THRIVE and
SELCO are able to sell and scale up beyond their original markets is truly remarkable. Lessons from here can surely apply to entrepreneurs across India and the world. Overall, because these two organizations have scaled up successfully in extremely complex environments (rural India), within the most challenging market segment (BOP consumers), within a sector that is desperately needed and difficult to sell within
(infrastructure), I believe the conclusive best practices are robust enough to be applicable outside of this niche.
1.3
Methodology
My research was conducted in two segments: background research and field assessments. Background research primarily took place over the autumn of 2006 and the spring of
2007. Theoretical research was augmented by interviews with the WB DM team, business strategists, engineers, venture capitalists, professors, and entrepreneurs. Information collected was primarily qualitative.
The interviews were generally unstructured. No questionnaires were used. My goal in every interview was to understand the perspective of each of these professionals with regards to successful entrepreneurship and scalability. I also asked them to reflect on some of my findings as necessary.
Field assessments took place on-site over January 2007. Assessments were primarily qualitative and consisted of interviews with THRIVE and SELCO staff at all levels, clients, partners, and financiers, as well as extended field visits where staff were
shadowed. Of the 28 field days, approximately 19 days were spent on-site with THRIVE, three days were spent with SELCO, and six days interviewing other possible leads,
including officials at the Andhra Pradesh State Electricity Board (APSEB) and local energy experts, as well as traveling between sites. The disproportionate difference in time spent between THRIVE and SELCO is because THRIVE had very little of their progress or procedures documented compared to SELCO. This presented a series of challenges, and will be discussed further in Chapter 3. In addition, SELCO had been visited and studied by several student groups whom I interviewed at greater length upon return to MIT.
The field assessments were critical for the development of the case studies. Both SELCO and THRIVE gave me complete freedom to communicate with all of their staff and some clients. I also interviewed several MIT student groups who had visited SELCO over the past year, and sat in on conversations and lectures delivered by Harish and Ranga, the founders and managing directors of SELCO and THRIVE respectively. Their answers have been generally consistent with my observations.
Interviews during the field assessments were also unstructured. Having interviewed clients and staff from across the organization without prior notification, I'm confident that the answers were honest and have proven to be consistent throughout the hierarchy
During site visits in January 2007 to rural and tribal communities in some of the remotest parts of India, I found a significant demand for quality artificial lighting. Tribespeople outlined a seemingly unending list of reasons for why they needed electric lighting over the traditional wick-based lighting that they have been using for centuries. Among others, they said the safer and better quality electric light was essential for their children to study, for hunting during the torrential monsoon rains and to keep the animals away during the harvest without risk of losing their crops to fire. The women talked about the hours they lost everyday collecting wood from the forest to be used for their energy needs.
As indicated by some of the poorest people, access to quality lighting has a significant impact on our health, safety, socio-economic status and the environment. This chapter starts by exploring these issues then introduces the reader to the technical aspects of lighting. The technology is critical for understanding the complexity involved in
rectifying lighting accessibility. It will also set the stage for the case studies presented in the next chapter.
2.1
Lighting: Introduction and Importance
The International Energy Agency (IEA, 2006) estimates that lighting takes up 19% of global electricity consumption. Yet this only represents three quarters of the world's population. The other 25%, or approximately 1.6 billion people, live in non-electrified households in developing countries. Most of these communities get their lighting from kerosene, biomass and candles, all very poor sources of light. In the developing world, nearly 14% of these households are located in urban areas; 49% are in rural areas. The most staggering statistic is that in the least privileged parts of Africa, less than 1% of households, have access to electricity (Mills, 2005). Many more have only intermittent
access.
One might wonder what these communities are using instead of electricity, what impact that might have on their communities and the world at large, and why the developed world should care. As this section and the rest of the chapter will show, these
communities use some of the most financially and energy inefficient means of lighting (burning oil and biomass), which on a macro-level contribute significantly to greenhouse gas (GHG) emissions. The use of these fuels also has an immediate impact on the health, livelihoods, and economic status of the community residents. The developed world should care not only because it is morally right, but also because these methods of lighting will affect us.
Combustion-based lighting produces carbon dioxide, water vapor and other GHGs, which are responsible for the climate crisis we are already experiencing. Figure 2.1 shows a
distribution of non-electrified households around the world, as well as projections for 2030 in a "business as usual" scenario. The IEA (2006) estimates that by 2030, 1.4 billion people will lack access to electricity. One can only imagine the impact of this dismal scenario. In order for developing countries to reach the UN MDGs, they need to improve the quality and quantity of energy available to their citizens. Of the eight MDGs, at least three are directly linked to lighting. For example, universal access to primary education is impossible if the students have no light to study with. And as the rest of this section will
elaborate, both poverty and environmental sustainability are significantly related to electricity access. Additionally, considering current energy prices, environmental conditions, projected population growth, and existing unmet energy demands, the need for better sustainable lighting practices is exceedingly important both in developing countries and the world at large.
Figure 2.1: Number of people with no access to electricity in 2002 and projected number in 2030 if no new measures are implemented (IEA, 2006)
2.1.1 The Importance of Lighting in Environmental
Sustainability
Lighting contributes significantly to the world's carbon dioxide (CO2) emissions. As
stated earlier about 19% of the world's electricity goes to meet our growing appetite for
light. The IEA states that "the energy consumed to supply lighting entails GHG emissions
2002 2030
0
I
.6 billion people 1.4 billion people
Ia _I _ _ - --- ' ·I ..-~~-.-I-.--- --- --- ----;9 ~,. cL· i 1. ,, I
..
...-Iof... 1,900 Megatons (Mt) of CO2 per year, equivalent to 70% of the emissions from the
world's light passenger vehicles" and about three times aviation fuel emissions. The poorer populations that use kerosene and other combustion-based fuels for lighting are the largest emitters of CO2. While these provide only 1% of global lighting, they are
responsible for 20% of CO2 emissions from lighting. In an era of tight oil markets, these
poor economies consume 3% of the world's oil supply, which is more than the total output of Kuwait (IEA, 2006). Based on available sources and rates of use (fuel lamps burning for about four hours per day), Mills (2005) calculated the overall fuel
consumption in the non-electrified sector to be 77 billion liters per day or 1.3 million barrels of oil per day equivalent.
What is of great concern is that many developing countries, like India and China, are rapidly growing and emulating the industrialization of the Organization for Economic Cooperation and Development (OECD) countries whose per capita energy consumption is extremely high compared to developing countries. For example as of 2006, an average North American uses 101 Megalumen-hours (Mlmh) per year, while an average Indian uses approximately 3 Mlmh per year.2 Considering current practices and growth trends,
the IEA (2006) estimates that global demand for lighting will be 80% higher by 2030,
and lighting-related CO2 emissions will rise to 3 gigatons by then.
Another problem is that of environmental degradation. Nearly a quarter of the world's population in developing countries is using kerosene, petrol, diesel, biomass (such as wood, dung, biogas, charcoal, and vegetable oils), candles and batteries for lighting. Besides the environmental impact of using these, biomass harvesting leads to increasing deforestation and CO2 emissions. In addition, deforestation leads to environmental
degradation. Deforested areas lose their top soil (the most fertile layers of soil) during rainy seasons and flooding and are unable to build back up without green cover.
Increased flooding also causes loss of life. Thus, economically challenged communities have lost their livelihoods and lives in an attempt to find fuel for their needs, further entrenching themselves in the cycle of poverty. A sad example of this is the country of Haiti, whose high levels of deforestation have reinforced a continuing cycle of
environmental degradation, devastating flooding, loss of life and increasing poverty.
2.1.2 The Impact of Lighting on the Health and Safety of
BOP Communities
Aside from the macro-health issues that come from increased CO2 emissions, many of
BOP communities have to deal with more immediate health and safety issues such as smoke inhalation, visual impairments, and house and forest fires.
The World Health Organization (WHO) estimates that over 3 billion people rely on solid fuels such as wood, dung and biomass for their energy needs (see Figure 2.2) (WHO,
2 A lumen-hour (lmh) is a measure of light output, or how much light comes out of a source at any
2006). 3 The resulting indoor air pollution causes 1.5 million deaths annually, and numerous other respiratory illnesses such as pneumonia. Epidemiological studies cite elucidated risks particularly for women and children, who spend most of their time
around the burning fuel (see Figure 2.3). They also found that PMo0 (i.e., particulate
matter measuring less than ten microns, which is of consequence because they deposit in the air sacs in the lungs thereby causing adverse health reactions) over a 24-hour period
in a biomass-burning house was 300-3000 micrograms per cubic meter ([tg/m3), with
peak counts at 30,000 [g/m3. Compare this to the maximum mandates for outdoor air
pollution of the United States Environmental Protection Agency (USEPA) and the
European Union (EU) of 50 ýtg/m 3and 40 [g/m3respectively.
Figure 2.2: Percentage of population using solid fuels (WHO, 2006)
In addition to respiratory risks, poor quality light can cause significant visual impairments through continuous eyestrain. What makes it worse is that the poorer
populations rarely have access to trained eye-specialists. Without glasses, their vision can deteriorate rapidly affecting their economic productivity.
Finally there are significant safety risks posed by the burning of open fires inside or near the house. During visits to developing countries, including my most recent site visits to India, I frequently saw children who had unwittingly burned different parts of their bodies when they had wandered into burning lamps. In India, I heard of several women who had burned to death when their clothing had caught fire while they were cooking on an open flame or when they had accidentally knocked over a kerosene lamp.
Health outcome
Acute infections of the
lower respiratory tract Chronic obstructive
pulmonary disease
Lung cancer (coal)
Lung cancer (biomass) Asthma Cataracts Tuberculosis Evidence' Strong Strong Moderate I Strong Moderate I Moderate II Moderate II Moderate II Moderate II Moderate II Population
Children aged 0-4 years
Women aged 2 30 years
Men aged > 30 years
Women aged > 30 years
Men aged > 30 years
Women aged 2 30 years
Children aged 5-14 years
Adults aged > 15 years
Adults aged > 15 years
Adults aged _ 15 years
Relative risk' 2.3 3.2 1.8 1.5 1.6 1.2 1.3 1.5 Relative risk (95% confidence interval)' 1.9-2.7 2.3-4.8 1.0-3.2 1.1-3.5 1.0-2.5 1.0-2.1 1.0-2.5 1.0-1.5 1.0-1.7 1.0-2.4
Strong evidence: Many studies of solid fuel use in deiaoping countries, supported by evidencefrom studies of active and passive smoking, urban air pollution and bsochemical or laboratory studies.
Moderate evidence: At least three studies of solld fuel use in developing countries, supported by evidence from studies on active smoking and on animals. Moderate i: strong evidence for specific age/sex groups. Moderate I1: limited evidence.
The relative risk Indicates how many times more likely the disease is to occur ta people exposed to indoor air pollution than in xnerposed people.
The confidence interval represents an uncertainty range. Wide intervals indicate tower precision; narrow intervals indicate greater precision.
Figure 2.3: The impact of indoor air pollution on human health (WHO, 2006)
2.1.3 The Impact of Lighting on the Livelihoods of Users
A secondary outcome of the lack of good quality lighting is its effect on poverty.
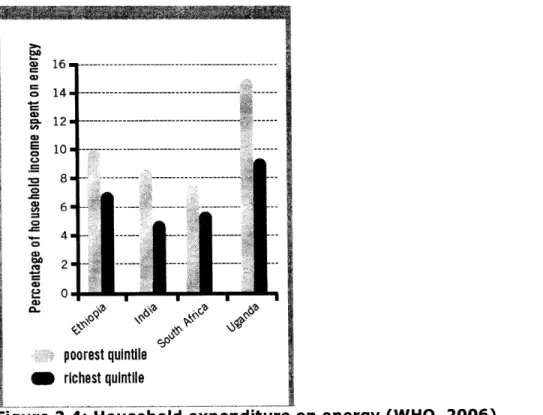
Deforestation and poor health impact economic productivity particularly in BOP communities, which rely heavily on manual labor, agriculture, and herding for their livelihoods. Also energy expenses factor heavily into household income. The IEA (2006) states that on average, non-electrified communities pay significantly more for their lighting than wealthier families for much poorer quality light. Considering the income differential, this constitutes a significant percentage, as shown in Figure 2.4.
There is also the issue of time spent on fuel collection. Surveys of different African countries found that women spent up to four hours per day collecting fuel (see Figure 2.5), which could have been spent on other income-generating activities or for rest. During site visits in southern India in January 2007, I heard frequent complaints about how time-intensive fuel collection was. Surprisingly, this was true even of kerosene collection from the local ration shop. In India, where heavily rationed kerosene is the primary lighting fuel for non-electrified communities, some residents queued for as much as three days every month hoping to get their rations. The supply was never guaranteed,
I N S U F F
I
C I E N T -- i ! Iand residents often came home with adulterated versions of kerosene. Even with kerosene access, the women and children spent several hours supplementing it with wood from the forests or vegetable oil that they extracted to burn in their lamps. In fact, workers at a ration shop told me that the Indian government expects rural communities to supplement their kerosene rations with other sources. For example, urban dwellers are given five liters of kerosene per month compared to rural households, which are limited to three liters, for this very same reason.
The risk of fires also poses a significant concern for livelihoods. Farmers, tailors and weavers, for example, are extremely susceptible to fires as their work is light intensive and their wares are highly inflammable. I've seen many weavers and tailors work with a candle precariously placed on or near their mills and sewing machines. Silk farmers can lose an entire season's earnings if a few drops of kerosene or wax fall on their harvest. Additionally, these professions are extremely susceptible to eye strain and resulting visual impairments because of the visually intensive nature of their work. As their eyes weaken, so does the quality of their work and their corresponding economic outcome.
au Jb. S14. a) n. 12. a, E 10. C., -= 8. o6 6" o 4- 4l S21 aO a) - --- L--- ---poorest quintile 1 richest quintile
Figure 14illousehold Ependiture on energy (WHO, 2006). g;i
--- --- --- ~- ---
---Figure 2.5: Hours per day spent by women collecting fuel, 1999-2003 (WHO,
2006).
2.1.4 The Socio-Economic Impact of Electricity Access
Access to electricity is positively correlated with socio-economic progress. This was most obvious in the late 1800's when the invention of the light bulb and transformer resulted in the large-scale production of electricity which spurred the industrial revolution, and economic growth rates unseen before.
While causality of electricity use to economic growth is still being established, most authors and academics agree that there is a relationship to some degree. For example, an analysis of household lighting in China found a near linear relationship between the two as shown in Figure 2.6 (IEA, 2006). The IEA explains that this type of linear relationship is less likely to hold once income levels rise and income becomes less of a constraint on total service provision. Figure 2.7 shows the correlation between the Human
Development Index (HDI) and per capita energy use. Pasternak (2000) theorized that HDI and per capita energy consumption were positively correlated until it reached the threshold value of 4000 kilowatt-hours (kWh) per capita consumption, after which the relationship plateaued, i.e., HDI was largely unaffected. Considering that most
developing countries fall under this threshold (see Appendix 1, with 2003 values), it can be theorized that their HDI will increase with increasing rates of electricity consumption. On average, countries with high HDIs tend to use far more electricity than countries with lower HDIs. For example, the average per capita electricity consumption in 2003 for an
4. 3.5.m 31m 2.5. C0
VI 2 m
P
1.5m 1.50.5 m
0 M
I--- --- r---C--- -- - -- ---.---H·I~
--- r --- --- --- -I - M -I I I I a I I I I I I ...---I - - -- I -~-~-~~----~ ~ -- -r a ~LIC, I·L~·ICIL~·II -- -- - -- ---- --- --- -- --- --- --- -- --- --- --- --PCP~B · Iccb ·o~ .IoOECD country was 8,777 kWh. Compare that to the same for the Least Developed Countries (LDCs), which is 114 kWh (UNDP, 2006c). As the statistics for the LDCs indicate, it can also be shown that the converse is true, i.e., lack of access to electricity is correlated to poverty.
In an extensive study on available lighting sources in developing countries, Mills (2005) found that typical residential electric sources (such as incandescent bulbs, LFLs and CFLs) gave out at least 500 times more light (lumens) at a im distance than a wick-based lantern, which is the preferred means of lighting in non-electrified households.
Consequently, the ability to function or perform visually oriented tasks is impaired in lower lighting, causing lower economic productivity. For example, I noticed during multiple site visits to non-electrified communities around the world, that many of the residents planned their day's activities around the availability of sunlight. All
economically productive work was done while the sun was out. Between dusk and dawn, work slowed down considerably. I also noticed that more children were dropping out of school in communities with poor or no access to electricity. One explanation for this is that the children went to school and did chores (including collecting wood from the forest) while the sun was out. At night, when they finally had time to study, there was only wick-based lighting, which made it very difficult for them to work. Few finished their homework; they would fall behind in school and eventually drop out. These are just a few observed examples of the impact that electricity access has, both in terms of time saved to be more economically productive, and in improving literacy in poor
communities.
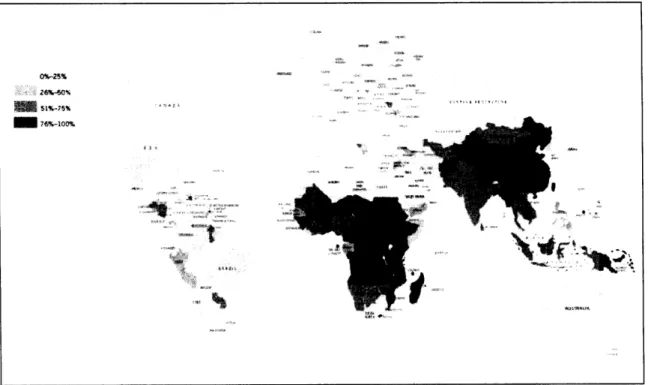
Probably the most powerful visual example of the electricity-income relationship is shown in Figure 2.8, a satellite picture of the earth at night. What is obvious is that the more developed countries, such as the countries that are part of the OECD have
significantly higher rates of electrification than non-OECD countries. For example, per capita energy use in North America is eleven times higher than that of sub-Saharan Africa (WEA, 2004).
It is also true, as discussed earlier and shown in Figure 2.4 that energy takes up a significant percentage of a BOP household's income. An extensive study by the World Resources Institute (WRI, 2007) substantiates the data by the WHO study that on average BOP households spend about 9% of their income on energy. This takes a heavy toll on their ability to save.
0 50 100 150 200 250 300 350 400
Lighting electricity use per household (kWh/year)
Figure 2.6: Average annual household-lighting electricity consumption versus income in China (IEA, 2006)
0.
OA
03
02
10000 11000 12000 13000
I VW fVMV UAUy 4unj M WU uI Io 800um 90t
Per capita energy consumption (kgoe/capita)
Figure 2.7: Relationship between HDI and per capita energy
Figure 2.8: Composite map of the earth at night (NASA, 2000)
2.1.5
The
Market
Size for Rural Lighting
One of the major upsides to this otherwise dismal view of rural electrification is the potential market size. Small-scale entrepreneurs can tap into a 1.6 billion-consumer market that generates US $38 billion annually (based on annual fuel sold to this sector, IEA 2006). Granted that these communities are in remote areas with limited disposable incomes (BOP sectors), but they still spend as much as, if not more, for their lighting as electrified households for very poor quality lighting (IEA, 2006). As discussed earlier, at least 9% of a BOP household's income is spent on energy, which translates into an enormous market when considering the size of the BOP population. Any entrepreneurs who develop quality products for the BOP population could potentially chum out a profit, with enormous potential for scalability. Consider Figure 2.1 where a "business as usual" scenario, predicts an almost stable market size moving into 2030. In addition,
entrepreneurs are able to extend a service that is desperately needed and could have enormous positive impact in these areas, while at the same time generating a profit for themselves. This thesis focuses heavily on the potential of this type of scenario, within the large and stable market of quality lighting. The next chapter further examines exactly this scenario with detailed case studies of two small-scale entrepreneurs who have successfully scaled up lighting technologies in the BOP markets of southern India.
2.2 Salient Features of Electricity, Solar Power and
Kerosene
This section highlights some of the necessary salient features about electricity, solar power, and kerosene. While this is a simplified version of energy generation in
developing countries, it gives some necessary background for some of the issues raised in this chapter, as well as in preparation for the case studies presented in the next chapter. The primary source for the material provided below is a series of lectures given by Henry Lee and John Holdren, in March and April 2007. Henry Lee is a lecturer and director of the Environment and Natural Resources Program at the John F. Kennedy School of Government (KSG), Harvard University. John Holdren is a professor and director of the Program on Science, Technology and Public Policy at the same, as well as a professor in the Earth and Atmospheric Sciences Department at Harvard University.
2.2.1 Electricity
"Electric current" or "electricity" is just one part of a much larger electricity system that consists of generation, transmission, grid or network coordination, distribution, and marketing. While the basic components of electricity, i.e., electric current generation, wiring, transformers and lamps were invented by the late 1800's, the system itself evolved through much of the earlier part of the 1900's to what it is today. Increasing population continues to demand greater efficacy of the system, and some proponents say that it is still evolving.
All the different parts of the electricity system work very differently from each other (in terms of lifespan, capital and operating costs). This is further complicated by the fact that electricity cannot be stored in large amounts. As a result, generation has to keep up with demand, which changes significantly with both micro (daily usage) and macro (annual) usage. Short-term demand elasticity for electricity is very low at high demand levels and supply is very inelastic at such levels. Not surprisingly, most blackouts in developing countries happen because of lack of adequate standby systems and poor transmission systems. Developing countries also have a high rate of theft in their distribution networks. For example, electricity theft in India leads to annual losses estimated at US $4.5 billion or about 1.5% of GDP (Bhatia et al., 2004).
One very important point to note is that transmission systems are very expensive to build, making it most economically viable to provide electricity to high density, largely urban areas where there are a greater number of connections per unit developed, rather than rural areas where electricity demand is scattered and return on investment is much lower. This is the primary reason for the very large disparity in urban and rural electrification. Therefore, it might be best to develop more efficient off-grid systems in rural areas, particularly in developing countries where resources are constrained.
To understand off-grid systems better, one must understand a few more details about the
nature of electricity. Electricity can be transmitted in two forms - alternating current
(AC) or direct current (DC). AC is the type that is generated in power plants and then transmitted to our homes and offices through the elaborate transmissions systems we see all around us. DC is the type of electricity that is stored in batteries.
Off-grid electricity in developing countries is usually produced in two ways: a generator, which acts as a mini power plant uses liquid or gaseous fuel (generally petrol, diesel, biogas, or kerosene) to generate AC that is transmitted to a mini-grid. The other
alternative is to use batteries, which store DC. Both have their limitations. Fuel is an expensive commodity in BOP communities and even the smallest generators burn up a lot of fuel in order to generate electricity. In every off-grid community I visited, only the wealthier residents could afford to use generators for their electricity needs. Batteries were more commonly used among the BOP. While more expensive per unit energy than fuel burned by the generator, batteries are more widely available, procurable, and
transportable than the energy produced by the generator. For people whose lighting needs are very specific and limited, like with many BOP households, battery-powered light can be more suited to their needs than grid power. But batteries are limited in how much energy they can store and they also generate significant hazardous waste.
Considering what a major role that batteries will continue to play in off-grid systems, it is very important to select lamps or lighting sources very carefully. Section 2.3 will detail the different types of lamps (like LEDs and CFLs) and their properties. In this context, the most efficient bulb (that gives out most light per unit energy input) that works on the lowest power input is most relevant and useful for off-grid lighting in developing
countries.
2.2.2 Solar Energy
Solar power is just one of the many renewable sources of energy being sought out to replace oil dependency globally. Solar energy can be captured by different types of collectors of which photovoltaic (PV) cells are the most widely used. PVs use
semiconductor materials, like silicon, to capture solar energy through a property known as the "photoelectric effect." Solar energy that hits the PV cells causes free electrons to move about, creating an electric current. Most PV cells are used in conjunction with batteries, which store some of the power for use during times of low to no light, such as downcast days or nights.
PVs are advantageous because they have a long life span (greater than 30 years), are high performance (i.e., their energy generation capacity degrades by around 1% every year) and are relatively low maintenance. The only disadvantages of PV systems are that they require regular cleaning, and run the risk of potential leakage of toxic chemicals in the PV cells. The main drawback in PV (or generally solar energy) usage is that they are very
expensive compared to electricity produced from a grid. In the US, PV-based electricity costs three to five times as much as grid electricity (Bullis, 2006). The World Energy
Assessment (WEA) has estimated PV energy to cost approximately US $0.25-0.50/kWh, but they also predict that with increasing research and development, and market growth, the cost can decrease to US $0.05/kWh (WEA, 2000).
On the downside, increasing energy prices and renewable energy policies around the world has increased the demand for PV cells, which has resulted in an increase in global prices. A tight supply of silicon has further created a backlog of demand. For example, the Energy Information Administration (EIA, 2006) states that the US (which is one of the world's largest producers of PV cells) reached record sales of PV in 2005, with PV
cell prices rising by 13% over 2004. This has created some difficulty for off-grid
applications in developing countries, where consumers are particularly sensitive to price volatility.
Solar energy is most regularly and amply available around the equatorial region, where many developing countries are situated. The abundant availability of solar energy
coupled with the long lifespan and other advantages, makes solar PVs an excellent option for off-grid electricity production. The biggest barrier to entry in these markets has been the high cost of PVs and many doubt the possibility of entering the rural, non-electrified household market. SELCO, one of the organizations profiled in the next chapter, is showing that it is indeed possible to "sell solar" in these markets.
2,2.3
Kerosene
Kerosene is one of the many byproducts of petroleum distillation. Kerosene, also known as paraffin, has multiple uses including as jet fuel, as a base for paints and
petrochemicals, and as a fuel for the poorer populations in developing countries. In general, the price of kerosene fluctuates with the price of oil.
In some countries like India, kerosene is the most commonly used fuel for lighting, cooking, and heating by BOP consumers. Because it is a liquid, it is often easier to transport and distribute than natural gas or Liquid Petroleum Gas (LPG),4 which is the preferred fuel for domestic use in electrified households. As discussed earlier, kerosene is extremely inefficient as a lighting fuel, and can be much more efficient as a cooking fuel (it provides more energy in heat than light, which makes it more beneficial for cooking), though there are still health issues related to the burning of kerosene. Countries that have high oil subsidies like India, have thus far shielded their consumers from the price
fluctuations of kerosene which has created a wealth of inefficiencies including inefficient cookstoves and lighting practices, lack of innovation in these areas, and informal
markets, which will be further discussed in Chapter 3.
It is also interesting to note that there are studies that show a correlation between fuel choices, literacy and income level. Studies by Farsi et al (2005) and UNDP (2003), it was found that household income, literacy level and gender of the Head of Household (HH),
proximity to larger cities and towns had a significant effect on fuel choices. For example, Households who were illiterate or had lower levels of literacy were more likely to choose kerosene, firewood or dung, over Liquid Petroleum Gas (LPG).
2.3 The Technical Aspects of Lighting
As shown in the previous section, the quality and quantity of lighting have a significant impact on our lives. The communities who suffer most as a result of inaccessibility to quality and quantity of lighting comprise the BOP. And while they are most affected in the short term, the long-term effects already have and will continue to spillover to include the rest of the population, in terms of increased GHG emissions, environmental
degradation, and longer term issues such as immigration resulting from continued poverty. The question then is: how can we improve access to better quality lighting for
the poor? From a business point of view, one of the easiest ways to do this might be to design, mass-produce and market a single lighting product that would address the needs of the people. This would minimize capital and marginal costs, thereby bringing down the market price of the product. However that would assume the homogeneity BOP communities, which is far from accurate. In fact, their needs can be even more disparate than the non-BOP community. For example, the lighting needs of an illiterate silk farmer who will only use light for sieving through his day's harvest are less intensive than those of a school-age child doing her mathematics homework. In this situation the farmer might want a lighting product that conserves energy (and consequently money) by giving him lower quality light that lasts longer than the child whose priority for better quality light means higher cost per unit time.
Given the technical and cost constraints particularly within the BOP community, it is best for lighting to be viewed in a comprehensive way. This section gives the reader a more comprehensive background on lighting and consequently, a greater appreciation for what THRIVE and SELCO are accomplishing. First the reader is introduced to the human factors involved in lighting, followed by a discussion on lighting standards and different
lighting sources within a technical framework. Please note that the field of light and lighting is extremely complex, and this is a simplified version of the issues and terms involved.
2.3.1 Human Factors in Lighting
It is impossible to address lighting standards without first understanding the human factors involved in lighting. "Light" is defined by what the human eye can see, or as visible radiant energy. The entire electromagnetic spectrum is far greater than the human eye can "see" or perceive. "Light" and "lighting" generally refer to the portion of the
electromagnetic spectrum that is visible to the human eye, specifically between the wavelengths of 380-770 nanometers.
According to the IEA, studies have shown that the human eye can function over a vast range of light levels (IEA, 2006). While higher levels of light or more light per unit area (also defined as "lux") is needed for more visually acute tasks, in general, visual
performance is fairly insensitive to the amount of light, once the eye has adapted to prevailing light levels. What is more important for visual task fulfillment is contrast, rather than high light levels. On the other hand, contrast levels that are too high and/or with very bright backgrounds impair vision by producing glare. Consequently, most lighting devices need to incorporate some form of shielding and careful placement to minimize direct eye-to-lamp line of sight. Also because the eye needs time to adjust, it does not perform well in flickering or fluctuating levels of light. This is partially why productivity using wick-based lighting is lower compared to electric sources, including flashlights; and performing more visually intensive tasks in this light can cause
significant eyestrain. Eyestrain also hinders the eye's ability to adjust in varying levels of light effectively, further decreasing visual performance.
The human eye's versatility in performing over a range of lighting levels also makes it very hard to standardize lighting recommendations. Quality of light, which is based on personal preferences, is very hard to measure because people's eyes and perceptions are so diverse. It is therefore measured with relation to quantity, which is also called
"illuminance" and is measured in terms of"lux" and other terms that are defined in Section 2.2.2. Quantity does not accurately capture the distribution of light, avoidance of glare, and color. Considering these factors, it is not surprising that there is great
international diversity in lighting standards. A 1999 study of illuminance
recommendations from 19 countries (including all OECD countries) found a wide range of values (Mills et al., 1999), for example:
* General office lighting ranged from 50-1000 lux. * Reading tasks ranged 75-1000 lux.
* Fine knitting and sewing ranged 50-2000 lux.
Studies cited by the IEA (2006), also found that worker lighting preferences changed across countries. For example, a Canadian study found that North American office workers preferred illuminance levels of around 400 lux, about 25% more than a group of French office workers. The IEA also found that "preferred lighting levels in working environments are often far lower than national recommended values," meaning that national levels were often higher than what workers preferred.
Variability in standards, such as those mentioned above, is very important particularly when considering the minimum level of lighting that small-scale entrepreneurs (like SELCO and THRIVE) should design their lighting technologies around. For example, illiterate populations who are less likely to use the light to read and write may require a
5 1 nanometer (nm) = 10-9
light of lower illuminance, which uses less energy and is cheaper, than school-going children who will need higher lighting levels when doing their homework. In this
scenario, an entrepreneur would be able to design a switch that allows the user to set their lighting preferences. But this feature will increase the capital and operating costs (higher chance of breakdown) of the lantern. Also, lighting preferences between different
communities are likely to be different. For example, Indian tribal communities who are accustomed to working in primarily natural light (which includes low moonlight) might prefer to work with far lower lighting levels than say a Mumbai slum dweller who might be accustomed to high levels of light as a result of his or her urban surroundings. It is therefore very difficult to design a standardized product for BOP communities.
2.3.2
Light Measurability and Standards
In order to appreciate the differences in lighting technology, it is important to define some of the standards for light sources. Please note that lighting standards and
terminology are far more complex than the information provided in this chapter, which aims to provide a basic technical context for the case studies. Therefore, these standards and definitions are simplified. The primary resource for this section, unless otherwise cited, is the Lighting Research Center (LRC, 2006).
a. Light output is a measure of how much light comes out of a source at any given time. It is commonly measured in lumen-hours (lmh). A lumen is a unit time rate flow of light. The Illuminating Engineering Society of North America (IESNA) defines a lumen as follows:
[A lumen is a] Standard International (SI) unit ofluminous flux.6 Radiometrically, it is determined from the radiant power. Photometrically, it is the luminous flux emitted within a unit solid angle (one steradian)' by a point source having a uniform luminous intensity of one candela.
b. Efficacy of a light source is a measure of light output per unit power input into the source, or lumens per Watt (lm/W). System Efficacy includes ballast losses. It is important to note that all light sources give out heat, when producing light. A good rule of thumb when gauging the level of efficacy is those sources that "burn hot" (i.e., give out a lot of heat when providing light) have a lower level of
efficacy compared to light sources that remain cool. Essentially, energy that goes into the bulb (in the form of electricity or burning fuel) will be converted to an equal amount of energy that is a combination of heat (thermal) and light. Consequently, producing more thermal energy (heat) will compromise the production of light energy.
6 Luminous Flux is "the rate of flow of light, measured in lumens. The overall light output of a lamp"
(LRC, 1995).
7 A Steradian is "the solid angle subtended at the center of a sphere by an area on the surface of the sphere equal to the square of the sphere radius" (LRC, 1995).
c. Intensity of light from a source (also known as candlepower) in a particular direction is measured in candelas (cd). A good way to look at this is how much the light from a source diffuses radially as it moves towards the direction in which it is pointed. For example, a laser is very intense, indicating higher candlepower, and diffuses very little as it moves towards the direction in which it is pointed; while light from an incandescent light bulb diffuses significantly as it moves in its pointed direction.
d. Illuminance is a measure of how "well-lit" a particular area is, or light output per unit area. Illuminance is measured in lux (lx) or footcandles (fc), and is very important in determining basic lighting needs.
lux (lx) = lm/m2; fc = Im/ft2 1 lx = .0929fc
A good example of illuminance can be taken from the natural world. Direct sunlight on earth can be around 150,000 lx, while moonlight can be as low as 0.5 lx (IEA, 2006).
e. Luminance is a measure of "brightness," or how the human eye perceives the luminous intensity at a certain distance. It is measured in cd/m2. While
recommendations for lighting are generally made in terms of illuminance, it is important to note that the visual system responds directly to luminance. Therefore, illuminance is an indirect benchmark for lighting levels.
2.3.3 Artificial Lighting Sources
The quality and quantity of light produced by a lighting source or lamp depends on the type of fuel used for the process. For the purposes of this thesis, the most common types of household lighting sources found in developing countries are broadly sorted into two categories: electric and combustion. Electric sources are used by roughly 75% of the world's population, while combustion sources, used by the rest, rely on the burning of fuels such as biomass, kerosene, and candles. These are described in some detail below. Typically, lighting sources or lamps function and deliver light as part of a system. Each lighting system consists of lamp(s) or lighting sources, luminaries (the lamp casing that helps distribute the light into space), and the control gear (which helps regulate, ignite or turn off the light). The economy of any lighting system is dependent on capital costs, the operating costs (which include the fuel and maintenance charges), and any labor costs for installation.
While all of the sources provided here are of significance, the technologies that will be highlighted in the next chapter are CFLs and LEDs. A discussion of these will be presented later in this section.