HAL Id: inserm-01148002
https://www.hal.inserm.fr/inserm-01148002
Submitted on 4 May 2015
HAL is a multi-disciplinary open access
archive for the deposit and dissemination of
sci-entific research documents, whether they are
pub-lished or not. The documents may come from
teaching and research institutions in France or
abroad, or from public or private research centers.
L’archive ouverte pluridisciplinaire HAL, est
destinée au dépôt et à la diffusion de documents
scientifiques de niveau recherche, publiés ou non,
émanant des établissements d’enseignement et de
recherche français ou étrangers, des laboratoires
publics ou privés.
Risk factors for onset of menopausal symptoms: results
from a large cohort study.
Séverine Sabia, Agnès Fournier, Sylvie Mesrine, Marie-Christine
Boutron-Ruault, Françoise Clavel-Chapelon
To cite this version:
Séverine Sabia, Agnès Fournier, Sylvie Mesrine, Marie-Christine Boutron-Ruault, Françoise
Clavel-Chapelon. Risk factors for onset of menopausal symptoms: results from a large cohort study..
Matu-ritas, Elsevier, 2008, 60 (2), pp.108-21. �10.1016/j.maturitas.2008.04.004�. �inserm-01148002�
Maturitas 60 (2008) 108–121
Available online at www.sciencedirect.com
Risk factors for onset of menopausal symptoms
Results from a large cohort study
S´everine Sabia, Agn`es Fournier, Sylvie Mesrine, Marie-Christine Boutron-Ruault,
Franc¸oise Clavel-Chapelon
∗INSERM, Institut National de la Sant´e et de la Recherche M´edicale, ERI20, IGR, Villejuif F-94805, France
Received 4 February 2008; received in revised form 7 April 2008; accepted 9 April 2008
Abstract
Objectives: Menopause, the permanent cessation of ovarian activity, is part of normal aging, resulting in climacteric symptoms
for most women, particularly in Western countries. The objective of the present study was to analyse risk factors for onset of menopausal symptoms.
Methods: Analyses were based on the 28,118 women participating in the French E3N cohort study who reached menopause
between 1990 and 2000. Questionnaires were sent every 2 years, and specifically enquired about use of hormonal treatments, reproductive factors, smoking status, anthropometric measurements, dietary habits and personal medical history, including onset of menopausal symptoms. Hazard ratios were computed from multivariable Cox proportional hazard models with age as the time-scale.
Results: The risk of onset of menopausal symptoms was negatively associated with education level and with some hormonal and
reproductive factors (usual duration of menstrual cycles, parity and current use of oral contraceptives). A decrease in risk was found in those with underweight, overweight and obesity, but only in post-menopause. The risk was positively associated with smoking and alcohol consumption; it was also positively related to certain frequent medical conditions (depression, migraine, benign thyroid disease, atopy), possibly due to underlying common mechanisms such as the influence of vaso-active substances. Among dietary factors, rapidly absorbed sugars and snacking were positively associated with the risk of onset of menopausal symptoms.
Conclusions: Onset of menopausal symptoms seems to be affected by various reproductive, hormonal and environmental factors.
Some of them are modifiable, which may allow suggesting recommendations. © 2008 Elsevier Ireland Ltd. All rights reserved.
Keywords: Menopausal symptoms; Reproductive factors; Chronic disease; Diet; Health behaviours
∗Corresponding author at: ERI20, INSERM, Institut Gustave
Roussy, 94805 Villejuif, France. Tel.: +33 1 42 11 41 48; fax: +33 1 42 11 40 00.
E-mail address:[email protected](F. Clavel-Chapelon).
1. Introduction
Menopause, the permanent cessation of ovarian activity, is part of normal aging. Thirty to eighty percent of women, especially in Western countries, experi-0378-5122/$ – see front matter © 2008 Elsevier Ireland Ltd. All rights reserved.
ence menopausal symptoms [1]. Evaluation of risk factors for onset of menopausal symptoms is thus of interest in view of developing recommendations for perimenopausal women to avoid them. Although some risk factors such as body mass index (BMI)
[2–7], physical activity [2,8], reproductive and hor-monal factors[2,6,9,10], and smoking[5,9–12]have already been investigated in observational studies, results are not consistent[13]. In addition, although use of some dietary supplements is often advocated to release menopausal symptoms[14], little is known about the relationship between diet and menopausal symptoms.
Using data from the E3N (Etude Epid´emiologique de Femmes de la Mutuelle G´en´erale de l’Education Nationale) cohort study, we evaluated the association between onset of menopausal symptoms and a number of characteristics, including reproductive and hormonal factors, history of chronic diseases, and dietary habits.
2. Methods
2.1. Study population
E3N is a French prospective study investigating risk factors for cancer and other chronic conditions in 98,995 women born between 1925 and 1950. All women belong to a health insurance scheme primar-ily covering teachers. All study subjects signed an informed consent form in compliance with the rules of the French National Commission for Computed Data and Individual Freedom (Commission Nationale Infor-matique et Libert´es, CNIL) from which we obtained approval. Part of the E3N cohort (i.e. those who replied to a dietary questionnaire) is also included in the European Prospective Investigation into Cancer and Nutrition (EPIC)[15].
2.2. Data collection
Since June 1990, participants have been asked at approximately 24-month intervals to complete self-administered questionnaires recording information on lifestyle characteristics (e.g., marital status, educa-tional level, physical activity, smoking, and energy expenditure), anthropometric measures, reproductive factors, lifetime hormonal treatments and medical
his-tory. Information on chronic diseases was assessed using multiple-choice questions.
Women were considered post-menopausal if they had had 12 consecutive months without men-strual periods (unless due to hysterectomy), had undergone bilateral oophorectomy, had ever used post-menopausal hormonal treatment (PHT), or self-reported that they were post-menopausal. Artificial menopause was defined as the cessation of menstru-ation following either surgical removal of both ovaries (with or without hysterectomy) or iatrogenic cessation of ovarian function (e.g., chemotherapy or radiation). Age at menopause was defined as age at last menstrual period (unless due to hysterectomy and if the last men-strual period occurred before PHT use); age at bilateral oophorectomy; or self-reported age at menopause.
Dietary data were recorded between June 1993 and
July 1995. The dietary history questionnaire consisted of two parts; the first was on consumption (quantity and frequency) of food groups, the second on qualitative questions that allowed delineating the food groups into food items. The questionnaire was sent with a booklet of photographs to facilitate estimation of portion sizes. The questionnaire assessed dietary consumption of 208 food items and beverages. Both the questionnaire and the booklet of portion sizes were validated[16,17].
Information on menopausal symptoms were derived
from the following question “Are you experiencing (or have you ever experienced) menopausal symptoms (hot flushes, etc.)?” included in each of the five follow-up questionnaires as defined in a previous study[18]. So, women could report hot flushes as well as oth-ers symptoms that she felt in relation with menopause. Women were further asked to provide the date of start of menopausal symptoms. No information was recorded on the type and duration of menopausal symptoms the women experienced.
2.3. Study design
Women included in the present analysis were those with a known age at menopause and who reached menopause after 1990 (start of follow-up), so as to limit recall bias regarding age at menopause, and before June 2000, date at which most women were post-menopausal (end of follow-up). Among these 33,440 women, we excluded women with unknown age at onset of menopausal symptoms (n = 3496) and women
110 S. Sabia et al. / Maturitas 60 (2008) 108–121
Table 1
Hazard ratiosaof onset of menopausal symptoms according to general characteristics
General characteristics %b % MSc,d Multivariable HRd 95% CId p value
Ever married 0.64
Yes 84.67 56.81 1
No 15.42 58.59 0.99 0.95 1.04
Number of years at school 0.006e
<12 9.43 58.81 1.02 0.96 1.07
12–14 72.35 58.49 1
≥15 18.22 55.93 0.95 0.91 0.99
Body mass index (kg/m2) (time dependent) 0.09e
<18.5 3.83 54.97 0.87 0.80 0.95
[18.5–22] 43.46 58.74 0.96 0.92 0.99
[22–25] 33.51 58.64 1
[25–30] 15.67 58.11 1.02 0.97 1.07
≥30 3.53 52.22 0.84 0.76 0.92
Recreational physical activity (metabolic equivalent cost (MET)-h/week) 0.68e
1st quartile:≤ 33.82
2nd quartile: between 33.82 and 45.23 24.28 59.07 1 0.97 1.05 3rd quartile: between 45.23 and 60.81 27.01 57.99 1.01 0.95 1.03
4th quartile: >60.81 24.29 57.97 0.99 0.95 1.05
24.41 57.93 1.00 Smoking (time dependent)
Never 53.58 57.70 1
Ex-smoker 31.91 57.95 1.01 0.96 1.06 0.74
Current smoker 14.51 59.27 1.05 1.01 1.09 0.009
E3N cohort study, 1990–2000, n = 28,118.
aResulting from a full model, i.e. adjusted for menopausal status (more than 1 year before menopause (reference), 1 year before menopause,
1 year after menopause, more than 1 year after menopause) and all variables ofTables 1–3entered simultaneously.
bProportion of women in each class, measured at the end of follow-up for time-dependent variables. cProportion of women who experienced menopausal symptoms in each category of the variable studied. dMS, menopausal symptoms; HR, hazard ratio; CI, confidence interval.
ep for trend.
who reported having experienced menopausal symp-toms before the start of follow-up (n = 1442). Users of phyto-estrogen supplements (n = 384) were also excluded because their use could alter the risk of menopausal symptoms[19]. A total of 28,118 women were thus analysed, among whom 16,350 had available dietary data[20].
2.4. Statistical analysis
Hazard ratios (HRs) and 95% confidence intervals (CI) of onset of menopausal symptoms were esti-mated using Cox proportional hazard models with age as the time-scale and adjusted simultaneously on potential risk factors for menopausal symptoms (indicated in footnotes ofTable 1). Each woman
con-tributed person-years from the date of the baseline questionnaire until the date of onset of menopausal symptoms, date of initiation of PHT (as use of PHT would mask onset of menopausal symptoms), or end of follow-up, whichever occurred first. Menopausal sta-tus (more than 1 year before menopause/1 year before menopause/1 year after menopause/more than 1 year after menopause), was included as a time-dependent variable in the models.
In analyses of dietary intake, follow-up began at the date of answer to the dietary questionnaire (1993). There were two options for categorizing dietary consumption. When a food item was consumed by more than 95% of the women, the reference cate-gory was the first quartile of consumption (including non-consumers); else, non-consumers were used as the
reference group and risks were calculated across tertiles of consumption.
A sensitivity analysis was performed on time periods during which women were not using oral contraceptives (OC), i.e. each woman contributed person-years from the date of the baseline question-naire, or end of OC use, whichever occurred last (n = 19,733).
We further conducted stratified analyses according to menopausal status. In the stratum of premenopausal women, person-years accrued until age at onset of menopausal symptoms or age at menopause (whichever occurred first) (n = 28,118). In the stra-tum of the post-menopausal women with natural menopause, person-years accrued from age at natu-ral menopause (n = 11,916) until end of follow-up. Analyses were not conducted in the group of post-menopausal women with an artificial menopause, due to the low number (n = 1181).
In order to check if the associations found in our cohort were sensitive to educational level, we have stratified the analyses on educational level (less than 12 years of school, between 12 and 14 years of school, and 15 or more years of school).
Tests for linear trend were performed considering categories as an ordinal variable. Log-likelihood tests were used to evaluate potential interaction between smoking and use of OC and between BMI and smok-ing. All tests of statistical significance were two sided. Analyses were performed using the SAS software, ver-sion 9.1.
3. Results
In the cohort study, the response rate was not sig-nificantly influenced by age (for each questionnaire, comparison of mean ages between respondents and non-respondents, p > 0.05). As an example for the last used questionnaire in 2000, those aged less than 60 years had a response rate of 84.4%, and those above had a response rate of 83.7%.
Among the 28,118 women (mean age at start of follow-up = 45.8 years (standard deviation (S.D.) = 3.5) and mean follow-up duration = 5.5 years (S.D. = 3.0)), 16,374 (58.2%) reported first menopausal symptoms at a mean age of 50.3 (S.D. = 2.9) years: 11,957 (73.0%) in premenopause and 4417 in post-menopause (27.0%).
Of the 28,118 women (who all reached menopause dur-ing follow-up), 2147 (7.6%) experienced an artificial menopause, and 987 (3.5%) underwent a hysterectomy without oophorectomy during follow-up. At the start of follow-up, 2595 women (9.23%) were current users of OC. During follow-up, 8975 women (31.9%) used PHT before any occurrence of menopausal symptoms and were therefore censored at the date of treatment start (i.e. did not contribute person-years from this date on).
3.1. Risk of onset of menopausal symptoms according to general characteristics
HRs of onset of menopausal symptoms associated with general characteristics are presented inTable 1. Marital status and physical activity were not associ-ated with the risk of onset of menopausal symptoms. Increasing years of schooling were inversely associ-ated with onset of menopausal symptoms (HR = 0.95, 95% CI: 0.91, 0.99 for women with more than 15 years of schooling compared with women with 12–14 years of schooling, p for trend = 0.006). Compared with women with a BMI between 22 and 25 kg/m2, obese women (BMI over 30 kg/m2) and underweight women (BMI under 18.5 kg/m2) were at lower risk (HR = 0.87, 95% CI: 0.80, 0.95 and HR = 0.84, 95% CI: 0.76, 0.92 respectively). Current smokers had a slightly increased risk of onset of menopausal symptoms as compared to never smokers (HR = 1.05, 95% CI: 1.01, 1.09). There was no significant interaction between BMI and smok-ing (p for interaction = 0.67).
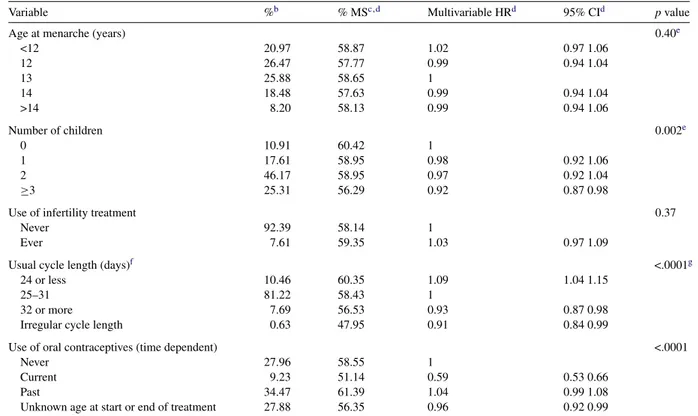
3.2. Risk of onset of menopausal symptoms according to reproductive factors
The association of onset of menopausal symptoms with reproductive factors is presented inTable 2. Age at menarche and use of infertility treatment were not related to the risk of onset of menopausal symptoms. Multiparity was associated with a decrease in risk (p for trend = 0.002). The risk of onset of menopausal symptoms decreased with increasing duration of usual menstrual cycles (p for trend < 0.0001). Moreover, it was lower in women with irregular duration of men-strual cycles compared to women with regular 25–31 days cycles (HR = 0.91, 95% CI: 0.84, 0.99). Current use of OC was associated with a significant decrease
112 S. Sabia et al. / Maturitas 60 (2008) 108–121
Table 2
Hazard ratiosaof onset of menopausal symptoms according to reproductive factors
Variable %b % MSc,d Multivariable HRd 95% CId p value
Age at menarche (years) 0.40e
<12 20.97 58.87 1.02 0.97 1.06 12 26.47 57.77 0.99 0.94 1.04 13 25.88 58.65 1 14 18.48 57.63 0.99 0.94 1.04 >14 8.20 58.13 0.99 0.94 1.06 Number of children 0.002e 0 10.91 60.42 1 1 17.61 58.95 0.98 0.92 1.06 2 46.17 58.95 0.97 0.92 1.04 ≥3 25.31 56.29 0.92 0.87 0.98
Use of infertility treatment 0.37
Never 92.39 58.14 1
Ever 7.61 59.35 1.03 0.97 1.09
Usual cycle length (days)f <.0001g
24 or less 10.46 60.35 1.09 1.04 1.15
25–31 81.22 58.43 1
32 or more 7.69 56.53 0.93 0.87 0.98
Irregular cycle length 0.63 47.95 0.91 0.84 0.99
Use of oral contraceptives (time dependent) <.0001
Never 27.96 58.55 1
Current 9.23 51.14 0.59 0.53 0.66
Past 34.47 61.39 1.04 0.99 1.08
Unknown age at start or end of treatment 27.88 56.35 0.96 0.92 0.99 E3N cohort study, 1990–2000, n = 28,118.
aResulting from a full model, i.e. adjusted for menopausal status (see footnote toTable 1) and all variables ofTables 1–3entered simultaneously. bProportion of women in each class, measured at the beginning of follow-up for time-dependent variable.
cProportion of women who experienced menopausal symptoms in each category of the variable studied. dMS, menopausal symptoms; HR, hazard ratio; CI, confidence interval.
ep for trend.
fUsually, during reproductive life, excluding perimenopause and periods of OC use. gp for trend calculated after exclusion of women with irregular duration of menstrual cycles.
in risk compared to never users (HR = 0.59, 95% CI: 0.53, 0.66). The interaction between current use of OC and smoking was significant (p for interaction = 0.02): in current OC users, current smokers had a HR of onset of menopausal symptoms of 1.27 (95% CI: 1.02, 1.57) compared to never smokers, whereas no signif-icant association was observed between smoking and onset of menopausal symptoms in past or never OC users.
3.3. Risk of onset of menopausal symptoms according to history of chronic diseases
Table 3 presents results on the relation between history of chronic diseases and onset of menopausal
symptoms. A significant association was found with a history of depression (HR = 1.16, 95% CI: 1.12, 1.21), migraine (HR = 1.11, 95% CI: 1.07, 1.16), benign thy-roid disease (HR = 1.07, 95% CI: 1.02, 1.13) and atopy (i.e. asthma, hay fever, allergy or eczema) (HR = 1.08, 95% CI: 1.05, 1.12), as compared with women with no such history. No significant association was observed with a history of diabetes mellitus.
3.4. Risk of onset of menopausal symptoms according to dietary intake
We studied whether eating habits were associ-ated with the risk of onset of menopausal symptoms (Table 4). Each food group was studied separately and
Table 3
Hazard ratiosaof onset of menopausal symptoms according to history of chronic diseases
History of chronic disease (time-dependent variables) %b % MSc Multivariable HRd 95% CId p value
Depression <.0001 No 80.98 57.72 1 Yes 19.02 60.43 1.16 1.12 1.21 Migraine <.0001 No 85.21 57.49 1 Yes 14.79 62.54 1.11 1.07 1.16
Benign thyroid disease 0.007
No 89.43 58.18 1 Yes 10.57 58.71 1.07 1.02 1.13 Atopye <.0001 No 64.66 57.43 1 Yes 35.34 59.70 1.08 1.05 1.12 Diabetes 0.53 No 98.65 58.22 1 Yes 1.35 58.84 1.04 0.91 1.19
E3N cohort study, 1990–2000, n = 28,118.
aResulting from a full model, i.e. adjusted for menopausal status (seeTable 1footnote) and all variables ofTables 1–3entered simultaneously. b Proportion of women in each class, measured at the end of follow-up for time-dependent variable.
cProportion of women who experienced menopausal symptoms in each category of the variable studied. d HR, hazard ratio; CI, confidence interval.
eAsthma, hay fever, allergy or eczema.
adjusted for energy intake and for all other non-dietary variables considered inTables 1–3.
Consumption of vegetables, fruits, fats, cereal foods, meat, fish and seafood, eggs, non-alcoholic bev-erages, and dietary phyto-estrogens was not related to the risk of onset of menopausal symptoms. Con-sumption of soups (p for trend = 0.03) and of alcoholic beverages (p for trend = 0.008) were associated with a significant increase in risk of onset of menopausal symptoms, as did consumption of sweet products, in particular sweet snacks (candies, chocolate, chocolate bars) (p for trend = 0.05), and added sugar [defined as sucrose added to hot drinks or to yoghurt and cottage cheese, as opposed to sucrose already contained in con-fectionary or cookies for instance] (p for trend = 0.008). Consumption of sour cream was associated with an increase in risk (p for trend = 0.02), although over-all dairy products consumption was not related to the risk. Finally, consumption of biscuits was also posi-tively associated with the risk (p for trend = 0.04), while consumption of cakes was not.
These results were suggestive of an effect of snack-ing outside the three main meals (breakfast, lunch and dinner). Since our dietary questionnaire was structured
with up to 8 possible different meals, we could compute the frequency of snacking for each woman. Snacking was significantly associated with the risk of onset of menopausal symptoms, with HRs of 1.07 (95% CI: 0.96, 1.20), 1.11 (95% CI: 1.01, 1.24) and 1.14 (95% CI: 1.03, 1.27) respectively for snacking one, two, and three times outside the main meals compared to no snacking (p for trend = 0.004).
3.5. Sensitivity analysis
In the sensitivity analysis restricted to time periods during which women were not using OC, all results remained basically the same, except results on tobacco, reflecting the interaction noted above (cf. Section3.2).
3.6. Stratified analyses
We examined separately the effect of the potential risk factors in premenopause and in post-menopause among women with a natural menopause. Results remained the same except those on BMI. Before menopause, no significant association was found between BMI and onset of menopausal symptoms
114 S. Sabia et al. / Maturitas 60 (2008) 108–121 Table 4
Hazard ratiosaof the onset of menopausal symptoms according to dietary factors. E3N cohort study, 1990–2000, n = 16,350
Daily consumption Cut-offs Multivariable HRb(95% CIb) p trend
Food items Categories
1st 2nd 3rd 4th Vegetables (g)c 185.3 258.9 350.8 1 1.01 (0.95, 1.07) 0.99 (0.93, 1.05) 0.97 (0.92, 1.04) 0.34 Soups (ml)c 16.4 57.1 149.2 1 1.02 (0.96, 1.08) 1.05 (0.99, 1.11) 1.06 (0.99, 1.13) 0.03 Fruits (g)c 142.3 229.0 325.3 1 1.00 (0.95, 1.07) 0.99 (0.93, 1.05) 1.00 (0.94, 1.06) 0.93 Dairy products (g)c 180.2 275.0 412.0 1 1.00 (0.94, 1.06) 1.01 (0.95, 1.08) 1.00 (0.94, 1.07) 0.82 Cheese (g)d 0 32.1 60.0 1 1.06 (0.94, 1.20) 1.07 (0.95, 1.21) 1.05 (0.93, 1.19) 0.96
Yogurt, cottage cheese (g)d 0 84.1 150.6 1 1.01 (0.92, 1.11) 1.05 (0.96, 1.15) 1.01 (0.92, 1.11) 0.76
Dairy dessert creams (g)d 0 16.4 35.7 1 1.06 (1.01, 1.13) 1.06 (1.01, 1.13) 1.06 (1.01, 1.14) 0.08
Milk (ml)d 0 80.0 210.0 1 1.00 (0.94, 1.06) 1.06 (0.99, 1.12) 0.99 (0.93, 1.05) 0.57 Sour cream (g)d 0 1.12 3.0 1 1.07 (0.99, 1.15) 1.10 (1.01, 1.19) 1.11 (1.03, 1.20) 0.02 Fats (g)d 9.3 14.2 21.4 1 1.00 (0.94, 1.06) 1.02 (0.96, 1.08) 1.00 (0.94, 1.07) 0.89 Cereal products (g)c 142.8 202.2 273.3 1 1.01 (0.95, 1.08) 1.04 (0.97, 1.11) 1.04 (0.96, 1.11) 0.25 Total meat (g)c 70.4 108.8 148.5 1 0.97 (0.92, 1.04) 0.96 (0.90, 1.02) 0.97 (0.91, 1.03) 0.32 Rabbit, poultry (g)c 5.9 19.3 32.5 1 1.02 (0.96, 1.08) 1.02 (0.96, 1.08) 0.99 (0.93, 1.05) 0.80 Others meats (g)c 55.2 86.0 119.7 1 0.97 (0.92, 1.03) 0.94 (0.88, 1.00) 0.98 (0.92, 1.05) 0.30
Fish and sea food (g)c 18.4 30.1 47.3 1 1.00 (0.94, 1.06) 1.01 (0.95, 1.07) 0.96 (0.91, 1.02) 0.29
Eggs (g)c 14.1 22.4 35.1 1 1.03 (0.97, 1.09) 1.03 (0.97, 1.10) 1.03 (0.96, 1.09) 0.49
Sweet products (g)d 0 25.1 51.8 1 1.09 (0.97, 1.22) 1.10 (0.98, 1.24) 1.13 (0.98, 1.24) 0.07
Candies, chocolate, chocolate bars (g)d 0 5.4 16.7 1 1.05 (0.99, 1.12) 1.07 (1.01, 1.13) 1.05 (0.99, 1.12) 0.05
Jam, honey (g)d 0 15.0 30.0 1 1.02 (0.96, 1.08) 1.03 (0.97, 1.10) 1.03 (0.97, 1.10) 0.30
Added sugar (g)d 0 5.8 13.0 1 1.09 (1.02, 1.15) 1.04 (0.98, 1.11) 1.08 (1.02, 1.15) 0.008
Cakes, biscuits (g)c 14.8 31.2 56.2 1 0.99 (0.93, 1.05) 1.02 (0.96, 1.08) 1.02 (0.95, 1.08) 0.49
Biscuits (g)d 0 3.2 10.3 1 1.07 (1.01, 1.13) 1.06 (0.99, 1.12) 1.05 (0.99, 1.11) 0.04
Cakes except biscuits (g)c 11.5 26.3 49.3 1 1.00 (0.94, 1.06) 1.01 (0.95, 1.07) 1.02 (0.96, 1.09) 0.57
Beverages
Non-alcoholic beverage (ml)c 969.3 1328.4 1780.9 1 0.96 (0.90, 1.01) 1.00 (0.94, 1.06) 0.96 (0.91, 1.03) 0.49
Hot drinks (ml)c 290.0 456.8 685.7 1 1.02 (0.96, 1.08) 1.00 (0.94, 1.06) 0.99 (0.93, 1.05) 0.32
Soda and syrups (ml)d 0 13.1 39.4 1 1.04 (0.96, 1.13) 1.09 (1.01, 1.19) 0.91 (0.84, 1.01) 0.50
Juices (ml)d 0 28.6 97.2 1 1.04 (0.98, 1.11) 1.01 (0.95, 1.08) 1.02 (0.96, 1.09) 0.49
T able 4 (Continued ) Daily consumption Cut-of fs Multi v ariable HR a(95% CI) p trend F ood items Cate gories 1st 2nd 3rd 4th Alcoholic be v erages (ethanol) (g) c 1.5 6.4 15.8 1 1.08 (1.01, 1.14) 1.08 (1.02, 1.15) 1.09 (1.02, 1.16) 0.008 W ine (ml) c 4.6 39.6 123.1 1 1.01 (0.93, 1.09) 1.08 (0.97, 1.19) 1.08 (0.96, 1.23) 0.14 Other alcoholic be v erages (ml) c 2.6 12.3 40.1 1 0.97 (0.94, 1.04) 0.98 (0.91, 1.05) 0.96 (0.89, 1.04) 0.38 Phyto-estrogens Dietary isofla v one (mcg) c 21.6 28.2 36.5 1 1.00 (0.94, 1.06) 0.98 (0.92, 1.04) 1.02 (0.96, 1.09) 0.72 Dietary enterolignanes (mcg) c 603.0 752.5 927.2 1 1.01 (0.95, 1.08) 1.00 (0.94, 1.07) 1.05 (0.98, 1.13) 0.22 Number of snackings 1 2 3 1 1.07 (0.96, 1.20) 1.11 (1.01, 1.24) 1.14 (1.03, 1.27) 0.004 aResulting from a full model, i.e. with calorie intak e, menopausal status (see T able 1 footnote), and all v ariables of T ables 1–3 entered simultaneously . b HR, hazard ratio; CI, confidence interv al. cCate gorized in quartiles with first quartile as reference. d Cate gorized in tertiles of consumers with non-consumers as reference. (HR = 1.05 (95% CI: 0.97, 1.13); HR = 0.97 (95% CI 0.94, 1.01); HR = 1.04 (95% CI: 0.99, 1.08); HR = 1.10 (95% CI: 0.99, 1.19), respectively for BMI under 18.5, 18.5–22, 25–30, and over 30, compared to BMI 22–25). After natural menopause, the underweight, overweight and obese women had a lower risk of onset of menopausal symptoms compared to those women with a BMI comprised between 22 and 25 (HR = 0.85 (95% CI: 0.72, 1.00); HR = 1.01 (95% CI: 0.94, 1.09); HR = 0.87 (95% CI: 0.79, 0.95); HR = 0.50 (95% CI: 0.41, 0.62), respectively for BMI under 18.5, 18.5–22, 25–30, and over 30).
In each stratum of the three levels of education, all associations remained stable. However, in women with the lowest level of education (less than 12 years of school), diabetes was associated with a signifi-cantly higher risk of onset of menopausal symptoms (HR = 1.40, 95% CI: 1.02, 1.93).
4. Discussion
Our study is the largest to date to investigate factors associated with the onset of symptoms of the menopausal transition. During a 10-year follow-up period, we observed that the risk of onset of menopausal symptoms was significantly lower in women with high education, long menstrual cycle length, multiparity and current use of OC. An increase in risk associated to smoking was observed, limited to current OC users. A decrease in risk was found in underweight, overweight and obese women, lim-ited to the post-menopausal period. In the opposite, a history of depression, migraine, thyroid disease or atopy was associated with a significant increase in risk. Consumption of certain food items (sour cream, sweets, biscuits, and alcohol) and snacking were posi-tively associated with the risk of onset of menopausal symptoms.
Low educational level[2,5,6,21], smoking[5,9–13], and low physical activity[2,8,13]have been previously found associated with menopausal symptoms. Asso-ciation found with education could be due to better lifestyle habits in those with higher education, result-ing in reduced onset of menopausal symptoms [5]. In our cohort, the effect of smoking was restricted to women who were current OC users. Some studies have suggested that the effect of smoking on hot flushes
116 S. Sabia et al. / Maturitas 60 (2008) 108–121
might be independent of estrogen levels, and related to androgen levels, and that smoking interferes with the thermoregulatory pathways associated with the occur-rence of hot flushes[11]. It has also been demonstrated that cigarette smoking is associated with a decrease in all plasma estrogen levels during estrogen treatment, which could explain our findings[22]. Although previ-ous studies[2,8,13]have shown a protective effect of regular physical activity, consistent with the produc-tion of hypothalamic B endorphin reported to stabilize thermoregulation, we failed to show any such relation-ship, possibly because of insufficient levels of exercise in our cohort.
Associations between BMI and menopausal symp-toms are not consistent in literature [2–7,13]. Our observation in post-menopause of a reduced risk in overweight/obese women has been described [5], as that in lean women[3]. However, others found opposite results, with higher prevalence of menopausal symp-toms in overweight[2,4,6,7,9] or in lean women[6]. We observed that the association with BMI differed according to menopausal status, which might explain discrepant in the literature. Two hypotheses have also been put forward to explain the discordant results in overweight women. After menopause, hot flushes would be less common in overweight women, who have high estrogen levels[3]due to aromatisation of androgens in the adipose tissue[13,23]. Conversely, in disagreement with our results, adiposity would inhibit heat dissipation and be responsible of an increase of climacteric symptoms[24]. In premenopausal women, plasmatic levels of estradiol are lower in both under-weight[25]and obese[26]women making the drop in hormone levels at menopause minimal. At the same time, the drop in estradiol levels has been shown to be associated with the onset and the severity of menopausal symptoms [27]which could explain our results of a decreased risk of onset of menopausal symptoms in both underweight and obese. We failed to confirm a suggested interaction between BMI and smoking[6].
Few studies reported associations between menopausal symptoms and reproductive factors
[2,6,9,10]. Among the three studies investigating the association between menopausal symptoms and parity, two failed to find any association [9,10]; in the third one [2], multiparity was positively and moderately associated with forgetfulness, heart pounding, and
urine leakage but there was no association with hot flushes or vaginal dryness. We found a modest negative association with multiparity, with a 6% reduction in the risk of onset of menopausal symptoms among women with three or more children. The decrease in risk with a history of irregular menstrual cycles that we observed in the present study is consistent with previous findings[6]. To the best of our knowl-edge, no study has reported any association between menopausal symptoms and the duration of menstrual cycles. Estradiol levels in follicular phase have been reported higher both in nulliparous women [28]and in women with shorter menstrual cycle [29]. So, our findings might be explained by a higher drop in estradiol levels in these women, increasing the risk of onset of menopausal symptoms. Regarding young age at menarche, a lower risk has been previously described[5], but also an absence of association[10], similarly to our study. Our results of a decrease in risk of onset of menopausal symptoms in current OC users are in agreement with three randomized studies of use of OC as treatment of perimenopausal climacteric symptoms [30–32]. This may be explained by the compensation of the lack of estrogens experienced in periods surrounding menopause afforded by OC. However, Ford et al.[9]found that current use of OC was associated with an increase in risk of vasomotor symptoms and problems with sexuality, and hypothe-sized that their result was due to a prescription bias. Our finding does not reflect menopausal status because that parameter was included as a time-dependent variable in the model. In the descriptive part on onset of menopausal symptoms according to menopausal status, one should keep in mind that a large majority of women in the cohort used PHT (which is prescribed when menopause is confirmed), thus decreasing the number of women experiencing their symptoms after menopause. Detailed results on the risk of onset of menopausal symptoms according to periods surrounding menopause were presented elsewhere
[18].
As we and others have found OC use to be quite strongly inversely associated with the risk of onset of menopausal symptoms, we carefully took into account this parameter in our analyses, so as to dismiss any strong confounding effect: models were systematically adjusted for OC use; moreover, all results remained basically the same in the sensitivity analysis restricted
to time periods during which women were not using OC, except results on tobacco use which was only asso-ciated with menopausal symptoms among current OC users.
In our study, women who had declared having ever suffered from migraine (whether catamenial or not, since type was not specified) were more likely to expe-rience menopausal symptoms. A relationship between menstrual migraine and the premenstrual decline in estradiol concentration has been reported earlier[33]
and may suggest common underlying mechanisms. Women who are sensitive to a decline in reproduc-tive hormones after each menstrual cycle may also be sensitive to such changes at menopause. The associ-ation observed may also be due to some treatments of migraine such as tryptans, possibly responsible for flushing and hot sensation [34]. To the best of our knowledge, there is no study on the associa-tion between menopausal symptoms and history of atopy, which could be explained by the interven-tion of vaso-active substances. The associainterven-tion found between a history of depression and a more rapid decline in ovarian function [35] could explain why women with such history experience more frequently menopausal symptoms. Moreover, a history of anx-iety and of depression have been found related to onset of vasomotor symptoms[21,36]. Alternatively, treatment of depression may be put forward as an explanation of our results, since menopausal symp-toms are modified by selective serotonin reuptake inhibitors treatments. Use of such treatments has been shown to be associated to vasomotor symptoms
[37,38], but also to their relief[39]. Our findings of an increase in risk of menopausal symptoms with a history of thyroid disease is in agreement with previ-ous findings that extreme levels (both low and high) of thyroid-stimulating hormone were associated with an increased risk of hot flushes in Norwegian women
[40]. Since the thyroid-stimulating hormone is impor-tant for regulating the metabolism of estrogens[41], an inadequate level of thyroid-stimulating hormone may interfere with the metabolism of estrogens that regu-lates menopausal symptoms. Treatment by thyroxine might also cause hypersudation, falsely interpreted as hot flushes[42].
Although use of some dietary supplements, espe-cially soy-based supplements, is often advocated to release menopausal symptoms, little is known about the
relationship between diet and menopausal symptoms. We observed that added sugar, biscuits, sour cream, and alcohol consumption were related to an increased risk of menopausal symptoms, even after additional adjustment for the number of snacking per day. Some of these food items such as sour cream and some wines have been associated with enhanced histamine release from mast cells, and with exacerbation of migraine
[43] or allergic inflammation [44]. Therefore, some role for mast cell mediators in the onset of climacteric symptoms could be suggested, the more so as a rela-tionship between estrogens and mast cell release has been described[45].
Others (biscuits, added sugar) are foods often consumed when snacking, which we found signif-icantly related to onset of menopausal symptoms through a mechanism which may be related to glucose metabolism. In an experimental study on volunteers
[46], the frequency of hot flushes was reduced in women infused with glucose to mimic the post-prandial period, while it was increased in the fasting periods, suggesting that the occurrence of hot flushes may be related to glucose availability. Women with a habit of snacking may do so because they are prone to hypo-glycemia; alternatively, snacking often includes foods with a high glycemic index, which may lead to sec-ondary hypoglycemic accesses. As the dietary data have been collected several years before the occurrence of menopausal symptoms, the snacking habit cannot be the consequence of discomfort due to menopausal symptoms. Therefore, our results suggest that an ade-quate glycemic control may help avoid hot flushes. Previous reports on a lower prevalence of menopausal complaints in Asian women have led to the hypothesis of a beneficial effect of soy consumption and, beyond, of phyto-estrogens[47,48]. However, most controlled trials, summarized in[19], failed to demonstrate a sig-nificant reduction of menopausal symptoms. Moreover, in our population, phyto-estrogen intake was low and not related to soy intake but derived essentially from lignans[49]which may explain the lack of association with menopausal symptoms in this study. Regarding the investigation of dietary factors associated with onset of menopausal symptoms, we cannot rule out some effect of low intake as compared to no intake for largely consumed foods. Indeed, we could not investigate sep-arately non-consumers when they represented less than 5%.
118 S. Sabia et al. / Maturitas 60 (2008) 108–121
4.1. Limitations
The major limitation of our study pertained to the absence of information on the type of menopausal symptoms. In our study, the term “menopausal symptoms” encompassed any symptom a woman perceived as being related to menopausal hormone changes, such as vasomotor symptoms, vaginal dryness, depressed mood, urinary symptoms, somatic symptoms, etc. In addition, women could have misreported symptoms due to aging or to chronic disease as menopausal symptoms. Our results on the association between some chronic diseases and onset of menopausal symptoms could be the results of such a misclassification, especially among women with the lower education[50]. However, results were similar in women with higher educational level who may be less likely to confound both symptoms. More generally, in our study, education was not an effect modifier, as all associations remained in analyses stratified on educational level, with only one exception: among women with low educational level, diabetes appeared to be a risk factor for onset of menopausal symptoms, a result possibly due to misclassification if women in this group interpreted hypoglycemia symptoms as hot flushes. Furthermore, one should notice that ‘hot flushes’ were given as an example at the end of the question we used to assess menopausal symptoms; we can therefore suppose that at least women who have experienced hot flushes should have reported them. Our study reports relative risks between 0.8 and 1.2 (except for current use of OC), a relatively low magnitude which may partly be the result of a dilution effect between women experiencing long and severe menopausal symptoms, and those experiencing fewer and lighter symptoms. Age at onset of menopause and menopausal symptoms were self-reported, which may have resulted in misclassification bias. However, the present study includes only women who became menopausal during follow-up, with time intervals between onset of menopause and self-reports of age at menopause not exceeding 2–3 years (corresponding to the time between two follow-up questionnaires), thus limiting recall bias. We acknowledge that some of the associations we observed might be due to multiple testing: with 50 statistical tests performed, two or three significant findings would be expected by chance based on a 0.05 nominal level of statistical significance.
Finally, the women in our cohort were recruited among employees of the public education health system or their families, and thus were not a representative sample of the general French population. A large proportion of cohort members were highly educated, resulting in small numbers of current smokers, obese women or heavy drinkers compared with nationally representative samples of the French population, thus suggesting caution when extrapolating our findings to the whole range of the various exposures, as can be found in the general population. However, if the associations found in our population reflect true bio-logic mechanisms, these mechanisms may be relevant to the general population. Moreover, in stratified analyses, observed associations remained in the lower educational group; thus, although we may have missed associations specific of underprivileged women, there is no indication that the associations observed in our cohort may not apply to the general population.
4.2. Strengths
Our study has several strengths. In general, the infor-mation given by participants proved to be of high qual-ity and a validation study showed that age at menopause was accurately reported [51]. Furthermore, the response rate after 12 years of follow-up (around 85%) indicates the high degree of interest of participants and argues for the reliable quality of the recorded data. The size of our cohort allowed us to analyse specifically women who experienced menopause during follow-up, resulting in a restriction of our population, but diminishing the potential for a recall bias without cre-ating any selection bias, and concentrcre-ating our analysis on critical periods. Most previous studies focused on the prevalence of menopausal symptoms[2,21,52,53], which reflects both their onset and their duration in an indistinguishable manner. Moreover, previous studies on menopausal symptoms either included or excluded women on PHT[12,21]. We preferred to cen-sor observations when PHT was initiated before onset of menopausal symptoms in order to provide valuable information on the natural history of menopausal symp-toms. Finally, the Cox proportional model we used, with age as time-scale, permitted to compare women of the same age, and to update variables which may have changed over time (such as smoking status, BMI, his-tory of chronic diseases or use of oral contraceptives).
5. Conclusion
Our study confirmed previously described asso-ciations between menopausal symptoms and low education, smoking, irregular menstrual cycles, depres-sion, and no use of OC, but failed to confirm an association with low level of physical activity. In addi-tion we shed new light on the relaaddi-tionship with BMI, age at menarche and parity. In the present study, underweight, overweight and obesity were associated with lower risk of onset of menopausal symptoms, although only for those occurring in post-menopause. Multiparity was associated with a lower risk and no association was found with age at menarche. Our study was the first to investigate the association between chronic diseases and the risk of onset of menopausal symptoms, and our results suggest some common mechanisms underlying certain frequent medical con-ditions such as depression, migraine, benign thyroid disease, and atopy, involving vaso-active substances. Finally, little is known on the relationship between diet and menopausal symptoms. We found no associ-ation with dietary phyto-estrogen intake, but levels of intake were low and consisted mostly in lignans. Our results suggest some influence of diet, especially of rapidly absorbed sugars and snacking. Consequently, women could be advised to limit snacking, smoking and drinking to minimize onset of menopausal symp-toms.
Acknowledgements
The authors are grateful to M. Fangon, L. Hoang and M. Niravong for their technical assistance; to the E3N group; and to J. Bram for linguistic revision of the manuscript.
Source of financial support: The French League
against Cancer, the European Community, the Mutuelle G´en´erale de l’Education Nationale medical insurance, Gustave Roussy Institute and the INSERM.
References
[1] National Institutes of Health State-of-the-Science Conference statement: management of menopause-related symptoms. Ann Intern Med 2005;142(June (12 Pt 1)):1003–13.
[2] Gold EB, Sternfeld B, Kelsey JL, et al. Relation of demographic and lifestyle factors to symptoms in a multi-racial/ethnic population of women 40–55 years of age. Am J Epidemiol 2000;152(September (5)):463–73.
[3] Erlik Y, Meldrum DR, Judd HL. Estrogen levels in postmenopausal women with hot flashes. Obstet Gynecol 1982;59(April (4)):403–7.
[4] Freeman EW, Sammel MD, Grisso JA, Battistini M, Garcia-Espagna B, Hollander L. Hot flashes in the late reproductive years: risk factors for Africa American and Caucasian women. J Womens Health Gend Based Med 2001;10(January (1)): 67–76.
[5] Li C, Samsioe G, Borgfeldt C, Lidfeldt J, Agardh CD, Nerbrand C. Menopause-related symptoms: what are the background fac-tors? A prospective population-based cohort study of Swedish women (The Women’s Health in Lund Area study). Am J Obstet Gynecol 2003;189(December (6)):1646–53.
[6] Schwingl PJ, Hulka BS, Harlow SD. Risk factors for menopausal hot flashes. Obstet Gynecol 1994;84(July (1)):29–34.
[7] Wilbur J, Miller AM, Montgomery A, Chandler P. Sociode-mographic characteristics, biological factors, and symptom reporting in midlife women. Menopause 1998;5(1):43–51. [8] Ivarsson T, Spetz AC, Hammar M. Physical exercise and
vasomotor symptoms in postmenopausal women. Maturitas 1998;29(June (2)):139–46.
[9] Ford K, Sowers M, Crutchfield M, Wilson A, Jannausch M. A longitudinal study of the predictors of prevalence and severity of symptoms commonly associated with menopause. Menopause 2005;12(May (3)):308–17.
[10] Staropoli CA, Flaws JA, Bush TL, Moulton AW. Predictors of menopausal hot flashes. J Womens Health 1998;7(November (9)):1149–55.
[11] Gallicchio L, Miller SR, Visvanathan K, et al. Cigarette smok-ing, estrogen levels, and hot flashes in midlife women. Maturitas 2006;53(January (2)):133–43.
[12] Guthrie JR, Dennerstein L, Taffe JR, Lehert P, Burger HG. Hot flushes during the menopause transition: a longitudinal study in Australian-born women. Menopause 2005;12(July (4)): 460–7.
[13] Whiteman MK, Staropoli CA, Benedict JC, Borgeest C, Flaws JA. Risk factors for hot flashes in midlife women. J Womens Health (Larchmt) 2003;12(June (5)):459–72.
[14] Kronenberg F, Fugh-Berman A. Complementary and alternative medicine for menopausal symptoms: a review of random-ized, controlled trials. Ann Intern Med 2002;137(November (10)):805–13.
[15] Riboli E, Kaaks R. The EPIC Project: rationale and study design. European Prospective Investigation into Cancer and Nutrition. Int J Epidemiol 1997;26(Suppl. 1):S6–14. [16] van Liere MJ, Lucas F, Clavel F, Slimani N, Villeminot S.
Rel-ative validity and reproducibility of a French dietary history questionnaire. Int J Epidemiol 1997;26(Suppl. 1):S128–36. [17] Lucas F, Niravong M, Villeminot S, Kaaks R, Clavel-Chapelon
F. Estimation of food portion size using photographs: valid-ity, strengths, weaknesses and recommendations. J Human Nutr Diet 1995;8:65–74.
120 S. Sabia et al. / Maturitas 60 (2008) 108–121
[18] Sabia S, Fournier A, Mesrine S, Boutron-Ruault MC, Clavel-Chapelon F. Risk of onset of menopausal symptoms in periods surrounding menopause. Maturitas 2007;58(4): 340–7.
[19] Cornwell T, Cohick W, Raskin I. Dietary phytoestro-gens and health. Phytochemistry 2004;65(April (8)): 995–1016.
[20] Kesse E, Boutron-Ruault MC, Clavel-Chapelon F. Regional dietary habits of French women born between 1925 and 1950. Eur J Nutr 2005;44(August (5)):285–92.
[21] Gold EB, Colvin A, Avis N, et al. Longitudinal analy-sis of the association between vasomotor symptoms and race/ethnicity across the menopausal transition: study of women’s health across the nation. Am J Public Health 2006;96(July (7)):1226–35.
[22] Grossman MP, Nakajima ST. Menstrual cycle bleeding pat-terns in cigarette smokers. Contraception 2006;73(June (6)): 562–5.
[23] Siiteri PK. Adipose tissue as a source of hormones. Am J Clin Nutr 1987;45(January (1 Suppl.)):277–82.
[24] Thurston RC, Sowers MR, Chang Y, et al. Adiposity and reporting of vasomotor symptoms among midlife women: the study of women’s health across the nation. Am J Epidemiol 2008;167(January (1)):78–85.
[25] Rico H, Arribas I, Casanova FJ, Duce AM, Hernandez ER, Cortes-Prieto J. Bone mass, bone metabolism, gonadal status and body mass index. Osteoporos Int 2002;13(May (5)):379–87.
[26] Freeman EW, Sammel MD, Lin H, et al. Symptoms associ-ated with menopausal transition and reproductive hormones in midlife women. Obstet Gynecol 2007;110(August (2 Pt 1)):230–40.
[27] Dennerstein L, Lehert P, Burger HG, Guthrie JR. New findings from non-linear longitudinal modelling of menopausal hor-mone changes. Hum Reprod Update 2007;13(November (6)): 551–7.
[28] Bernstein L, Pike MC, Ross RK, Judd HL, Brown JB, Henderson BE. Estrogen and sex hormone-binding globulin levels in nulliparous and parous women. J Natl Cancer Inst 1985;74(April (4)):741–5.
[29] Nagata C, Kaneda N, Kabuto M, Shimizu H. Factors associated with serum levels of estradiol and sex hormone-binding glob-ulin among premenopausal Japanese women. Environ Health Perspect 1997;105(September (9)):994–7.
[30] Casper R, Dodin S, Reid R. Study Investigators. The effect of 20g ethinyl estradiol/1 mg norethindrone acetate (MinestrinTM), a low-dose oral contraceptive, on vaginal
bleed-ing patterns, hot flashes, and quality of life in symptomatic perimenopausal women. Menopause 1997;4:139–47. [31] Porcile A, Gallardo E, Onetto P, Schachter D. Very low estrogen
desogestrel contraceptive in perimenopausal hormonal replace-ment. Maturitas 1994;18:93–103.
[32] Shargil A. Hormone replacement therapy in perimenopausal women with a triphasic contraceptive compound: a three-year prospective study. Int J Fertil 1985;30:15–28.
[33] Mannix LK, Calhoun AH. Menstrual migraine. Curr Treat Options Neurol 2004;6(November (6)):489–98.
[34] Silberstein SD. Migraine. Lancet 2004;363(January (9406)):381–91.
[35] Harlow BL, Wise LA, Otto MW, Soares CN, Cohen LS. Depres-sion and its influence on reproductive endocrine and menstrual cycle markers associated with perimenopause: the Harvard Study of Moods and Cycles. Arch Gen Psychiatry 2003;60(Jan-uary (1)):29–36.
[36] Freeman EW, Sammel MD, Lin H, Gracia CR, Kapoor S, Ferdousi T. The role of anxiety and hormonal changes in menopausal hot flashes. Menopause 2005;12(May (3)): 258–66.
[37] Mold JW, Mathew MK, Belgore S, DeHaven M. Prevalence of night sweats in primary care patients: an OKPRN and TAFP-Net collaborative study. J Fam Pract 2002;51(May (5)):452–6. [38] Shahine LK, Lathi RB. Night sweats and elevated
follicle-stimulating hormone levels while taking selective serotonin reuptake inhibitors. Obstet Gynecol 2006;108(September (3 Pt 2)):741–2.
[39] Stearns V. Serotonergic agents as an alternative to hormonal therapy for the treatment of menopausal vasomotor symptoms. Treat Endocrinol 2006;5(2):83–7.
[40] Overlie I, Moen MH, Holte A, Finset A. Androgens and estro-gens in relation to hot flushes during the menopausal transition. Maturitas 2002;41(January (1)):69–77.
[41] Vasudevan N, Ogawa S, Pfaff D. Estrogen and thyroid hormone receptor interactions: physiological flexibility by molecular specificity. Physiol Rev 2002;82(October (4)): 923–44.
[42] Schindler AE. Thyroid function and postmenopause. Gynecol Endocrinol 2003;17(February (1)):79–85.
[43] D’Andrea G, Perini F, Terrazzino S, Nordera GP. Contribu-tions of biochemistry to the pathogenesis of primary headaches. Neurol Sci 2004;25(October (Suppl. 3)):S89–92.
[44] Akdis CA, Simons FE. Histamine receptors are hot in immunopharmacology. Eur J Pharmacol 2006;533(March (1–3)):69–76.
[45] de Oliveira AP, Domingos HV, Cavriani G, et al. Cellular recruitment and cytokine generation in a rat model of allergic lung inflammation are differentially modulated by progesterone and estradiol. Am J Physiol Cell Physiol 2007;293(September (3)):C1120–8.
[46] Dormire SL, Reame NK. Menopausal hot flash frequency changes in response to experimental manipulation of blood glucose. Nurs Res 2003;52(September (5)):338–43.
[47] Nagata C, Shimizu H, Takami R, Hayashi M, Takeda N, Yasuda K. Hot flushes and other menopausal symptoms in relation to soy product intake in Japanese women. Climacteric 1999;2(March (1)):6–12.
[48] Nagata C, Takatsuka N, Kawakami N, Shimizu H. Soy product intake and hot flashes in Japanese women: results from a community-based prospective study. Am J Epidemiol 2001;153(April (8)):790–3.
[49] Touillaud MS, Thiebaut AC, Fournier A, Niravong M, Boutron-Ruault MC, Clavel-Chapelon F. Dietary lignan intake and postmenopausal breast cancer risk by estrogen and proges-terone receptor status. J Natl Cancer Inst 2007;99(March (6)): 475–86.
[50] Hunter M, O’Dea I. An evaluation of a health education inter-vention for mid-aged women: five year follow-up of effects upon knowledge, impact of menopause and health. Patient Educ Couns 1999;38(November (3)):249–55.
[51] Clavel-Chapelon F, Dormoy-Mortier N. A validation study on status and age of natural menopause reported in the E3N cohort. Maturitas 1998;29(June (2)):99–103.
[52] Obermeyer CM, Reher D, Saliba M. Symptoms, menopause status, and country differences: a comparative analysis from DAMES. Menopause 2007;14(July (4)):788–97.
[53] Woods NF, Mitchell ES. Symptoms during the peri-menopause: prevalence, severity, trajectory, and significance in women’s lives. Am J Med 2005;118(December (Suppl. 12B)): 14–24.