HAL Id: hal-02063213
https://hal.archives-ouvertes.fr/hal-02063213
Submitted on 22 Mar 2019
HAL is a multi-disciplinary open access archive for the deposit and dissemination of sci-entific research documents, whether they are pub-lished or not. The documents may come from teaching and research institutions in France or abroad, or from public or private research centers.
L’archive ouverte pluridisciplinaire HAL, est destinée au dépôt et à la diffusion de documents scientifiques de niveau recherche, publiés ou non, émanant des établissements d’enseignement et de recherche français ou étrangers, des laboratoires publics ou privés.
Aerolysin, a Powerful Protein Sensor for Fundamental
Studies and Development of Upcoming Applications
Benjamin Cressiot, Hadjer Ouldali, Manuela Pastoriza-Gallego, Laurent
Bacri, F. Gisou van der Goot, Juan Pelta
To cite this version:
Benjamin Cressiot, Hadjer Ouldali, Manuela Pastoriza-Gallego, Laurent Bacri, F. Gisou van der Goot, et al.. Aerolysin, a Powerful Protein Sensor for Fundamental Studies and Development of Upcoming Applications. ACS Sensors, American Chemical Society, 2019, 4 (3), pp.530-548. �10.1021/acssen-sors.8b01636�. �hal-02063213�
Aerolysin, a powerful protein sensor for fundamental studies and
development of upcoming applications
Benjamin Cressiot§, Hadjer Ouldaliµ, Manuela Pastoriza-Gallegoµ, Laurent Bacri§, F. Gisou Van der Goot¤, Juan Pelta*§
§
LAMBE, Université Evry, Université de Cergy-Pontoise, CNRS, CEA, Université Paris-Saclay, 91025, Evry, France
µ
LAMBE, Université Cergy-Pontoise, Université d’Evry, CNRS, CEA, Université Paris-Seine, 95000, Cergy, France
¤
Laboratory of Cell and Membrane Biology, EPFL, CH-1015 Lausanne, Suisse
ABSTRACT
Nanopore electrical approach is a breakthrough in single molecular level detection of particles as small as ions, and complex as biomolecules. This technique can be used for molecule analysis, and characterization as well as for the understanding of confined medium dynamics in chemical or biological reactions. Altogether, the information obtained from these kinds of experiments will allow to address challenges in a variety of biological fields. The sensing, design and manufacture of nanopores is crucial to obtain these objectives. For some time now, aerolysin, a pore forming toxin, and its mutants have shown high potential in real time analytical chemistry, size discrimination of neutral polymers, oligosaccharides, oligonucleotides and peptides at monomeric resolution, sequence identification, chemical modification on DNA, potential biomarkers detection and protein folding analysis. This review focuses, on the results obtained with aerolysin nanopores on the fields of chemistry, biology, physics and biotechnology. We discuss and compare as well the results obtained with other protein channel sensors.
Key words: Aerolysin, nanopore, single molecule, electrical sensor, protein unfolding, size and sequence discrimination, confined medium dynamics
For the past two decades, the number of papers and the citations in the field of nanopores has increased exponentially. Nanopore technology has become a sensitive, selective, low cost, label-free, real-time and transportable tool for sensing a wide variety of molecules, including ions, polymers, polyelectrolytes, viruses, ligand-molecule complexes and biomolecules. It allows for the analysis of transport properties, conformations, folding, size, sequence or chemical modifications1-6. At first, the protein channels were the main sensors used to perform numerous studies7-9. Thanks to material science, chemistry, nanoscience and molecular biology, it is now possible to design and manufacture new classes of nanopores: solid-state sensors10,11, DNA origami nanopores12,13, carbon14,15 or cyclodextrin nanotubes16-18, hybrid nanopores19-21 and glass
22,23
or quartz nanopores24 with DNA aptamers25. The increased interest in nanopore research has been mainly associated to the ultra-fast DNA sequencing challenge, recently achieved by Oxford Nanopore Technology26-29. The objectives at the horizon of this field comprise of proteomic sequencing6,30-33, biomarker detection (of micro-RNAs34 as well as infinitesimal peptides and proteins quantities) and single-molecule mass spectrometry32,35-42. Up to now, the best sensitivity for biotechnological or heath applications is obtained through biological channels.
A member of the pore-forming toxin (PFTs)43 family, aerolysin is a beta structure toxin that has recently been at the center of extensive fundamental studies and some biotechnology applications32,38,39,44-48. In this review we first introduce the molecular mechanism of channel formation, from soluble inactive monomers to a functional pore into a lipid membrane (figure 1); we delve into the structure of monomeric and heptameric aerolysin along with, the mechanism promoting transition between the pre-pore and the fully functional pore according to the latest findings in X-ray crystallography, cryo-EM, molecular dynamics and computational modeling (figure 1). The ability to obtain single molecule resolution information from electrical signals, depends on efficient data analysis and amplifier quality. We present the principle of electrical molecule detection, the set-up, the acquisition and filter effects, the background for data analysis from current traces to obtain statistical distributions of events along with their duration, frequency and current amplitude (figure 2). One of the challenges of nanopore single molecule sensing is dynamics control, entry and interactions between the molecules and the pore. We focus on the two main driving forces that control neutral to charged macromolecules: electro-osmosis
and electrophoresis. These forces depend on aerolysin selectivity, applied voltage, temperature, pH, salt concentration and salt make-up (figure 3, 4). We also look at aerolysin’s powerful sensor competence noted by its ability to detect different protein conformations, stability and unfolding transitions (figure 5). Furthermore, we show how aerolysin allows for size discrimination with a monomeric resolution or sequence determination of oligosaccharides, polymers (figure 6), oligonucleotides (figure 7) and peptides (figure 8). We discuss the best discrimination resolution obtained with aerolysin. We conclude this review with a brief discussion of the major results obtained with aerolysin in comparison with other protein sensors and the potentials for upcoming applications.
I. Aerolysin channel and electrical detection
Figure 1: PFT pore formation pathway and structure of aerolysin. A. Schematic representation of the pore
formation pathway of PFTs. Soluble PFTs are recruited to the host membrane by protein receptors and/or specific interactions with lipids. Upon membrane binding, the toxins concentrate and start the oligomerization process, which usually follows one of two pathways. In the pathway followed by most β-PFTs, oligomerization occurs at the membrane surface, producing an intermediate structure known as a pore (mechanism for aerolysin). The pre-pore eventually undergoes conformational rearrangements that lead to concerted membrane insertion. The final result is the formation of a transmembrane pore with different architecture, stoichiometry, size and conduction features. It promotes the influx or efflux of ions, small molecules and proteins through the host membrane, and trigger various secondary responses involved in the repair of the host membrane (Reprinted with permission from
reference43, Copyright 2015 Springer Nature). B. Ribbon presentation of the aerolysin pore. Left, top view of
inserted pore. Collar surface in the cap domain is 16 nm large. Inner pore diameter is 1.8 nm. Middle, side view of the pore inserted into a lipid bilayer, pore length is 10 nm. An extramembrane cap domain with the collar and a
transmembrane domain (stem) are represented (Reprinted with permission from reference44, Copyright 2017 Royal
Society). Right, amino acid charge distribution: positive residues are in blue and negative residues are in red. Representative amino acids of the β- barrel and the internal pore surface are indicated. (Reprinted with permission
from reference45, Copyright 2018 Royal Society). C. Conformational changes between aerolysin domains that
contribute to the pre-pore to pore transition. At the left, structure of monomeric pro-aerolysin (PDB: 1PRE). Structural domains are color coded as follows: domain 1 in grey, domain 2 in orange, domain 3 in green and domain 4 in yellow. The C-terminal pro-peptide is shown in blue and the pre-stem domain, enlarged in the inset, is shown in tan. In the middle, ribbon representation of aerolysin monomer as observed of the model of the prepore and the membrane-inserted (solid) state. During transition, domains 3 and 4 rotate and flatten to a position almost parallel to the membrane plane. During transition, the pre-pore stem loop is extracted and flips around to form the transmembrane β-barrel. At the left, ribbon and space-filling (for two representative monomers) representation of the prepore and the membrane-inserted state, illustrating overall swirling movement undergone by the complex
(Reprinted with permission from reference 46, Copyright 2013 Springer Nature).
Biological nanopores are a large family of proteins and peptides that are implicated in many biological processes. Some of these nanopores have been intensively used in studies where the nanopore molecule inserted in a lipid bilayer is coupled to an electrical detection system allowing single molecule characterization3,8. Aerolysin is one of the most promising nanopores for biotechnology applications45. This protein is a β-barrel pore forming toxin (β-PFT) that is implicated in pathogenic infections by Aeromonas47. Bacteria produce this protein as a precursor protein, pro-aerolysin, which forms soluble dimers48. At membrane proximity, a proteolytic cleavage of the pro-peptide sequence allows oligomerization of the aerolysin to form a heptameric pore49,50. Monomers first assemble into a heptameric pre-pore structure. This complex docks onto the membrane surface, with the pre-stem loops ready to slide through a pocket into the interior cavity of the pre-pore. Triggering the transition from pre-pore to pore, the pre-stem loops eventually refold into amphipathic β-hairpins forming the transmembrane β-barrel. This conformational change is accompanied by a concerted swirling mechanism that flattens the extracellular portion of the pore as the β-barrel forms and inserts into the membrane43 (Figure 1A). Aerolysin heptamers show a mushroom-like structure with a β-barrel stem inserted in the
lipid membrane (Figure 1B middle). Extracellular structure has not a real vestibule as ⍺-hemolysin but there is a cap with a collar structure that is 16 nm large. The internal pore diameter is 1.8 nm (Figure 1B, left and middle). One of the most important characteristics of an aerolysin pore for electrical coupled detection of single macromolecules is charge distribution (Figure 1B, right). Surprisingly, the β-barrel is composed of an alternation of positive and negative amino acids (lysine and glutamic acid) Site-directed mutagenesis experiments have been developed to change selectivity and sensitivity of aerolysin nanopore and contribute to potential biotechnological application of this pore protein45.
Obtaining the tri-dimensional structure of an aerolysin nanopore has been far from an inconsequential task. The crux of the problem lies in the original insertion mechanism of this protein pore. Indeed, protein domain organization changes drastically between pro-aerolysin soluble dimers and the heptameric nanopore conformation (Figure 1C). Intermediates between both states have also been identified by combining classical X-ray crystallography, cryo-EM, molecular dynamics and computational modelling46.
The applications of aerolysin as a channel forming protein that can oligomerize to form a heptameric structure into lipid bilayers are developed since 1990s51-53. This toxin is synthetized as an inactive precursor, pro-aerolysin 52 kDa, that stabilize as dimers54 (PDB code: 1PRE, Figure 1C left). Activation is initiated by C-terminal cleavage of the pro-peptide sequence (25 amino acids) followed by oligomerization of the toxin protein50. The first low resolution (25 Å) structural studies of membrane inserted aerolysin where obtained by Parker and colleagues48. After these studies, development of a mutant version of aerolysin55 allowed to further understand the heptameric structure of the channel. This mutant assembled into a hydrophilic oligomer with a mushroom-shaped structure akin to its wild type counterpart. The combination of X-ray crystallography, cryo-EM, molecular dynamics and computational modelling was necessary to achieve the structure of the membrane inserted nanopore46 (PDB: 5JZT). In this study, several transition structures were identified due to a reorganization of the pre-stem loop between domains 3 and 4 after proteolytic cleavage of the pro-peptide sequence at the lipid membrane proximity that finally contributes to create a transmembrane β-barrel (Figure 1C middle and right). Some of these intermediate structures have also been deposited in the Protein Data Bank as pre-pore (PDB: 5JZH), post-pore and quasi-pore (PDB: 5JZW) structures.
Understanding pore insertion mechanism has been essential for other pore forming toxins of the aerolysin family such as lysenin or epsilon-toxin56. Other aerolysin-like, membrane pore-forming proteins whose soluble structure where well understood have been only recently described and show similar assembly mechanisms to the above described57.
Furthermore, aerolysin has been shown to be resistant to high concentration of denaturing agent (up to 1.6 M guanidium)58, ample pH (from pH 2.1 to pH 10)39,59 and high temperatures (up to 70°C)60,61, making this a durable pore with high potential for biotechnological applications.
2. Principle of molecule detection by electrical measurement and data analysis
Figure 2: Principle of Oligosaccharide detection by electrical measurement and data analysis a) Bottom: electrical circuit model of an aerolysin channel inserted into a lipid membrane. Gp and Cm are the channel conductance and the membrane capacitor, respectively. Gcis and Gtrans refer to access conductance on the cis and trans side, respectively
40,41
. b) Trace of the ionic current through the channel with a 1 mM deca-saccharide solution of hyaluronic acid in a 1M KCl, 5mM HEPES pH 7.5, under a 70mV voltage. I0 and ΔIb correspond to the open pore and the blockade current, respectively. The dwell time Tt is defined as the duration of a current blockade. The inter-event time Ti is the duration between two successive blockades. The red dotted line corresponds to the detection threshold. c) Distribution of the inter-event time Ti blockades. The distribution is fitted with an
exponential function exp(−f∙Ti) where f = 204 ± 3 blockades/s. d) Logarithmic distribution of the dwell times, fitted with two log normal functions exp(−[ln(t/Tt)/σ0]2) where Tt amplitude is 86 ± 11 µs (black dotted line) and 142 ± 13 µs (green dotted line). e) Scatter plot of the blockade currents Ib as a function of the corresponding dwell time Tt of each blockade. f) Linear distribution of the dwell times, fitted with two exponential functions exp(−t/Tc) where Tc amplitude is 107 ± 6 µs (black dotted line) and 200 ± 10 µs (green dotted line). g) Histogram of the blockade currents ΔIb. The distribution is fitted with a Gaussian function exp(-(ΔIb -ΔIb0)2/w2) where ΔIb0 = 25 ± 5 pA.
First, we consider one electrolyte (usually 1M KCl) filled compartment, which is divided in two sub-compartments (cis and trans) by a lipid bilayer2,62-65. This membrane behaves as an insulating wall, in which a single aerolysin channel is inserted. This insertion is followed by measurement of the ionic current through the protein channel in the presence of an electrical potential ΔU between the ground (cis compartment) and the reference electrode (trans compartment) (Figure 2a). The insertion is characterized by a current increase until the open pore current value is reached (I0 = 39 ± 4 pA for ΔU = 70 mV, Figure 2b). The channel conductance
Gp is defined as the ratio between the ionic current I0 and the applied voltage ΔU: Gp = I0/ΔU =
0.56 ± 0.05 nS. In a first approximation, we assume the aerolysin behaves as a conducting cylinder of radius R and length ℓ:
Gp = Κb π R2/ℓ (1)
where Κb is the bulk conductivity of the electrolyte11. In 1M KCl, Gp = 1.9 nS. This value is
overestimated because we neglect the ion confinement in the aerolysin channel17,66. This relation is true in high ion concentration, when the conductance is mainly due to the ionic flow through the channel. On the other hand, if the concentration is too low, the thickness of the counter ion layer at the inner surface of the channel is larger than the channel radius11,67,68. This thickness is controlled by the screening Debye length λD. 69
Here, the lipid bilayer behaves as an insulating membrane and is characterized by its capacitance
Cm, which is in parallel with the pore conductance Gp and can be approximated by the following
equation:
Cm = ε0εrm Am/ℓm (2)
where εrm = 2 is the dielectric constant of the membrane capacitance, Am the area and ℓm the
larger than 65 ± 5 pF leading to an estimated membrane thickness70 of about 4.85 ± 0.4 nm. This thickness is low enough to allow easier channel insertion.
Now, we consider the access conductance Gcis and Gtrans, which correspond to the conductance
between each electrode and the corresponding entrance of the channel. They are evaluated by the formula71:
Gcis = Gtrans = 8R Κb (3)
Then, we can define the overall access conductance Gacc = Gcis Gtrans / (Gcis + Gtrans) :
Gacc = 4R Κb (4)
In 1M KCl, this formula leads to a Gacc valueof 36 nS. This expression is applicable to neutral
channels. Numeric computations have shown that Eq. 3 underestimates the access conductance of charged channels72. The model of electric circuit shown in figure 2a leads to the equation:
𝐺(𝑠) = 𝐺𝑎𝑐𝑐 (𝐺𝑚+𝐺𝑝)
(𝐺𝑚+𝐺𝑝)+ 𝐺𝑎𝑐𝑐 (5)
where the Gm = s Cm is the complex conductance due to the membrane capacitance in the Laplace
space73.
After addition of deca-saccharide chains of hyaluronic acid, we observe current blockades70,74 (Figure 2b). Given that there is no correlation between each blockade, the statistical distribution of the duration between two following blockades Ti follows a Poisson’s law, defined by an
exponential decay ≈ exp (- f Ti) (Figure 2c), where f is the characteristic frequency. This
frequency is controlled by the confinement energy of the chain into the channel2,58,75-77. If the chain is charged, this energy could be lowered by the addition of electrostatic energy58,78. When the chain enters the nanopore, we measure a current blockade characterized by its duration or dwell time Tt and its amplitude ΔIb (plotted in the scatter plot in figure 2e). These experimental
values could be strongly modified both by the current amplifier, which measures the ionic current, and the acquisition card used for data processing.
The low-pass filter integrated in the amplifier could smooth a blockade, if its duration is shorter than the double of the rise time Tr of the filter defined by: 79
Tr = 0.33/fc (6)
Assuming fc = 10 kHz, blockades must be shorter than 2Tr ≈ 66 µs to avoid deformation but some
algorithms have been developed to overcome this limitation73,79. Considering Shannon’s theorem, the sampling time Ts of the acquisition must be two times smaller than the characteristic
measured time. From Eq. 6, we could choose TS = 33 µs. Experimentally we observe that it is
better if TS is 15-20 times smaller than the characteristic time, which leads to TS = 3-4 µs. The
data of figure 2 are acquired with a 4 µs sampling time and a 10 kHz cutoff frequency.
The dwell time histogram can be drawn according to a logarithmic (figure 2d) or linear distribution80,81 (figure 2f). In the first plot, the data can be fitted by a log normal function defined in the caption of the figure 2, leading to the estimation of the dwell time Tt. In the second one, an
exponential function can be used to determine the characteristic dwell time Tc (figure 2 d, f). The
major part of blockades is characterized by a short dwell time (Tt = 86 ± 11 µs in figure 2d, Tc =
107 ± 6 µs in figure 2f) where the deca-saccharide chains should interact with one binding site of the aerolysin32,58,70. We could observe that some blockades are two times longer (Tt = 142 ± 13 µs
in figure 2d and Tc = 200 ± 10 µs in figure 2f) and could be due to interactions with a second
binding site.
The blockade current histogram is characterized by one peak, which is fitted by a Gaussian function (figure 2g). Because the blockades’ amplitude being a function of the chain length, this distribution shows that the deca-saccharide chain is monodisperse32,38,67,82,83.
II. From the conformation to the monomer sensing
Figure 3: Transport dynamics of neutral polymers and polyelectrolytes. (A) Effect of salt nature and voltage on non-ionic polymer interactions with aerolysin. (a) Current–voltage (I–V) curves through an aerolysin pore in 3 M KCl with PEG 1500 added to the cis-side of the membrane. Cartoons on top of each curve illustrate the direction of the cation flow and of EOF according to voltage polarity. (b) Dynamic properties of the aerolysin/PEG 1500 interaction as a function of voltage and salt nature. (Top, blue) Blockade duration and frequency as a function of negative voltage in 3 M KCl. Dashed lines are exponential fits. (Down, red) Blockade duration and frequency as a function of positive voltage in 3 M LiCl. Dashed lines are linear fits. (Reprinted with permission from reference67 Copyright 2016, Royal Society of Chemistry) (B) Effect of applied voltage on polyelectrolyte transport. (c) The frequency of blockade events as a function of the applied voltage when dextran sulfate enters by the cis side of the channel, semi-log scale. (d) The current pore blockade duration as a function of applied voltage for long
blockades. (Reprinted with permission from reference84, Copyright 2018 Springer Berlin Heidelberg) (C) Effect of pH on
oligonucleotide transport. (e) Trans pH-dependent capture of cis DNA by an aerolysin pore, mechanistic study and current traces
showing the consistent increase of blockade frequency for the cis DNA D16 (1 μM) as the trans pH was lowered from 7.4 to 2.6 (cis pH remained 7.4). (Reprinted with permission from reference59 Copyright 2017, American Chemical Society) (D) Effect of temperature on oligonucleotide transport. (f) Translocation time per nucleotide versus temperature for an aerolysin pore (open circles) measured at a voltage of 100 mV. (g) Sketch of the free energy landscape for single file translocation of a chain containing N monomers through a pore of M monomer lengths. The translocation coordinate, m, denotes the number of monomers depleted from cis until it reaches the value N (with either m monomers inside the pore and N - m monomers in cis or with M monomers inside the pore, N - m monomers in cis and m - M monomers in trans). For m > N, the pore is partially filled,
A) E ect of salt nature and voltage on non ionic polymers interactions with aerolysin
B) E ect of applied voltage on polyelectrolytes transport
C) E ect of pH on oligonucleotides transport D) E ect of temperature on oligonucleotides
transport a) b) c) d) e) f) g)
with the rest of the chain solely in trans. Steps 1 and 2 constitute the nucleation barrier controlling the translocation frequency. Steps 3–5 contribute to the translocation time. The barrier for the translocation time is attributed to the depletion of M monomers from the pore. (Reprinted with permission from reference60 Copyright 2015 Biophysical Society).
a) Effect of salt nature and voltage
It is crucial to understand and better control the dynamics of different nature macromolecules through a biological pore for applications such as single-molecule sequencing or single-molecule size discrimination. In fact, two forces can act on the direction of the analytes: (1) the electrophoretic force (EF) acting on charged molecules and (2) the electro-osmotic flow (EOF) which is the fluid transport associated to ions through the pore depending on the channel ion selectivity. Each force will contribute to the direction and magnitude of molecule transport. In order to understand the contribution of each force, Boukhet et al described the interactions of neutral polymers (cyclodextrins and PEGs) as a function of two different highly concentrated electrolytes with different ionic hydration (3M KCl and 3M LiCl) and as a function of applied voltage67 (Figure 3A). In KCl, current blockades were observed only for negative voltages, following the direction of cation flow. In contrast, in LiCl, current blockades were observed only for positive voltages, following the direction of anion flow. EOF was shown to be the main driving force due to the flow of anions through the aerolysin pore. This phenomenon was stronger in LiCl than KCl. In contrast with LiCl, blockade duration and frequency increased exponentially as a function of applied voltage (Figure 3A). In the presence of KCl, EF was shown to be the main driving force, PEGs appearing to behave as positively charged polyelectrolytes. This behavior was previously observed with an ⍺-hemolysin channel85
. A recent study reported that the replacement of traditional electrolyte KCl by LiCl effectively shields the negative charge of aerolysin nanopore orifice and allows the detection of single-stranded DNA as long as 102 bases without the need of an enzyme. The capture rate of analyte improved from 3.89 to 9.07 times compared to KCl electrolyte86.
Dynamics of polyelectrolytes (Dextran Sulfate) through aerolysin have also been investigated84 as a function of the applied voltage (Figure 3B). Pastoriza et al found that frequency of events increased exponentially in response to the applied voltage. The evolution of the frequency showed the existence of an activation energy barrier. The entry of dextran sulfate into the pore follows the Van't Hoff-Arrhenius relationship, f = f0 e(V/V0), where f0 = p e(U*/kbT) is
(defined by the Fick’s law p = cDA/ℓ, where c is the bulk concentration of the protein, D is its translational diffusion coefficient, A is the cross-sectional area of the channel, and ℓ is the pore length), U* is the activation free energy, kB is the Boltzmann constant, T is the temperature, and
V0 = kBT/ze, where z is defined as the effective charge of the dextran sulfate on which the electric
field acts at the pore entrance and e is the elementary charge of an electron75,76. The energy barrier for the entry of molecules into the nanopore was found to be around 13.5 kBT. The
interaction times were decreasing exponentially and were independent of polyelectrolyte concentration. The authors showed that the effective charge is reduced at the pore entrance and even more inside the channel due to the confinement of the charges in a medium of low dielectric constant, inside the aerolysin channel. The same dependencies for single strand DNA were observed as a function of applied voltage with an energy barrier of 10 kBT.60
Boukhet et al explored the backbone structure of poly(phosphodiester)s87. They found a precision poly(phosphodiester)s structure and orientation influence on the observed residual current signal and translocation dynamics. It suggests a dominant entropic contribution due to the high flexibility of the phosphodiester homopolymer inside the aerolysin.
b) Effect of pH
pH can be an effective way to control the transport of polymers through aerolysin. Wang et al explored this hypothesis by drastically modulating the pH on one side of the pore59. In fact, at physiological pH, the authors showed that small 16 oligonucleotides cannot be detected. By varying the pH on only one side from pH 7.4 to pH 3.4, they were able to detect oligonucleotides (Figure 3C) as small as 5 nucleotides. This mechanism is attributed to the protonation of the inner barrel of aerolysin, which produces a cis to trans Cl- flow at positive voltage. This EOF allows DNA to be transported through the pore. They found that the speed of translocation of the oligonucleotides is reduced with an increase of the temporal resolution of DNA/RNA of different lengths.
The effect of temperature on oligonucleotides transport through aerolysin has been explored by Payet et al, especially its influence on the entrance and transport energy barrier60. The authors describe an Arrhenius type temperature dependence for the frequency of events. In fact, frequency of events of 50 nucleotides single-strand DNA through aerolysin increases exponentially with temperature. At low voltage, the frequency is reaction-limited by an energy barrier of entry, and at high voltage, the frequency is diffusion-limited. They were able to extract an enthalpic barrier contribution of 15 kBT for the entrance of the oligonucleotide into the pore.
Time of transport was shown to decrease exponentially as a function of temperature (Figure 3f). Furthermore, the authors were able to describe the free energy profile (Figure 3g) for the translocation of the oligonucleotides using a Fokker-Plank formalism. They found an unexpected large free-energy barrier for the threading stage (around 35 kBT) that can be attributed to the
amplification of local pore-polymer attraction by the pore length. This result was not expected because the rate limiting step of polymer translocation was assumed to be a capture process.
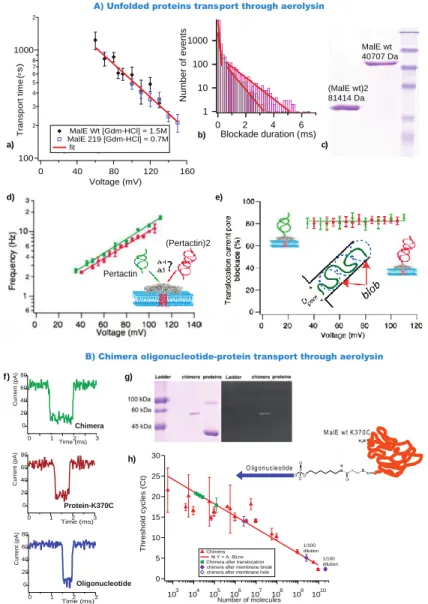
Figure 4: Transport dynamics of unfolded proteins. (A) Unfolded protein transport through aerolysin. (a) Transport times as a function of applied voltage for MalEwt and MalE219. (b) Histogram of blockade duration for MalEwt and MalEwt-MalEwt. (c) SDS-PAGE of MalEwt and MalEwt-MalEwt. (Reprinted with permission from reference58 Copyright 2011 American Chemical Society) (d) Frequency of events as function of applied voltage for pertactin and a pertactin dimer. (e) Current pore blockade as a function of applied voltage for pertactin and a pertactin dimer with a schematic representation of the blob model. (Reprinted with permission from reference88 Copyright 2015 American Chemical Society) (B) Chimera oligonucleotide-protein transport through aerolysin. (f) Example of current traces for chimera protein (green), proteins-K370C (red) and oligonucleotide (blue). (g) SDS-PAGE analysis after chimera purification. Left, Coomassie bleu coloration. Right, ethidium bromide signal under UV light. Lane 1, molecular weight marker, ladder; lane 2, chimera, lane 3, MalE K370C (a small amount of dimeric MalE is visible because of oxidation) (h) Detection of chimera molecules using qRT-PCR. (Reprinted with permission from reference89 Copyright 2015 American Chemical Society).
2011 witnessed the first study on unfolded protein dynamics through aerolysin58, by varying the applied voltage, protein concentration and protein chain length. Pastoriza et al used three different Maltose Binding Proteins (MalEwt, a destabilized mutant MalE219 and a double MalEwt-MalEwt) and guanidium as a chaotropic agent to unfold the proteins. They found that the frequency of events increased exponentially as a function of applied voltage. The energy barrier
c)[Protein] = 0.35 M 100 2 3 4 5 6 7 8 1000 2 T ra n s p o rt t im e ( µ s ) 160 120 80 40 0 Voltage (mV) MalE Wt [Gdm-HCl] = 1.5M MalE 219 [Gdm-HCl] = 0.7M fit 1 10 100 1000 N u m b e r o f e v e n ts 6 4 2 0 Blockade duration (ms) (MalE wt)2 81414 Da MalE wt 40707 Da A) Unfolded proteins transport through aerolysin
1/100 dilution 1/100 dilution 30 25 20 15 10 5 0 T h re s h o ld c y c le s ( C t) 103 104 105 106 107 108 109 1010 Number of molecules Chimera fit Y = A -BLnx Chimera after translocation chimera after membrane break chimera after membrane hole
H N O O OO P H2N M alE w t K 370C O ligonucleotide
B) Chimera oligonucleotide-protein transport through aerolysin Pertactin (Pertactin)2 Oligonucleotide Protein-K370C Chimera 80 60 40 20 0 C u rr e n t (p A ) 3 2 1 0 Time (ms) 80 60 40 20 0 C u rr e n t (p A ) 3 2 1 0 Time (ms) 2 1 0 Time (ms) 3 80 60 40 20 0 C u rr e n t (p A ) a) b) c) d) e) f) g) h)
found to entrance of proteins into the aerolysin was 4 kBT. The activation free energy U*
obtained is explained by the confinement of the chain inside the aerolysin; the frequency of events increased linearly as a function of the protein concentration; as for transport time, it decreased exponentially as a function of the applied voltage. Comparison between MalEwt and MalEwt-MalEwt transport times (Figure 4b) indirectly confirmed that the unfolded proteins are transported through the aerolysin channel. In fact, time of transport of MalEwt-MalEwt is two times longer than MalEwt.
In order to confirm that the dynamic of transport is protein independent and to define the physical parameters governing transport of an unfolded protein, Cressiot et al described the transport of an autotransporter virulence protein, pertactin, through aerolysin88. They were able to compare the dynamics of entry and transport for unfolded pertactin in addition to a covalent end-to-end dimer of the same protein. The dynamics observed were similar to those previously described by Pastoriza et al (Figure 4d). Moreover, they experimentally determined, the enthalpic and entropic contribution for the entry of an unfolded protein inside a narrow protein nanopore. The activation barrier for the entry of unfolded pertactin into aerolysin is mainly controlled by enthalpy rather than entropy. The publication also demonstrated that at low electrical driving force and, according to the current blockade at different voltages, that these unfolded proteins translocated through the aerolysin nanopore in a non-extended conformation (Figure 4e). This was in agreement with the Daoud and de Gennes “blob” model90.
Proof of protein translocation remained challenging because, unlike DNA, it is impossible to perform a PCR to detect a few copies of proteins. With this in mind, Pastoriza et al designed a chimera molecule consisting of a recombinant MalE protein with a unique cysteine residue at the C-terminal position covalently linked to a single-stranded DNA oligonucleotide (Figure 4g). This chimera molecule allowed for amplification and detection by quantitative reverse transcription PCR (qRT-PCR)89. To prevent entry at the oligonucleotide extremity, the applied voltage was low. Through this method, detection of the chimera in the trans chamber was achieved, supporting translocation from the cis chamber. Comparing the electrical signature of the chimera related to the protein or oligonucleotide alone demonstrated that each type of molecule displays different dynamics in terms of transport time, event frequency, and current blockade (Figure 4f).
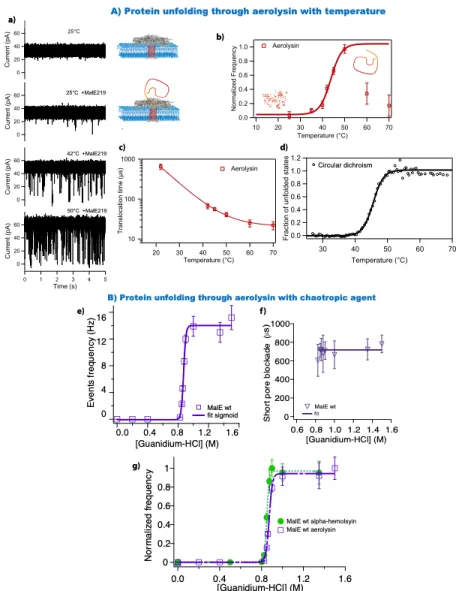
Figure 5: Protein unfolding through aerolysin. (A) Thermal transition at single molecule bulk level. (a) Part of current traces as a function of temperature. (b) Unfolding curve through aerolysin. (c) Dwell time as a function of temperature. (d) Unfolding curve with circular dichroism method. (Reprinted with permission from reference61 Copyright 2012 American Chemical Society)
(B) Comparison of unfolding transition with two different protein channels. (e) Denaturation curve with aerolysin. (f) Pore blockade as a function of guanidium concentration. (g) Unfolding curves with aerolysin and ⍺-hemolysin. (Reprinted with permission from reference91 Copyright 2012 American Chemical Society)
Despite decades of multidisciplinary research on folding processes, during which an amino acid chain structures itself to become a functional protein, remains a challenge that has been able to be addressed with modern technics. In fact, many human diseases are related to partial unfolding or alternative folding92,93. These diseases result in reduced life expectancy and quality of life. In this context, the nanopore electrical detection could be a new instrumental and understanding the folding process. The ability to use a protein channel to probe protein
denaturation in the presence of a chaotropic agent was first shown in 2007 with ⍺-hemolysin94. An unfolding curve was extrapolated from current blockades frequencies (unfolded protein) and denaturant (guanidium) concentrations. The duration of the blockades depends on the conformation of the protein, unfolded or partially folded. In order to validate this novel method to study protein unfolding, prove of unfolding transition regardless the nanopore used was necessary. It was also crucial to compare single nanopore experiments to bulk experiments.
Aerolysin was chosen because the net charge and the geometry of the channel are different in comparison to ⍺-hemolysin nanopore. In the first example, we follow the protein stability, MalE219, a destabilized variant, as a function of temperature (figure 4A)61. Without protein, the current of the empty pore is stable at 25°C. After addition of proteins, we observe a few short spikes due to bumping events. An increase in temperature leads to an increase in number of spikes and their current amplitude (42°C). At higher temperature, we see the same behavior. In order to probe if these deep spikes are due to unfolded molecules, the normalized frequency of events is plotted against temperature. A sigmoidal relationship is found up to 50°C followed by a plateau and a surprising decrease in events. This sigmoidal behavior is attributed to an unfolding process because unfolded proteins can enter aerolysin. The duration of events decreases with temperature down to a plateau starting at about 60°C. This indicates all the events for unfolded protein at these temperatures cannot be observed due to their characteristic duration being too short to be resolved by the amplifier. In order to compare those results, a study was performed in bulk using circular dichroism with MalE219. A thermal sigmoidal unfolding curve with a long plateau is obtained up to 70°C (figure 4b). This curve confirms the resolution limit of the amplifier. Moreover, the transition temperatures are comparable between the bulk experiment (45.5 ± 0.5°C) and the single molecule approach (44 ± 1°C). In fact, the same unfolding transition is found with ⍺-hemolysin; the melting transition does not depend on the nanopore used. Another approach was to probe chemical denaturation of MalEwt, as a function of guanidium concentration at constant voltage (Figure 4B). Extracted from the current traces (data not shown), the mean duration of short blockades is independent of the denaturant concentration used, <tduration> = 717 ± 39 µs. In other words, these events are due to unfolded proteins at the
aerolysin channel entrance. The authors obtained a sigmoidal evolution of the frequency of events as a function of denaturing agent, up to a plateau value. The normalized frequency shows the same denaturation curve with an aerolysin or an ⍺-hemolysin nanopore (Chalf-aerolysin = 0.87 ±
0.01 M and Chalf-hemolysin = 0.85 ± 0.01 M.). For the long spike duration, a glassy behavior is found
for aerolysin91 and for ⍺-hemolysin nanopore94. These results demonstrated that the channel geometry and the net charge do not affect the unfolding transition or the first-order transition. On the other hand, it was observed that the event frequency and the dynamics of unfolded protein transport depend on the nanopore used58,91,94.
4. Polymer size discrimination
Figure 6: Polymer size discrimination with single Aerolysin channel. A) Size discrimination of oligosaccharides. (a) Transport of hexa-(red), octa-(blue) or deca-saccharide (green) of hyaluronic acid. (b) Inter-event time distribution in presence of hexa-,
1 10 100 1000 N b 0.6 0.4 0.2 0 Inter-Event Time (s) 1 0.5 0 N o rm al iz ed N b 50 40 30 20 10 0 Current (pA) 100 101 102 103 104 N b 2 1.5 1 0.5 Dwell Time (ms) Hexa Octa Deca 1 0.5 0 N o rm al iz ed N b 10 µs 2 4 6 8 100 µs 2 4 6 8 1 ms 2 Dwell Time 200 100 0 B lo ck ad e s/ s 10 8 6 n 30 20 10 C u rr en t (p A ) 10 8 6 n 150 100 50 T im e ( µs ) 10 8 6 n 120 100 80 60 D w el l T im e (µ s) 10 8 6 n A) Size-discrimination of oligosaccharides
B) High resolution size-discrimination of neutral polymers
K+ EOF Poly-PEG 1500 Mono-PEG 28 b) c) d) e) f)
octa-, deca-saccharide. Each distribution is fitted with an exponential function exp(−f∙Ti). Insert: blockades frequency f according to the number of monomeric units. (c) Normalized current blockade distribution in presence of hexa-, octa-, deca-saccharide. Each distribution is fitted with a Gaussian function. Insert: average current blockade according to the number of monomeric units. The dotted line is a guide for the eyes. (d) Normalized logarithmic distribution of dwell time in presence of hexa-, octa-, deca-saccharide. Each distribution is fitted with a log normal function. The dotted line corresponds to the rise time threshold. Insert: average dwell-time according to the number of monomeric units. (e) Normalized linear distribution of dwell time in presence of hexa-, octa-, deca-saccharide. Each distribution is fitted with an exponential function. Insert: characteristic dwell-time according to the number of monomeric units. B) High resolution size discrimination of neutral polymers. (f) Interaction of polyPEG1500 and monoPEG28 with aerolysin at increasing trans-negative voltages (top to bottom). I/Io histograms and scatterplots of dwell-time vs I/Io. The positions of I/Io-values for PEG of 18, 28, 38, and 48 are indicated. (Reprinted with permission from reference38 Copyright 2015 American Chemical Society)
Glycosaminoglycans (GAGs) are biologically active anionic carbohydrates that are among the most challenging biopolymers to structurally analyze and functionally assess95. GAGs are highly anionic linear polysaccharides expressed at the cell surface and in the extra-cellular matrix, which mediate cell-cell and cell-matrix interactions involved in a variety of physiological and pathological functions such as in embryonic development, cell growth and differentiation, homeostasis, inflammatory response, tumor growth and microbial infection.
The monomeric unit of hyaluronic acid (HA) chain is a di-saccharide composed of D-glucuronic acid (blue circles in figure 6a) and N-acetyl glucosamine70 (red circles in figure 6b). Fennouri et
al reported the discrimination of hexa-, octa- and deca-oligosaccharides of HA at the single
molecule scale, composed of 6, 8 and 10 monomeric units respectively. This detection is made possible by the strong interactions between short oligosaccharides and the inner side of aerolysin. Recently, these authors have shown that this detection cannot be performed by an α-hemolysin channel because of a low confinement96. From the data obtained70, the inter-time Ti distribution is
plotted according to the number of di-saccharide units (figure 6b). The inset of figure 6b shows the blockade frequency increases with the HA size, whereas a decrease was expected97. In figure 6c, the increase of the blockade current means increasing confinement in a manner consistent with previously reported with PEG chains and an α-hemolysin pore98. One may then suppose that detection is partially performed if the blockade duration is shorter than the rise time threshold (i.e. 2Tr see Eq. 6). Figures 6d and 6e show an increase in blockade durations according to the
number of units. In figure 6e, the corresponding characteristic times Tc are bellow 2Tr for hexa-
and octa-saccharides, showing that a part of the blockades is too short to be correctly detected. This assumption is verified by the figure 6d where the duration distribution is truncated bellow
the rise time threshold (dotted line in figure 6d). Aerolysin pore is therefore suitable for the detection of small oligosaccharides, but the transport duration must be increased account for all blockades. To perform this, Long and colleagues mutated binding sites inside the channel to increase nucleotide interactions40,99,100. Being amino acids, these binding sites are pH responsive59.
Baaken et al. explored the possibility of aerolysin to sense PEG molecules under high salt conditions as a nanopore based single molecule mass spectrometer38. In fact, it was already shown that PEG oligomers strongly interact with an ⍺-hemolysin pore, giving rise to long lasting resistive pulses, the amplitude of which is determined by size or mass of the interacting PEG81. On other hand, small and high molecular masses are not detectable. Baaken et al. decided to test if aerolysin was sensitive enough to detect small PEG chains at monomeric resolution. They used polydisperse PEG (Mr = 1500, polyPEG1500) with excess of highly monodisperse PEG of 28 repeat units (PEG28, Mr = 1252) as an internal standard (Figure 6B). They observed well-resolvable resistive pulses yielding a histogram of relative residual conductance (I/Io) with clearly discernible maxima corresponding to the different PEG species present. They found that, indeed, aerolysin mass spectrometer yields enhanced mass discrimination due to a combination of high signal to noise ratio as a consequence of the large driving force (electrophoretic owing to the coordination of cations to provide the intrinsically neutral PEG with a positive charge). In addition, they also found a steeper mass conductance relation and prolonged dwell times for smaller PEGs due to the pore geometry and its electrical properties.
5. Enzymatic degradation followed by electrical sensing
Enzymes are used in several biochemical reactions essential to the fields of biology and biomedical sciences. These reactions are characterized in bulk by spectrometry or by fluorescence. Nevertheless, the nanopore technique is an ideal tool to study these processes at a single molecule level101. Several publications focused on protein channel detection of enzymatically cleaved biomolecules (nucleotides26 and peptides102,103). Degradation of larger biologic nanoparticles such as amyloids can also be monitored by suitable track-etched channels104. α-hemolysin was mainly used to show nucleotide hydrolysis26, peptide cleavage102,103 or the DNA ligase activity105. The high confinement of aerolysin is adapted to the detection of
small molecules produced by the degradation of hyaluronic acid70,74,96 or by the cleavage of neurotoxins106. In these publications, the authors performed the detection of an enzymatic degradation from the increase of blockade frequency. Just a few of them studied the enzyme kinetics at the single molecule scale by varying the substrate concentration according to a Michaelis−Menten model74,106
.
6. Oligonucleotide size and sequence discrimination
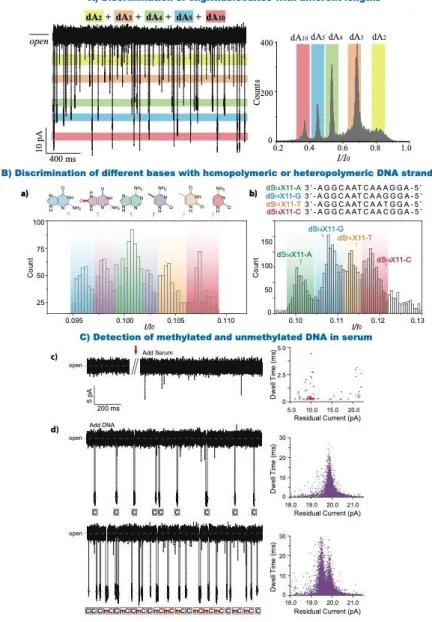
Figure 7: Transport of oligonucleotides through aerolysin. (A) Discrimination of oligonucleotides with different lengths. (a) Continuous trace (left) and histogram of I/I0 (right) for a mixture of dAn (n = 2, 3, 4, 5 and 10). The colored bands represent the blockade current distribution for each analyte in the mixture. (Reprinted with permission from reference39 Copyright 2016
histograms for aerolysin pore interrogated with six kinds of oligonucleotides that only differ at the position of 11 (four kinds of normal base: A, T, C, G and two kinds of damage nucleobases: mC and oG). (b) Histograms of I/I0 caused by the four kinds of nucleobases in a heteropolymeric DNA strand. The sequence information of four ss-DNAs are illustrated at the top of the figure. (Reprinted with permission from reference40 Open Access Copyright under a Creative Commons Attribution 4.0 International
License) (C) Detection of methylated and unmethylated DNA in serum. (c) Continuous raw current traces with and without serum. Short-lived events were induced by the addition of serum. (d) Assignments of C-DNA (blue) and mC-DNA (red) in raw current traces. Two colored short lines and marks were assigned to C-DNA and mC-DNA, respectively. (Reprinted with permission from reference107 Copyright 2017 American Chemical Society).
a) Detection of oligonucleotides and length discrimination
While aerolysin has been used for the past two decades to study various polymers including neutral polymers, oligosaccharides, proteins and peptides, only in 2016 did Cao et al describe the transport of polynucleotides through a wt aerolysin pore for the first time108. They confirmed real translocation using fluorescence of labeled DNA by HEX in the trans compartment. This result is in good agreement with the PCR detection of oligonucleotide through aerolysin89.
Long’s group further explored the discrimination between oligonucleotides of different lengths39
. They showed that wt aerolysin exhibits excellent resolution for the discrimination of dAn (n = 2,
3, 4, 5 and 10) without any DNA labelling. The blockade currents histogram of a mixture of oligonucleotides show well defined pics for each length (Figure 7 A). The high current and temporal sensitivities are attributed to the geometry (constriction) and electrostatic interactions between the oligonucleotides and the pore. They also monitored the degradation of a dA5
oligonucleotide by an ExoI restriction enzyme as a function of time, allowing them to separate the current levels of the cleavage intermediates. A detailed protocol for the discrimination of oligonucleotide lengths and real time monitoring of stepwise cleavage by ExoI is available109.
Structure of small oligonucleotides, from human telomeres, was investigated by Liao et al110. Those oligonucleotides tend to fold and form G-quadruplexes which are impossible to detect through an aerolysin nanopore. The authors unfolded the oligonucleotides via a cation regulation mechanism (MgCl2) and were able to detect different lengths of the telomeres. Dwell times were
proportional to the length.
Interesting work on the detection of cancer cells (Ramos cells) for screening or early diagnosis of cancer has been produced by Xi et al111. They used aptamers prehybridized with a complementary DNA unwound in the presence of target cells. Unwound DNA promotes its enzymatic cycling amplification, resulting in large copy number of output DNA which can subsequently be sensed by an aerolysin nanopore. The authors were able to detect as low as five
cells marking a clear expansion of aerolysin applications into detection of biomarkers and clinical diagnostics.
b) Discrimination of bases of homopolymeric and heteropolymeric DNA
In an attempt to discriminate different bases in an oligonucleotide Cao et al designed DNA oligomers with a single base variation in a dA3 background112. They studied the translocation of
5’-XAAA-3’ oligos through a wt aerolysin, where X can be either A, T, C or G, at femtomolar concentrations (up to 10-15 M). They confirmed that aerolysin can be used to detect single base variations. In fact, each variation produces a distinct residual current, G blocking the pore most, followed by A, T and C. They also achieved discrimination of the four types of nucleobases in a mixture solution with high resolution.
Long’s group then deciphered aerolysin’s sensing spots by analyzing transport of oligonucleotides ranging from 10 to 20 nucleotides via electrical detection and molecule dynamic simulations40. They indentified two sensing spots located at the two main constriction points across the pore lumen (between R220/R282 and between K238/K242). These sensing spots mainly contribute to determine the specific ion current features of the aerolysin, R220 being the narrowest constriction point. By using an oligo differing by a single base (A, T, C, G, mC or OG), the authors are able to see a characteristic ion blockade, corresponding to each base for homo (Figure 7a) and hetero-polymeric (Figure 7b) DNA strands.
c) Effect of site directed mutagenesis on the selectivity and sensitivity of oligonucleotide detection
The original idea of mutagenesis is to design the single biomolecule interface where every amino-acid could be precisely controlled for advanced sensing113. Wang et al recently investigated the effect of single-site mutations on the sensing regions aerolysin’s lumen for oligonucleotides sensing100. The sensing capabilities of aerolysin arise from the confined electrostatic properties and geometrical structure of the pore. The authors substituted the positive amino-acid lysine in position 238, by a neutral amino-acid with a side chain, phenylalanine, or a neutral amino-acid without any side chain, glycine. DNA produced shorter duration times with mutant K238F than with wt aerolysin. It demonstrates that the lumen charge is the main factor
dominating the confined aerolysin-oligonucleotide interactions. However, for the mutant K238G, DNA produced duration times seven times longer than with the wt. Notably, this mutant allowed for the discrimination of methylated cytosine in a hetero-nucleotide with a high temporal sensitivity.
Finally, Wang et al studied the effect of selectivity and sensitivity. They mutated the positively charged R220 at the entrance of the pore with negatively charged glutamic acid and by mutating the positively charged residue K238 with a glutamic acid99. They showed that transport of oligonucleotides was almost inhibited in the mutant R220E, mainly due to a higher entry barrier compared to the wt and demonstrating that the R220 is associated to entrance selectivity of the oligonucleotide into the pore. On the other hand, they showed an increase of the blockade times for the mutant K238E compared to the wt, due to strong interactions between the pore and the oligonucleotides, and demonstrating that K238 is associated to detection sensitivity of the oligonucleotides into the pore lumen.
d) Detection of modified oligonucleotides
Detection of modified oligonucleotides is of great importance for clinical research and early disease diagnostics. Yu et al explored the possibility of detection of DNA methylation under serum conditions107 (Figure 7 C). While they are not directly detecting DNA from serum, they show that it is possible to discriminate between methylated and unmethylated cytosines, even in the presence of serum. The events arising from serum are distinct from the events characteristic of DNA and do not interfere with detection of the oligos. In fact, this approach can even detect methylated cytosine which induced a lower blockade level (3% difference) and longer dwell times compared to cytosine.
Another elegant way to monitor the conversion, detection and quantification of azobenzene-modified oligonucleotides isomers (cis/trans) through an aerolysin pore has been carried out by Hu et al114 and Ying et al115. The authors show that two well defined peaks can be observed
under either UV or vis irradiation of the oligonucleotides. They find photo-stationary conversion values of 82.7% for the trans to cis under UV irradiation and 82.5% for cis to trans under Vis irradiation. They are even able to follow photo-conversion of the azobenzene modified
oligonucleotides in real time with photo-responsive rate constants of 0.43 min-1 from trans to cis and 0.20 min-1 from cis to trans.
7. Secondary structure characterization to size/sequence identification and discrimination
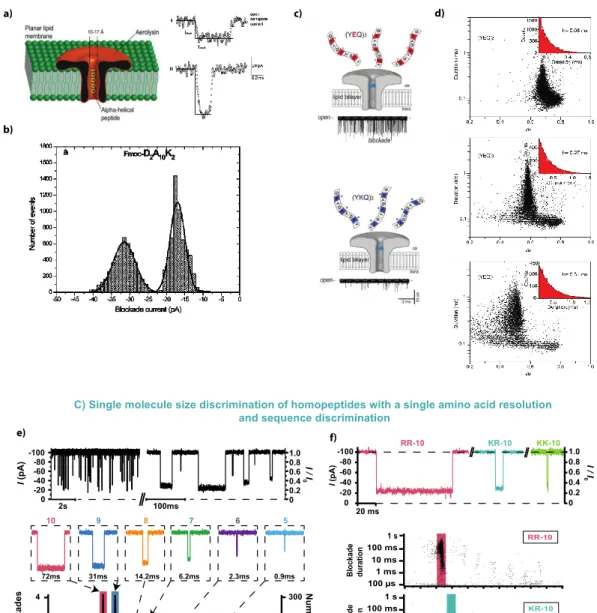
Figure 8: Peptide detection through the aerolysin nanopore: from secondary structure characterization to size/sequence identification and discrimination. A) Different types of ⍺-helical peptides can be transported through the aerolysin nanopore.
Here is an illustration of an aerolysin nanopore ⍺-helical peptide transport experiment; where two types of events are detected attributed to bumping and diffusion events (I) or transport events (II). (Reprinted with permission from reference116 Copyright 2006 American Chemical Society) B) Aerolysin allows the detection of different charge and length hetero-peptides: neutral peptides containing a negative charge (b) or a positive charge (c). Aerolysin is sensitive to the length of the peptide. (Reprinted with permission from reference117 Copyright 2018, John Wiley and Sons) C) Homopolymeric peptides of different lengths from 4
to 10 amino acids are detectable through aerolysin and size-discriminable with a single amino acid resolution. Aerolysin allows the sequence discrimination of peptides per block or 5 amino acids. (Reprinted with permission from reference32 Open Access
Copyright under a Creative Commons Attribution 4.0 International License).
Peptides are fundamental components of cells that key roles in regulating the activity of other molecules. Peptides consist in chains of amino acids that are linked between one another by amine bonds, similarly to proteins structure. However, peptides are defined as chains between 2 to ~100 amino acids. In addition, peptides tend to be less defined in structure than proteins, which can adopt complex conformations. Nevertheless, depending on their length and amino acid composition, peptides may fold as secondary structures, such as a-helix and b-sheets. Here we present how aerolysin has been used to study peptides. More than 10 years ago ⍺-hemolysin and aerolysin were the first biological nanopores used to probe ⍺-helix secondary structures. In their work116, they showed that different chemically modified neutral hetero-peptides, from 14 to 26 amino acids, are transported through the aerolysin nanopore. Transport of these ⍺-helical peptides were demonstrated to be of two types: a brief diffusion in the nanopore (type I), and the transport of the peptides inside the nanopore (type II). Both event types differ in terms of current blockade and blockade duration (Figure 8A). A few years later, shorter peptides were analyzed, with the idea of demonstrating aerolysin nanopore potential for peptide/protein sequencing and biomarker detection. Long’s group117
showed the analysis of hetero-peptides that differ in terms of length (6 to 12 amino acids) and charge through the aerolysin particularly negatively charged peptides (Figure 8B). Very recently, resolution of aerolysin has been extended to detection of short peptides of up to 3 amino acids long32. Homo-polymeric peptides of arginine residues (positively charged) from 3 to 10 amino acids were analyzed through the aerolysin nanopore. It appeared that these polycationic peptides are transported through the aerolysin nanopore. Their contribution to the current blockade is specific allowing for discrimination of peptides differing by just one single amino acid. Authors also compared peptides that differ in sequence per block of 5 amino acids and showed the discrimination of these peptides. These body of work highlights the exciting potential of aerolysin for peptide and protein sequencing, and, more broadly, proteomics.
The discussion will focus only on the advantages and limits of aerolysin compared to other protein channels. It was previously observed that the main conditions for obtaining monomeric discrimination of polymer or peptide polydisperse solution using a protein channel are: (I) each monomer within a chain must contribute to the current blockade, this argument prevents an extended conformation inside the nanopore if the monomer number is larger than the persistence length (4 nucleotides for single stranded DNA and 2 amino-acids for a polypeptide chain); (II) a strong affinity between the molecule and the nanopore is necessary, the interaction’s life time must be 15 to 20 smaller than the acquisition sampling time; (III) the protein channel must be size sensitive to the pore conductance change32,37,38,118. It has been shown that aerolysin has better size resolution for smaller polymer PEG chains38 than an alpha-hemolysin nanopore36 at high salt concentrations. The only difference is the applied potential which is higher with aerolysin (-120 mV) than alpha-hemolysin (+40 mV) and a signal-to-noise ratio increase of approximately38 2.7. The main factor is a considerable increase of the dwell times or interaction times between the small polymer chains and the aerolysin compared to the alpha-hemolysin. An increase in size resolution for larger PEG chains was demonstrated using alpha-hemolysin by increasing the temperature. It is due to the collapse of the polymers inside the pore118. For the longer chains, the resolution is progressively lost. Therefore, the first limit with these two sensors entails is observed when the radius of the macromolecule is larger than the pore radius. For higher molecular masses, the molecular weight distributions of a polydisperse polyelectrolyte (sodium polystyrene-sulfonate) solution can be evaluated by measuring chain translocation times through an α-hemolysin nanopore119
. In this case, resolution lies in between a few kDa to a few dozens of kDa. Up to now, it has not been possible to obtain a monomeric resolution from a polydisperse solution. This phenomenon was also observed with single stranded DNA39,40 and peptides32. The second limitation of aerolysin is the resolution of a single nucleotide39 or 2 amino-acids32. This limit has not been reached with alpha-hemolysin for macromolecules and peptides36,41,42,116,120 or with other protein channels121,122. In order to increase size resolution, one must increase the confinement by adding a molecular adaptor (modified cyclodextrin), decreasing the sensor diameter. This has been achieved for the detection of an individual nucleotide with an alpha-hemolysin pore123. A CuII–phenanthroline protein nanopore was designed to detect D- and L-aromatic amino acids in order to force strong interactions between the monomer and the channel
by chemical modification124. Another potential focus could involve finding aerolysin mutations to increase both current, amplitude and dwell time. Using selected mutants would potentially allow the discrimination of the 20 amino-acids, the main challenge being protein sequencing6.
Interest in detection of biomarkers from serum or cells using protein nanopores has increased and is reflected in recent publications. A true biomarker is a measurable characteristic indicator of normal biological and pathogenic processes utilized to assess the risk or presence of disease, pharmacological responses, or course of therapeutic intervention125. Only a few studies have been published on the detection of biomarkers model using protein nanopores. Most of those studies indirectly detect biomarkers by DNA assisted sensing126-128. To our knowledge, there are only a few articles on direct detection of biomarkers from serum for normal biological process107,129 and human disease34. Up to now, aerolysin does not seem to be the perfect candidate for protein biomarker detection because of its geometry and narrow inner diameter.
Few publications on the nanopore field relate to protein unfolding. Up to now, this field remains a hot topic. Aerolysin and alpha-hemolysin are resistant to chaotropic agents58,130 or temperature60,131. These resistant features made it possible to probe the stability of a wild type and a mutant protein by detecting partially unfolded or completely unfolded states. These resulted in the determination of single molecule level unfolding curves and the nature of phase transition61,91,94. Another approach was to study the co-translocational unfolding by electrical driving force132,133 or with a molecular motor30,134 using an alpha-hemolysin pore. A four-step unfolding mechanism during translocation was observed, for a thiorodoxin protein covalently attached to an oligonucleotide under a constant electrical driving force132. This differed from the mechanism observed in bulk. It was also shown that the unfolding process is different in term of molecular steps, kinetics and pathway if the pulling process is initiated by the protein C-terminus or N-terminus133. Another approach to study protein unfolding employs a molecular motor. An executed concept involved an ubiquitin-like protein (Smt3 domain) attached to a charged flexible linker with an ssrA tag at its C-terminus to bind an unfoldase ClpX variant. After the capture of the protein complex into the alpha-hemolysin and the binding to the motor, the unfoldase generated a mechanical force allowing unfolding of the protein. The current trace was different for the enzymatic unfolding process compared to the electrical pulling30. This allowed to identify protein domains (titin), variants and structural modifications134. A limit of the aerolysin is the possibility to detect and characterize peptides or small proteins in a label free approach, like
Fragaceatoxin C,122,129 Cytolisin A135 or portal protein G20c channels21. The future challenges are to study disordered proteins involved in human diseases. It would also be interesting to perform unfolding curves of other proteins in order to determine their stability with ligands; and study their enzymatic unfolding with a molecular motor to probe secondary structures and topology domains.
VOCABULARY
Aerolysin: protein nanopore, member of the pore forming toxin (PFT’s) family, expressed naturally by Pseudomonas aeruginosa. Nanopore: natural or artificial hole of nanometer size inside a membrane. Electrophoresis: The dynamics of an electrically charged molecule governed by an electric force. Electro-osmotic flow: movement of solvent across a charged nanopore induced by an applied electric potential. Energy barrier: an energy cost associated to ion/macromolecule entrance or transport through a nanopore. Size discrimination: the capability to separate macromolecules by their size/length at the monomer resolution using the blockade current amplitude.
Acknowledgements
This research was supported by the ANR-17-CE09-0044-02 and the by the Région Ile-de-France in the framework of DIM ResPore (n° 2017-05). We thank John T. Gonzalez for careful reading and for improving the use of English in the manuscript.
AUTHOR INFORMATION Corresponding Authors
*E-mail: Juan.Pelta@univ-evry.fr
(1) Misawa, N.; Osaki, T.; Takeuchi, S. Membrane Protein-Based Biosensors. J. R. Soc.
Interface 2018, 15, 20170952.
(2) Oukhaled, A.; Bacri, L.; Pastoriza-Gallego, M.; Betton, J.-M.; Pelta, J. Sensing Proteins Through Nanopores: Fundamental to Applications. ACS Chem. Biol. 2012, 7, 1935– 1949.
(3) Majd, S.; Yusko, E. C.; Billeh, Y. N.; Macrae, M. X.; Yang, J.; Mayer, M. Applications of Biological Pores in Nanomedicine, Sensing, and Nanoelectronics. Curr. Opin.