HAL Id: halshs-00954770
https://halshs.archives-ouvertes.fr/halshs-00954770
Preprint submitted on 3 Mar 2014
HAL is a multi-disciplinary open access
archive for the deposit and dissemination of sci-entific research documents, whether they are pub-lished or not. The documents may come from teaching and research institutions in France or abroad, or from public or private research centers.
L’archive ouverte pluridisciplinaire HAL, est destinée au dépôt et à la diffusion de documents scientifiques de niveau recherche, publiés ou non, émanant des établissements d’enseignement et de recherche français ou étrangers, des laboratoires publics ou privés.
Is the European Union a ruler? A natural experiment
on attribution of responsibility
Abel François, Cal Le Gall, Raul Magni Berton
To cite this version:
Abel François, Cal Le Gall, Raul Magni Berton. Is the European Union a ruler? A natural experiment on attribution of responsibility. 2014. �halshs-00954770�
Sciences Po Grenoble
working paper n.19
Is the European Union a ruler? A natural experiment on
attribution of responsibility
Abel François, EM Strasbourg Business School, LaRGE Cal Le Gall, University of Salzburg, SCEUS
Raul Magni Berton, Univ. Grenoble Alpes, Sciences Po Grenoble, PACTE
February 2014
Partners //
Is the European Union a ruler? A natural experiment on attribution of
responsibility.
Abstract
Economic-voting literature has shown that support for the EU depends on macroeconomic variables - mainly unemployment and inflation - just like support for national governments. This suggests that citizens reward or punish the EU according to the state of the economy, as if EU was deemed responsible for it. In order to test this hypothesis, we need to prove that EU support depends on the state of the economy only when the EU is actually in charge. Based on Eurobarometer surveys which were carried out three years before and after the 2004 wave of accession, we analyze economic support for the EU in the ten countries which joined European institutions on this occasion. We find that macroeconomic variables did not affect support for the EU before accession and that they considerably altered it after 2004, which confirms that citizens attribute responsibility to the EU for the state of the economy.
1. Introduction
Since the middle of the 1990s, the European Union (EU) has increasingly turned into a polity (Van Gerven, 2005, Brouard et al., 2012) as its legislative endowments and activities have increased (König et al. 2012). Transposition of EU directives has also become commonplace in most member states. Hence, it has been possible to hold the EU responsible for member states’ policy-making for almost twenty years. However, a number of authors have pinpointed EU accountability deficits, arguing that no appropriate accountability regimes have been created in order to accompany this development (Schmitter, 2000; Follesdal and Hix, 2006). Despite the opaque nature of EU institutions, citizens have to determine whether the EU, as a system of governance, should be held responsible for domestic economic conditions. This article deals with this issue and shows that citizens who are genuinely EU citizens consider the EU responsible for the macroeconomic situation of their countries.
In line with empirical studies on political accountability, we assume that individuals reward or punish incumbents for economic performance. This reward-punishment hypothesis derives from two assumptions. First, citizens are supposed to perceive the ruling body as responsible for the macroeconomic situation, and second they are assumed to reward it if they are
satisfied with the state of the economy, and punish it when the economic situation goes awry (Anderson, 2000; Lewis-Beck and Paldam, 2000; Paldam, 2008, Bellucci and Lewis-Beck 2011). Consequently, if support for the EU depends on the macroeconomic situation, the EU is presumably deemed responsible by citizens.
Existing studies of public opinion and European integration highlight that indicators of economic performance such as inflation or unemployment – which are strong determinants of support for national governments – are also major predictors of citizens’ attitudes toward European integration (Gabel and Palmer 1995, Anderson and Kaltenthaler, 1996, Anderson 1998, Dalton and Eichenberg, 1993, 2007). However, contrary to national studies on political
support, we cannot compare situations in which the EU is an incumbent with those in which the EU is not because of the intergovernmental shape of European executive power. In other words we do not have a counterfactual situation to validate the hypothesis. The reward-punishment hypothesis should predict that, when a country becomes an EU member, support for the EU depends on the macroeconomic situation while this is not the case when the country is not an EU member. The first prediction is the only one to have been tested, so we cannot conclude that the EU is actually deemed as responsible by citizens. A better economic situation can also make people globally more optimistic, and might lead them to increase their support for issues across the board. Furthermore, because national governments generally support the EU, citizens can perceive the EU rather like a specific governmental policy than like an additional level of governance.
In order to clarify this causality, we use a political change as a natural experiment in countries that joined the European Union during the 2004 accession wave, i.e. Cyprus, the Czech Republic, Estonia, Hungary, Latvia, Lithuania, Malta, Poland, Slovakia, and Slovenia. In these countries, citizens answer the same questions about the benefits of being within the EU several years before and after membership. Until 2004, the EU had not ruled over them, therefore, we expect that support for the EU did not depend on the state of the economy at that time. In 2004, the EU was included among the rulers and we expect the
reward-punishment mechanism to be triggered1. Our empirical results confirm that individual support for the EU is affected by the macroeconomic performance only in the post-membership period, that is to say when the EU legally became a ruler.
1 Strictly speaking, a random experiment must include a control group. However, the literature already provides
evidence that support for the EU is sensitive to the state of the economy before and after 2004 in old member countries (Garry and Tilley 2009, Scheuer and Schmitt 2009). These previous studies can therefore be considered as the “control group”.
The next section is dedicated to a brief review of the literature on what determines the level of support for European integration, especially focusing on economic factors. The third section of this article presents our theoretical framework which is based on economic voting analysis of EU support. The dataset used for the empirical work is displayed in the fourth part and the estimated results are presented in the fifth section. Finally, we discuss our results more broadly in the concluding section.
2. Economic-based support for the European integration process
Empirical literature has used different kinds of measurements to assess citizens’ attitudes to European integration. On the one hand, some studies have been based on polls, especially on Eurobarometers because they provide good indicators of support for the European integration process both within old member states (Gabel and Whitten 1997, Christin 2005) and within candidate countries (e.g. Cichowski 2000, Elgün and Tillman 2007); and because they provide information on attitudes towards specific European policies such as the common foreign and security policy (De Vreese and Kandyla, 2009). On the other hand, several studies have used outcomes of elections to assess support for the EU, mainly via national referenda on European issues (e.g. Christin and Hug, 2002, Glencross and Trechsel, 2011) and through the analysis of European Parliamentary Election (EPE) results (e.g. Tilley et al. 2008, Hix and Marsh 2011). In doing so, the authors investigated individual or aggregate support for the EU at a regional or national level, measured by either the level of popularity indicated in polls, or vote-share in elections.
In the economic-voting literature, two main dimensions are distinguished. First, support can be retrospective, i.e. exclusively based on past performance, or prospective, i.e. based on expectations about the future economic outlook. Second, support can be based on sociotropic or egotropic reasoning. In the first case, citizens feel concerned about the economic situation
of the country, i.e. macroeconomic, while in the second case they worry about their own personal situation, i.e. microeconomic.
The sociotropic approach has already been expanded to support for the EU with respect to global economic factors such as unemployment, inflation and growth and it has been
demonstrated that national levels of support for the process of integration are systematically higher when national economic performance is favorable (Anderson, Kaltenthaler, 1996, Dalton and Eichenberg, 1993, 2007). This is particularly obvious within Eastern and Central European (ECE) countries (Tucker et al., 2002, Tverdova and Anderson, 2004). ECE citizens are particularly responsive to macroeconomic performance when they cast their ballots and a phenomenon of hyper-accountability, i.e. consistent punishment and a high electoral
accountability, was unveiled by Roberts (2008) at the cross-national level. In addition, a large body of evidence proves that citizens deem the European Union to be responsible for the national state of the economy (Herzog and Tucker, 2010). Bartkowska and Tiemann (2011) have recently shown that EPEs work as “referenda on the economy”, and Tilley et al. (2008) showed that economic perception is a good predictor of voting choice in EPEs. Therefore, the economic-voting theory can help us further comprehend voters’ attitudes to the European polity, especially in the case of ECE countries.
Egotropic support has also been explored in the literature. This microeconomic approach puts an emphasis on the costs and benefits of EU membership (Gabel, 1998, Anderson, 1998) assuming that citizens’ support for the EU is positively correlated to individual gains deriving from the European integration process (Gabel and Palmer, 1995; Gabel, 1998). Because the European Union is an international organization which promotes policies enhancing the free movement of people, goods, services, and capital and which foster market liberalization, it offers better opportunities to citizens who have greater investment capacity or professional skills; who are more mobile; and who live in areas around borders (Gabel, 1998). These
studies use mostly proxy variables such as educational attainment or household income and show that the latter are particularly valid predictors of citizens’ attitudes to the EU.
Although important, the economic situation is not the only explanatory factor to account for EU support. Apart from this utilitarian perspective, studies have emphasized the importance of the national context arguing that, given different histories and framing (De Vreese, 2001; Diez Medrano, 2003), citizens apprehend European integration in a different manner. A proxy-logic has also shown that confidence in national party systems and proximity with mainstream parties lead to a positive assessment of European integration (Belot, 2002). Finally, more recent studies have demonstrated the key role of identity-related matters (Carey, 2002, McLaren, 2002, 2007, Marks and Hooghe, 2005, Kriesi, 2008). Because the European Union is perceived as a political institution which contests the authority of the nation-state while intensifying the opening up of borders, it can be seen as a threat to the national community. In the same vein, some scholars conclude that the increasing influence of the European Union on domestic policies ends up reducing national political entities’
responsibility for the economic situation (Veiga and Veiga 2004).
All in all, although we have firm confirmation of the influence of economic conditions on support for the EU, only one study has directly dealt with citizens’ attribution of
responsibility to the EU (Hobolt and Tilley, 2013). Hence, it seems appropriate to make another test that would help us better understand the extent to which citizens actually deem the EU responsible for the state of the economy. This is why our study aims at further
investigating the traditional explanations for support for the EU by focusing on attribution of responsibility and macroeconomic determinants. In the next section, we present the
theoretical background from which we derive our empirical predictions.
Drawing on the Eastonian concept of specific support which argues that citizens evaluate authorities “according to the extent to which [individuals’] demands are perceived to have been met” (Easton, 1975: 438), most of the works which study EU attitudes in the light of the economic situation do not analyze EU support in terms of attribution of responsibility, but rather in terms of the perceived costs and benefits of the integration process (Dalton and Eichenberg, 2007). Only recently, the hypothesis that the EU is deemed as a responsible level of governance by citizens has been empirically analyzed (Hobolt and Tilley 2013). As a consequence, support for the EU is apprehended as support for a governmental policy-process (the integration process) rather than as support for a decision-maker (the EU) and available studies do not allow us to discriminate between these two rival interpretations. This article takes advantage of the institutional evolution which occurred in 2004 to tackle this question. If the EU is perceived by citizens as a policy process, we should observe the same causal mechanism for support when countries are members and when they are candidates. In both cases, national governments are responsible for the process of integration and all citizens are advantaged or disadvantaged by European policies. On the contrary, if the EU is perceived as a decision-maker, the mechanism of attribution of responsibility to the EU should be triggered only after accession, and not before.
The key hypothesis tested is that EU starts to be perceived by citizens as responsible for the state of the economy only when it becomes institutionally responsible for a set of policy areas, not merely when it pressures candidate states to apply the Copenhagen Criteria. So, the
comparison of people’s pre- and post- membership reactions makes it possible to infer the attribution of responsibility to the EU because an institution begins to be perceived by citizens as genuinely responsible only when it is in charge. It could be argued that the EU has an impact on candidate countries' economies prior to EU accession because, within the context of the Euro convergence program and the European Exchange Rate Mechanism, it sets up strict
criteria to achieve membership which affect candidate countries’ economic performances. However, our hypothesis states that indirect institutional influence does not affect citizens' support and that only a genuine institutional ruler is seen as responsible because candidate countries remain theoretically able to exit the process of accession at any moment prior to accession. If this hypothesis proves to be right, we conclude that the EU is perceived as an actual ruler, not merely as an agent of policy-making.
The accession of ten candidate countries in 2004 allows us to observe how individuals change the way in which they assess EU responsibility for economic conditions. It was the first time that so many countries had simultaneously entered EU institutions. Moreover, these countries are particularly interesting because their citizens have been included in Eurobarometer
surveys since 1991. It has to be noted that the year 2004 was neither politically, nor economically particular, except for the fact that ECE countries became members on this occasion, after a referendum in most cases2. Therefore we assume that the change in individual attitudes is only due to the accession variable. This allows us to consider it as a natural experiment, in which we compare the factors that affect support for the EU before and after 2004.
We start by considering three different kinds of reactions to macroeconomic performance and its impact on support for the EU. First, we assume a situation in which macroeconomic conditions have no impact on support for the EU. Second, we consider a situation where macroeconomic conditions have a positive effect on support for the EU: a better (conversely, a worse) economic situation leads to an increase (conversely, a decrease) in the support. Finally, we consider a situation where the national economic performance has a negative effect on support for the EU. In other words, a better (conversely, a worse) economic situation leads to a decrease (or an increase) in support.
2
Then, we introduce a temporal dimension by distinguishing the periods of pre- and post- accession to the EU. Given the three reactions described and the two periods (before and after accession), there are nine potential situations. It is this temporal dimension which allows us to infer attribution of responsibility to the EU because it represents an institutional watershed. The simplest scenarios reveal cases where reactions to macroeconomic situation are similar in the pre- and post-accession periods (positive or negative reactions or none). These three different scenarios share one specific characteristic: EU membership does not change the relationship between citizens’ perception of the EU and the economic situation. As a result, no conclusion can be drawn about the perceived responsibility of the EU. The six other situations depict different changes in the relationship between the economic situation and support for the EU. But among all these possibilities, we focus only on two situations which allow us to infer the perceived responsibility of the EU. The first case is the simplest one and corresponds to an “institutional responsibility”. Until membership, the EU is not deemed responsible for the macroeconomic situation and support for the EU increases with good economic performance only once the country enters the European institutions, i.e. when the EU takes the helm institutionally-speaking. Although the EU is not responsible during the pre-membership period, it clearly becomes responsible for economic performance after membership. In this case, European institutions are considered by the population just like any other government.
The second situation is the case of “alternative responsibility”. In this perspective, the EU is judged as an incumbent in the second period but it is considered as a challenger when the country is a candidate. In the pre-membership period, macroeconomic fluctuations negatively influence citizens’ support for the EU. For example, a poor economic situation increases the support for the EU. In this case, people consider EU institutions as an alternative to the national government during the first period.
The four other cases are less consistent and do not offer enough analytical elements to infer anything about the attribution of responsibility to the EU. To briefly conclude, three situations are coherent with the political economy theoretical model of support amended by the
institutional change of joining Europe. They inform us about the perceived responsibility of the EU, not only its mere existence but also its positive or negative direction: no attribution of responsibility (case 1), institutional attribution of responsibility (case 2) and alternative attribution of responsibility (case 3). However, we have no analytical reason to prefer one case to another from a theoretical standpoint. In fact, only an empirical study can help us figure out which situation actually occurs and, thus, the extent of the perceived responsibility of the EU.
4. Presentation of the empirical study
In order to test these hypotheses, we carry out an empirical analysis on six Eurobarometer surveys in ten countries, three of them conducted before the 2004 wave of EU accession, and three afterward. The next section describes these data and the following one provides more detail on the empirical model.
4.1. Data description
Our analysis of EU support is based on Eurobarometer surveys which were conducted before and after the ten countries joined the European Union during the 2004 accession wave, namely Cyprus, the Czech Republic, Estonia, Hungary, Latvia, Lithuania, Malta, Poland, Slovakia, and Slovenia. We decided to investigate the three available surveys before and after 2004, i.e. 2001, 2002, 2003, 2005, 2006, and 2007 to view the situation with hindsight and to limit the discrepancies between each country’s progress toward accession. In addition, investigating several periods limits the incidence of specific national debates or domestic events which can promptly modify support for the EU (Brinegar and Jolly, 2005).
The main difficulty is to find continuous and corresponding questions to measure support for the EU before and after 2004.We have come upon a question which links the two periods investigated by scrutinizing the Candidate Countries’ Eurobarometer and the Standard Eurobarometer. This question focuses on an individual evaluation of EU membership and is worded as follows: “Generally speaking, do you think that our country's membership of the European Union is/ would be…? Answer: a good thing; a bad thing; neither good nor bad”. Through this question, we crafted a binary variable based on the distinction between
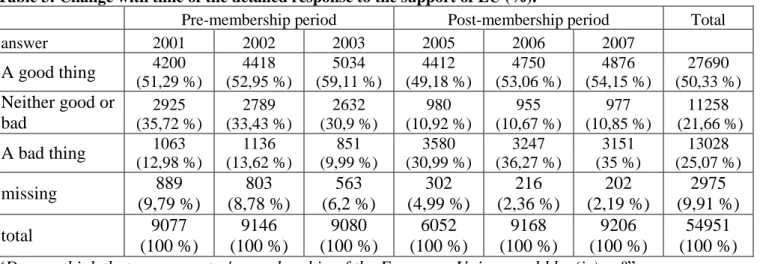
supporters (answer a “good thing”) and non-supporters of the EU (other respondents). We rearranged the variable in order to neutralize the variation of the median position (the neutral item “neither good nor bad”) that decreases with time (see table 2 in the appendix3). It is worth noting that we excluded from our analysis the missing data, the incidence of which decreased over time. As a result, we have a direct measurement of support for the EU during the two periods which gives us the opportunity to indirectly test the perceived responsibility of the EU.
At first glance, figure 1 shows that support for the EU increases over time, even though the moment of accession seems to have had a negative influence on this support as it moves from 64 per cent in 2003 to 57 per cent in 2005 on average.
Figure 1 and 2 around here
Furthermore, the trend has also been observed at the national level (figure 2). Citizens’ support for the EU increases in almost every country of our sample from 2001 to 2007, with the notable exception of Hungary which shows an atypical evolution.
4.2. The empirical model
In our empirical model, we estimate the probability of support for the EU at the individual level measured through the previously defined variable. This relies on a latent variable, called
3
and is defined as , where i denotes the individual living in the nation k during the year of interview t. is a vector of individual
characteristics and is the vector of the macroeconomic situation of the nation considered. measures an individual’s subjective evaluation of the membership of his/her country within the EU. This measurement is not observed, but we know the degree of support for EU membership through the Eurobarometer binary observed variable . The two variables are linked with the following measurement equation:
In order to estimate this binary variable, we use the maximum likelihood method and we assume that errors are logistically-distributed. The main statistical concern of our estimation is that we introduced country variables (see below). In other words, these variables are identical for all the respondents living in the same country in a given year. This could perturb the errors because residuals might be correlated with unobserved features of the country. So, in order to avoid this potential concern which may affect the quality of the estimation, we use two strategies. First, we introduce a dummy variable by country in order to take into account other characteristics at the national-level as if we were introducing fixed effects associated with each nation. We also integrate dummy variables for each year within our estimation. Second, we correct the variance of errors using the cluster method (see Cameron and Trivedi, 2006). These modifications serve to ensure the quality of our estimations rendering the results reliable.
To explain the probability of support, two kinds of explanatory variables are used. First, our decisive variables deal with the country’s macroeconomic situation. Following a standard vote-popularity function (Paldam 2008), we select two variables describing economic
performance: the average annual rate of unemployment and the annual inflation rate. All these variables are measured at the country level.
Insert figure 3 and 4 around here
As depicted in figures 3 and 4, the variable has a divergent evolution even if the magnitude of the changes is higher for the inflation rate. As for support for the EU, we note several patterns of evolution. Except for Hungary, the unemployment rate decreases during the period, from 2001 to 2007, or is relatively stable. On the contrary, the evolution of the inflation rate describes a U shaped curve in most of the countries.
We also use a classic set of individual control variables, such as gender, age, education (the age at which people completed their full time education), marital situation, household size, the size of the agglomeration where respondents live, respondent’s professional situation and property ownership.
These variables indirectly take into account what citizens gain from the EU at the microeconomic level. Here, the assumption is that the objective impact of entering the
common market on individuals’ economic welfare is linked to their personal levels of income, to their professional activity and to their level of education (Gabel, 1998; 2000). Indeed, Gabel has demonstrated that citizens with a higher level of education and with a high-skills profile who live in areas that benefit from EU membership tend to value their countries’ membership of the European institutional framework more than others.
Besides, we introduce a variable likely to measure people’s general satisfaction with their own personal situation. In doing so, we are able to control for the influence of individual subjective well-being on support for the EU. We have also added two political variables, i.e. the frequency of discussion of political topics and the respondent persuasiveness. These two last variables are proxy measures which aim to evaluate respondents’ degree of politicization. However, it is important to note that Eurobarometer surveys do not provide questions
allowing us to take into account identity values in a constant manner. Undoubtedly, this shortcoming has an impact on the quality of our estimation as identity factors have been
proved to be relatively good determinants to explain individuals’ support for the EU (Carey, 2002; McLaren, 2002; Marks and Hooghe, 2005). Nevertheless, as this study partly focuses on ECE countries which are largely said to be more affected than others by economic factors due to the fact that consolidation of the economic transition toward the free-market and capitalism was linked to joining the EU (Tucker et al., 2002), we assume that identity factors play a minor role within these countries. Moreover, in a comparative study in Western states, Gabel has explained that economic factors are better determinants of support for the EU than any other determinant (Gabel, 2000).
Finally, we carry out estimations for two sub-periods: before (from 2001 to 2003) and after membership (from 2005 to 2007), and we exclude the year of integration (2004) because we do not know to which sub-period this year belongs. Rather than carrying out a single
estimation on the overall sample with a dummy variable of the period interacting with macroeconomic variables, we adopt this estimation strategy for three reasons. First, whereas the interactive variable is widely used in standard linear regression (Gujarati 1970a and 1970b), its extension to binary model is not trivial and is still subject to debate (see for instance Ai and Norton, 2003). In particular, we cannot infer anything about the magnitude effect of an interactive variable as a standard explanatory variable. Second, using an
interactive strategy ends up increasing the correlation between independent variables because of the addition of new variables. Indeed, dummy variables such as country, year,
macroeconomic situation and period (for instance the period after accession) are correlated, and the effects of each variable might therefore be confused. Third, splitting the sample allows us to study the change in other explanatory variables, especially microeconomic and demographic variables.
According to our hypotheses, the crucial assumption is that the coefficients associated with the macroeconomic variables are different across the sub-periods. These differences are
supposed to depict citizens’ attribution of responsibility to the EU. More accurately, we can formulate our empirical hypothesis with and coefficients associated with a macroeconomic variable where an increase denotes an improvement in the macroeconomic performance, for both the pre-membership and post-membership periods. Here, we
distinguish the three previously described hypotheses:
H1, “no attribution of responsibility” is validated1 if
H2, “institutional attribution of responsibility” is validated if and
H3, “alternative attribution of responsibility” is validated if and
To compare the coefficients across the sub-periods, we run exactly the same estimation for each sub-sample.
5. Results of estimations
The results of our estimations are presented in table 1. The quality of the estimation seems to be quite satisfactory. The McFadden pseudo R2 is around 0.1 for the first period and around 0.09 for the second. By comparing the true value and the predicted probability, we find that 68.3 per cent of the observations are correctly classified (with a cut-off of 0.5) in the pre-membership period while 67.9 per cent are accurate within the second sub-sample. Hence, the explanatory power of our model appears to be stable across the sub-samples. Furthermore, we test the robustness of our model with regards to the definition of the support variable. Indeed, we ran the same estimation, first excluding the answer “neither good nor bad” from the sample, and second using the initial support variable with three items through an ordered probit model. In both cases, the results are relatively similar to those obtained initially. In other words, our estimations are not sensitive to the definition of the dependent variable.
Before discussing the impact of the macroeconomic situation, we briefly detail the results of the individual determinants of support for the EU.
Table 1 around here
The most notable elements concerning individual variables are in line with the previous results of the literature dealing with support for the EU. There are four variables for which no change between the two periods has been found. First, support for the EU increases with people’s satisfaction with life in every sub-sample. Second, the probability of supporting EU membership increases with the level of interest in politics. Third, the level of education strengthens the probability of supporting the EU. Finally, it is worth noting that men tend to be more supportive than women.
However, five individual variables lost their significance after 2004. First, we observe that age, the size of living area and house ownership has no impact on support for the EU in the post-membership period whereas it does in the pre-accession period. Also, the frequency of respondent’s persuasiveness slightly loses its impact. Note that, except for real-estate ownership, these variables are not economic indicators.
In contrast, the professional category is more relevant to forecast EU support in the second period. Notably, in comparison with being an entrepreneur, being unemployed predicts low levels of support only after 2004. This suggests that egotropic support for the EU is triggered after accession, possibly meaning that the EU starts to be perceived as responsible for
people’s individual situation at this stage.
When turning to the sociotropic effect, our analysis clearly shows that the second hypothesis, i.e. the institutional attribution of responsibility to the EU, is supported by empirical results. During the pre-membership period, a higher rate of inflation or a higher level of
unemployment have no impact on the probability of supporting EU membership, whereas during the post-membership period, we find that the probability of supporting EU
membership decreases: the coefficients are not statistically different from zero in the
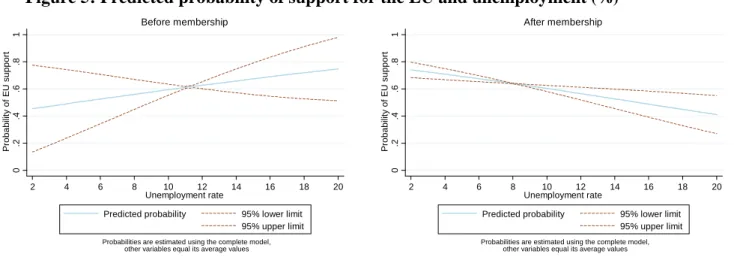
estimation for the first period but significant and negative in the second estimation. Figures 5 and 6 depict the predicted probability of supporting EU membership for each sub-sample according to the rate of inflation and unemployment. The figure clearly shows a change across the periods even if the coefficient is higher for unemployment than for inflation during the post-membership period.
Insert figure 5 and 6 around here
There is a greater influence on the predicted probability of supporting EU membership for the unemployment rate since the magnitude of the effects is different. An increase in the
unemployment rate of 1 per cent leads to a decrease of 0.2 per cent in the probability. And if the inflation rate increases by 1 per cent, the probability of support decreases by 0.06 per cent. The difference in the magnitude of the effects can be explained by the difference of variance across the macroeconomic variables. The standardized odds-ratios give similar results. An increase of one point in the standard-deviation of the unemployment rate leads to 0.7 times less chance of supporting the EU. In addition, an increase of one point in the standard-deviation of the inflation rate implies 0.8 times less chance of supporting the EU. These results are not mere statistical artifacts due to the correlation between the
macroeconomic variables. First, the simple correlation coefficients between them are quite low. In addition, although the removal of the other variables has an impact on the significance of the rate, the coefficient signs are not affected, as shown in table 2.
In conclusion, our empirical analysis clearly shows that the second hypothesis, i.e. EU “institutional attribution of responsibility”, is validated as citizens’ support for the EU is influenced by the macroeconomic situation only when the country officially enters the EU, that is to say once the European institutions become an effective ruling body. In other words,
in line with the economic-support thesis, people perceive the EU as responsible only when the EU is in charge. In the meantime, the two alternative hypotheses are not validated.
6. Conclusive discussion
This paper sheds light on the issue of clarity of political responsibility. The main finding is that citizens perceive ruling institutions correctly as they start to punish and reward the EU for the state of the economy only when the EU is genuinely in charge. We observe that the
macroeconomic situation affects support for the EU immediately after the accession.
Furthermore, this finding implies that voters do not underestimate the supra-national level of decision-making. And finally, although the EU has strong economic, political and
institutional requirements that candidate countries have to fulfill in order to join the EU, citizens clearly deem the EU responsible only when the country acquires the legal
membership status. This is coherent with the idea that whatever the indirect influence of a supranational institution, the national government is the main responsible agent for citizens as long as the country remains fully sovereign. When the country surrenders a part of its
sovereignty, people reallocate responsibility to the new ruler.
Note that although we have focused on sociotropic support for the EU, egotropic factors confirm the same finding. Indeed, whereas before 2004, support for the EU was
fundamentally linked to sociological factors such as satisfaction with life, frequency of political discussions and the size of the area in which people live, these factors have taken a back seat in favor of the professional status which became more prominent after accession. To sum up, all the results confirm that EU citizens perceive the EU as a responsible decision-maker, rather than a policy-process for which the national government remains fully
responsible.
Besides providing an insight into attribution of responsibility, our results are useful to better understand two much-debated issues in European studies: the democratic deficit problem
(Follesdal and Hix, 2006) and the partisan change among new members (Vachudova, 2008, Nedelcheva, 2009). In the former, the opaqueness of EU institutions has two different meanings. First, it is difficult for citizens to distinguish between EU and national
competencies, and this can lead citizens to underestimate EU responsibility. Second, it is also difficult to identify responsibilities inside EU institutions. This article provides evidence that citizens generally know that the EU is responsible for the state of the economy, even though they may not have a clear idea of the respective responsibilities of every institution within the European organization. This means that when the economy takes a turn for the worse, people punish the EU. This is a necessary condition to provide incentives for EU decision-makers to be responsible. However, this responsibility is collective since the EU is punished as a whole. Therefore, we cannot say if this incentive is sufficient to provide decision makers with
incentives to do the right thing.
The second debate deals with the paradoxical partisan changes that occurred in some ECE party systems after EU accession. We observe an intensification of Eurosceptic rhetoric (Vachudova, 2008, Nedelcheva, 2009), even though support for the EU remained stable after 2004 in public opinion polls. This was notably the case within mainstream political parties such as the FIDESZ in Hungary, the ODS in the Czech republic, the PiS in Poland or protest parties such as the SNP in Slovakia which developed, and benefited from harsher Eurosceptic rhetoric after accession. Our results shed light on this puzzle. Because the EU is deemed responsible for economic conditions only after accession, political parties' electoral incentives have changed since 2004. From this date, citizens have shown an inclination to punish the EU when the economy gets worse. Although the European political system does not allow
citizens to punish or reward EU governments, they can punish the EU at the national level by voting for political parties which are less inclined to accept European constraints. Therefore, being Eurosceptic helps political parties in member states benefit from a poor economic
outlook. Since in candidate countries this is not the case, many parties intensified or even shifted their discourse only after their country’s accession.
7. Appendix
Table 2 around here Table 3 around here 8.References
Ai, C. and Norton, E. (2003), Interaction terms in logit and probit models, Economics Letters, 80, pp. 123-129.
Anderson, C.J. and Reichert, S. (1995) Economic Benefits and Support for Membership in the
E.U.: A Cross-National Analysis, Journal of Public Policy.15, pp. 231-249.
Anderson, C.J. and Kaltenthaler, K.C. (1996) The Dynamics of Public Opinion toward
European Integration, 1973-93. European Journal of International Relations, 2, pp. 175-199. Anderson, C.J. (1998) When in Doubt, Use Proxies, Attitudes toward Domestic Politics and Support for European Integration. Comparative Political Studies, 31, pp. 569-601.
Anderson, C.J. (2000) Economic voting and political context: a comparative perspective,
Electoral Studies. 19, pp. 151–170.
Anderson, C.J. (2007) The End of Economic Voting? Contingency Dilemmas and the Limits of Democratic Accountability. Annual Review of Political Science, 10, pp. 271-96.
Bartkowska, M. and Tiemann, G. (2011) The Economy and the Vote in EP Elections. A Comparative and Dynamic Perspective. Paper prepared for presentation at the EUSA Twelfth
Biennial Conference, Boston.
Bellucci, P.B. and Lewis-Beck, M.S. (2011) A stable popularity function? Cross-national analysis. European Journal of Political Research, 50, pp. 190–211.
Belot, Céline (2002), Les logiques sociologiques de soutien au processus d’intégration européenne : éléments d’interprétation, Revue Internationale de Politique Comparée, vol.9 n°1, p.11-29.
Binegar, A.P. and Jolly, S.Y. (2005) Location, location, location. National contextual factors and public support for European integration. European Union Politics, 6, pp. 155-180. Bold, T., Garry, J. and Tilley, J. (2008) Perceptions and reality: Economic voting at the 2004 European Parliament elections. European Journal of Political Research, 47, pp. 665–686. Bovens, M. (2007) New Forms of Accountability and EU-Governance. Comparative
European Politics, 5, pp. 104–120
Brouard, S, Costa, O, König, T. (Eds.) 2012. The Europeanization of Domestic Legislatures.
The Empirical Implications of the Delors' Myth in Nine Countries, New York: Springer,
Studies in Public Choice, 244 p.
Cameron, C. A. and Trivedi, P. K. (2005) Microeconometrics: Methods and Applications. New York: Cambridge University Press.
Carey, S. (2002) Undivided Loyalties, Is National Identity an Obstacle to European Integration? European Union Politics, 3, pp. 387-413.
Christin T. (2005) Economic and Political Basis of Attitudes towards the EU in Central and East European Countries in the 1990s. European Union Politics, 6, pp. 29–57.
Christin T. and Hug S. (2002) Referendums And Citizen Support For European Integration.
Comparative Political Studies, 35, pp. 586-617.
Cichowski R. (2000) Western Dreams, Eastern Realities. Support for the European Union in Central and Eastern Europe. Comparative Political Studies, 33, pp. 1243-1278.
De Vreese, C.H. (2001) ‘Europe in the News’: A Cross-National Comparative Study of the News Coverage of Key EU Events, European Union Politics, Vol. 2 (3), pp. 1465-1165
De Vreese, C.H. and Kandyla, A. (2009) News Framing and Public Support for a Common Foreign and Security Policy. Journal of Common Market Studies, 47, pp. 453-481.
Dalton, R.J. and Eichenberg, R.C. (1993) Europeans and the European Community: The Dynamics of Public Support for European Integration. International Organizations, 47, pp. 507-534.
Dalton, R.J. and Eichenberg, R.C. (2007) Post-Maastricht Blues: The Transformation of Citizen Support for European Integration, 1973–2004. Acta Politica, 42, pp.128–152. Diez-Medrano, J.D. (2003) Framing Europe: Attitudes to European Integration in Germany,
Spain, and the United Kingdom. Princeton University Press.
Elgün O. and Tillman E.R. (2007) Exposure to European Union Policies and Support for membership in the candidate countries. Political Research Quarterly, 60, pp. 391-400.
Follesdal, A. and Hix, S. (2006) Why There is a Democratic Deficit in the EU: A Response to Majone and Moravcsik. Journal of Common Market Studies, 44, pp. 533–562.
Franklin, M. and Van Der Eijk, C. (1995) Referendum outcomes and trust in government: Public support for Europe in the wake of Maastricht. West European Politics, 18, pp. 101-117.
Franklin, M., Van Der Eijk, C. and Oppenhuis, E. (1996) “The Institutional Context:
Turnout”, in Franklin, M. and Van Der Eijk, C. Choosing Europe? The European Electorate
and National Politics in the Face of Union. The University of Michigan Press, pp. 306-331.
Gabel, M. and Palmer, H.D. (1995) Understanding Variation in Public Support for European Integration. European Journal of Political Research, 27, pp. 3–19.
Gabel, M., (1998) Public Support for European Integration: An Empirical Test of Five Theories. The Journal of Politics, 60, pp. 333-354.
Gabel, M. (1998) Economic Integration and Mass Politics: Market Liberalization and Public Attitudes in the European Union. American Journal of Political Science, 42, 936-953.
Gabel, M. and Whitten G. (1997) Economic Conditions, Economic Perceptions, And Public Support For European Integration. Political Behaviour, 19, pp. 81- 96.
Garry J. and Tilley J. (2009) The Macroeconomic Factors Conditioning the Impact of Identity on Attitudes towards the EU. European Union Politics 2009, 10, pp. 361
Glencross, A. and Trechsel, A. (2011) First or Second Order Referendums? Understanding the Votes on the EU Constitutional Treaty in Four EU Member States. West European Politics, 34, pp. 755-772
Gujarati D. (1970a) Use of Dummy Variables in Testing for Equality between Sets of Coefficients in Two Linear Regressions: A Note. American Statistical, 24, pp. 50-52. Gujarati D. (1970b) Use of Dummy Variables in Testing for Equality between Sets of Coefficients in Two Linear Regressions: A Generalization. American Statistical, 24, pp. 18-21.
Hix, S. and Marsh M. (2011) Second-order effects plus pan-European political swings: An analysis of European Parliament elections across time. Electoral Studies, 30, pp. 4–15. Hurwitz, J. and Peffley, M. (1987) How Are Foreign Policy Attitudes Structured? A Hierarchical Model. The American Political Science Review, 81, pp. 1099-1120
Herzog, A. and Tucker, J.A. (2010) The dynamics of support: the winners–losers gap in attitudes toward EU membership in post-communist countries. European Political Science Review, 2, pp. 235-267.
Hobolt S.B. and Tilley J. (2013) Who’s in Charge? How Voters Attribute Responsibility in the European Union, Comparative Political Studies, published online.
Hooghe, L. and Marks, G. (2001) Multi-Level Governance and European Integration, Governance in Europe Series. Rowman & Littlefield Publishing Group
Hooghe, L. and Marks, G. (2005) Calculation, Community and Cues, Public Opinion on European Integration. European Union Politics, 6, pp. 419-443
Hooghe, L. and Marks, G. (2009) A Postfunctionalist Theory of European Integration: From Permissive Consensus to Constraining Dissensus. British Journal of Political Science, 39, pp. 1-23.
König T., Dannwolf T., and Luetgert B. (2012) “EU Legislative Activities and Domestic Politics”, in Brouard, S, Costa, O, König, T. (Eds.) The Europeanization of Domestic
Legislatures. The Empirical Implications of the Delors' Myth in Nine Countries, New York:
Springer, Studies in Public Choice, 244 p.
Kramer, G.H. (1971) Short-Term Fluctuations in U.S. Voting Behavior, 1896-1964. American Political Science Review, 65, pp. 131-43.
Lewis-Beck, M.S. and Paldam, M. (2000) Economic voting: an introduction. Electoral Studies, 19, pp. 113–121.
Lewis-Beck, M.S. and Stegmaier M,. (2000) Economic Determinants of Electoral Outcomes, Annual Review of Political Science, 3, pp. 183-219.
Lewis-Beck, M.S. and Stegmaier M,. (2007) Economic Models of Voting. In Dalton, R. and Klingemann, H.D. (eds.) The Oxford Handbook of Political Behavior. Oxford: Oxford University Press, pp. 518-537.
Lewis-Beck, M. S. (2006) Does Economics Still Matter? Econometrics and the Vote. Journal of Politics, 68, pp. 208–212.
Magni Berton R. (2008) “Why do governmental parties lose second order elections? 2004 Eurobarometers data and European elections”, Revue française de science politique, 58(4): 643-56
Mclaren, M., L. (2002) Public Support for the European Union: Cost/Benefit Analysis or Perceived Cultural Threat? The Journal of Politics, 64, pp. 551-566.
Mclaren, L., M. (2007) Explaining Mass-Level Euroscepticism: Identity, Interests, and Institutional Distrust. Acta Politica, 42, pp. 233-251.
Paldam, M. (2008) Vote and Popularity Functions. In Rowley, C.K. and Schneider, F.G., (eds.). Readings in Public Choice and Constitutional Political Economy. New York: Springer, 533–550
Reif, K. and Schmitt, H. (1980) Nine second-order national elections: A conceptual framework for the analysis of European election results. European Journal of Political Research, 8, pp. 3–44.
Rohrschneider, R. (2002) The Democracy Deficit and Mass Support for an EU-Wide Government. American Journal of Political Science, 46, pp. 463-475.
Sánchez-Cuenca, I. (2000) The Political Basis of Support for European Integration. European Union Politics, 1, pp. 147-171
Schmitter, P. (2000) How to Democratize the European Union… And Why Bother? Lanham: Rowman and Littlefield.
Scheuer, A. and Schmitt, H. (2009) Sources of EU Support: The Case of Germany. German
Politics 18(4), pp. 577-90.
Sniderman, P., Brody, R. and Tetlock, P. (1991) Reasoning and Choice: Explorations in Political Psychology. New York, Cambridge University Press.
Tucker, J., A., Pacek., A., C. and Berinsky, A., J., 2002, Transitional Winners and Losers: Attitudes toward EU Membership in Post-Communist Countries. American Journal of Political Science, 46, pp. 555-571.
Tverdova, Y.V. and Anderson, C.J. (2004) Choosing the West? Referendum choices on EU membership in east-central Europe, Electoral Studies, 23, pp.185–208.
Vachudova, M. (2008) Tempered by the EU? Political parties and party systems before and after accession. Journal of European Public Policy, 15, pp. 861-879.
Veiga, F.V. and Veiga, L.G. (2004) Popularity functions, partisan effects, and support in Parliament. Economics & Politics, 16, pp. 101–115.
Figure 1: Average support for the EU in countries which joined in 2004 (%) 56.06 57.59 64.11 0 2 0 4 0 6 0 8 0 % o f re s p o n d a n ts 2001 2002 2003 10 countries integrated in 2004 Before membership 57.07 64.09 65.80 0 2 0 4 0 6 0 8 0 % o f re s p o n d a n ts 2005 2006 2007 10 countries integrated in 2004 After membership
Support measured through the question “Do you think that your country's membership of the
European Union would be a good thing?” within countries which entered the EU in 2004:
Cyprus, Malta, Czech Republic, Estonia, Hungary, Latvia, Lithuania, Poland, Slovenia and Slovakia.
Figure 2: Detailed support for the EU in countries which joined in 2004 (%)
4 0 6 0 8 0 1 0 0 4 0 6 0 8 0 1 0 0 4 0 6 0 8 0 1 0 0 4 0 6 0 8 0 1 0 0 2001 2002 2003 2004 2005 2006 2007
Cyprus Czech Republic Estonia
Hungary Latvia Lithuania
Malta Poland Slovakia
Slovenia S u p p o rt t o E U ( % o f re sp o n d a n ts)
Support measured through the question “Do you think that your country's membership of the
European Union would be a good thing?” 2004 is not considered
5 1 0 1 5 2 0 5 1 0 1 5 2 0 5 1 0 1 5 2 0 5 1 0 1 5 2 0 2001 2002 2003 2004 2005 2006 2007
Cyprus Czech Republic Estonia
Hungary Latvia Lithuania
Malta Poland Slovakia
Slovenia A n n u a l ra te o f u n e m p lo y m e n t
Source : Eurostat, 2004 is not considered
Figure 4: Inflation rate in 10 countries which joined in 2004 (%)
0 5 1 0 0 5 1 0 0 5 1 0 0 5 1 0 2001 2002 2003 2004 2005 2006 2007
Cyprus Czech Republic Estonia
Hungary Latvia Lithuania
Malta Poland Slovakia
Slovenia A n n u a l ra te o f in fl a ti o n
Figure 5: Predicted probability of support for the EU and unemployment (%) 0 .2 .4 .6 .8 1 P ro b a b ili ty o f E U s u p p o rt 2 4 6 8 10 12 14 16 18 20 Unemployment rate
Predicted probability 95% lower limit 95% upper limit
Probabilities are estimated using the complete model, other variables equal its average values
Before membership 0 .2 .4 .6 .8 1 P ro b a b ili ty o f E U s u p p o rt 2 4 6 8 10 12 14 16 18 20 Unemployment rate
Predicted probability 95% lower limit 95% upper limit
Probabilities are estimated using the complete model, other variables equal its average values
After membership
Figure 6: Predicted probability of support for the EU and inflation (%)
0 .2 .4 .6 .8 1 P ro b a b ili ty o f E U s u p p o rt -2 0 2 4 6 8 10 12 Inflation rate
Predicted probability 95% lower limit 95% upper limit
Probabilities are estimated using the complete model, other variables equal its average values
Before membership 0 .2 .4 .6 .8 1 P ro b a b ili ty o f E U s u p p o rt -2 0 2 4 6 8 10 12 Inflation rate
Predicted probability 95% lower limit 95% upper limit
Probabilities are estimated using the complete model, other variables equal its average values
Table 1: Estimations of support for the EU before and after 2004 (%)
Before membership (2001 2002 2003) After membership (2005 2006 2007)
Independent variables coef (se) coef (se) coef (se) coef (se) coef (se) coef (se)
Annual average unemployment rate 0,07 (0,071) 0,062 (0,059) - -0,078 ** (0,025) -0,096 ** (0,031) -
Annual average inflation rate 0,016 (0,043) - 0,002 (0,039) -0,062 ** (0,027) - -0,087 ** (0,03)
General satisfaction with life:
Very satisfied ref ref ref ref ref Ref
Relatively satisfied -0,267 ** (0,095) -0,268 ** (0,095) -0,27 ** (0,095) -0,236 *** (0,035) -0,234 *** (0,034) -0,236 *** (0,034)
Not really satisfied -0,991 *** (0,144) -0,992 *** (0,144) -0,989 *** (0,144) -0,894 *** (0,087) -0,891 *** (0,087) -0,899 *** (0,086)
Not at all satisfied -1,491 *** (0,162) -1,491 *** (0,162) -1,488 *** (0,163) -1,328 *** (0,105) -1,325 *** (0,105) -1,336 *** (0,106)
Frequence of political discussion:
Frequently ref ref ref ref ref Ref
Occasionally -0,134 ** (0,049) -0,134 ** (0,049) -0,133 ** (0,049) -0,082 * (0,042) -0,081 * (0,042) -0,081 * (0,043)
Never -0,516 *** (0,058) -0,515 *** (0,059) -0,512 *** (0,057) -0,396 *** (0,069) -0,395 *** (0,07) -0,393 *** (0,071)
Frequence of entourage’s persuasion:
Often ref ref ref ref ref Ref
Occasionally -0,017 (0,043) -0,017 (0,043) -0,015 (0,044) 0,054 (0,043) 0,051 (0,042) 0,055 (0,043)
Rarely -0,098 * (0,056) -0,099 * (0,056) -0,097 * (0,057) 0,005 (0,054) 0,004 (0,054) 0,004 (0,055)
Never -0,243 ** (0,07) -0,244 *** (0,07) -0,244 *** (0,07) -0,162 ** (0,057) -0,163 ** (0,056) -0,162 ** (0,058)
Marital situation (in a relationship) -0,051 (0,037) -0,052 (0,037) -0,05 (0,037) -0,071 ** (0,035) -0,069 * (0,035) -0,073 ** (0,035)
Age when leaving school :
Under 15 years ref ref ref ref ref Ref
Between 16 and 19 years 0,278 *** (0,06) 0,278 *** (0,06) 0,276 *** (0,059) 0,27 *** (0,044) 0,27 *** (0,044) 0,27 *** (0,044)
Over 20 years 0,544 *** (0,061) 0,545 *** (0,06) 0,544 *** (0,06) 0,557 *** (0,073) 0,557 *** (0,072) 0,556 *** (0,073)
Still studying 0,585 ** (0,181) 0,585 ** (0,181) 0,59 ** (0,182) 0,452 ** (0,155) 0,453 ** (0,156) 0,451 ** (0,155)
Does not know -0,012 (0,211) -0,016 (0,207) -0,016 (0,202) 0,012 (0,128) 0,013 (0,128) 0,011 (0,127)
15 - 24 years ref ref ref ref ref Ref
25 - 39 years -0,225 *** (0,048) -0,225 *** (0,048) -0,224 *** (0,048) -0,072 (0,101) -0,071 (0,101) -0,071 (0,101)
40 - 54 years -0,248 ** (0,096) -0,247 ** (0,096) -0,248 ** (0,096) -0,173 (0,119) -0,169 (0,118) -0,172 (0,119)
More than 55 years -0,326 ** (0,145) -0,325 ** (0,146) -0,326 ** (0,145) -0,189 (0,154) -0,184 (0,154) -0,188 (0,153)
Missing -0,569 *** (0,149) -0,573 *** (0,149) -0,573 *** (0,15) 0,754 *** (0,208) 0,751 *** (0,212) 0,729 *** (0,186)
Real-estate ownership 0,09 * (0,05) 0,09 * (0,049) 0,093 * (0,048) 0,08 (0,068) 0,077 (0,069) 0,083 (0,067)
Living area :
Rural ref ref ref ref ref Ref
Small towm 0,213 *** (0,052) 0,213 *** (0,053) 0,212 *** (0,052) 0,053 (0,058) 0,051 (0,059) 0,054 (0,058)
Urban 0,347 *** (0,081) 0,347 *** (0,082) 0,349 *** (0,081) 0,054 (0,099) 0,052 (0,1) 0,055 (0,1)
Missing 0,239 (0,338) 0,237 (0,343) 0,232 (0,336) -0,237 (0,225) -0,247 (0,22) -0,218 (0,216)
Professional status :
Entrepreneur ref ref ref ref ref Ref
Manager 0,195 * (0,106) 0,194 * (0,105) 0,196 * (0,106) 0,108 * (0,058) 0,108 * (0,057) 0,11 * (0,058) White-collar 0,008 (0,153) 0,007 (0,152) 0,007 (0,153) -0,123 ** (0,053) -0,125 ** (0,054) -0,118 ** (0,055) Manual worker -0,156 (0,128) -0,157 (0,128) -0,156 (0,128) -0,219 *** (0,022) -0,222 *** (0,024) -0,214 *** (0,024) Homeworker -0,033 (0,138) -0,033 (0,138) -0,033 (0,137) -0,187 ** (0,058) -0,189 ** (0,058) -0,186 ** (0,057) unemployed -0,071 (0,123) -0,072 (0,123) -0,069 (0,124) -0,232 *** (0,057) -0,231 *** (0,056) -0,238 *** (0,056) Retired -0,185 (0,136) -0,186 (0,136) -0,184 (0,136) -0,232 ** (0,071) -0,233 ** (0,072) -0,232 ** (0,072) Missing 0,097 (0,179) 0,096 (0,18) 0,093 (0,179) - - - Sex -0,136 ** (0,043) -0,136 ** (0,043) -0,135 ** (0,042) -0,105 *** (0,029) -0,104 *** (0,029) -0,107 *** (0,029) Constant 1,252 ** (0,558) 1,355 ** (0,425) 1,606 *** (0,319) 0,625 ** (0,249) 0,637 ** (0,313) 0,177 (0,231) N Pseudo-R² Pseudo log-likehood 26,534 0.11 -15,872 26,534 0.11 -15,872 26,534 0.11 -15,873 27,342 0.09 -16,382 27,342 0.09 -16,390 27,342 0.09 -16,396 The standard-errors are corrected by the cluster method (see Cameron and Tiverdi, 2006).
Coefficients are statistically significant at * 0.1, ** 0.05 and *** 0.01
Table 2: Sample description by country and year
Nb of obs. Pre-membership period Post-membership period Total
Year countries 2001 2002 2003 2005 2006 2007 Cyprus 500 500 500 505 503 502 3010 Czech Republic 1000 1000 1000 1083 1091 1043 6217 Estonia 1008 1000 1006 1001 1000 1005 6020 Hungary 1024 1015 1015 1014 1005 1006 6079 Latvia 1000 1000 1002 1015 1015 1013 6045 Lithuania 1000 1008 1022 1003 1000 1018 6051 Malta 532 500 500 500 500 500 3032 Poland 1000 1000 1000 1000 1000 1000 6000 Slovakia 1010 1123 1035 1108 1023 1106 6405 Slovenia 1003 1000 1000 1045 1031 1013 6092 Total 9077 9146 9080 9274 9168 9206 54951
Table 3: Change with time of the detailed response to the support of EU (%).
Pre-membership period Post-membership period Total
answer 2001 2002 2003 2005 2006 2007 A good thing 4200 (51,29 %) 4418 (52,95 %) 5034 (59,11 %) 4412 (49,18 %) 4750 (53,06 %) 4876 (54,15 %) 27690 (50,33 %) Neither good or bad 2925 (35,72 %) 2789 (33,43 %) 2632 (30,9 %) 980 (10,92 %) 955 (10,67 %) 977 (10,85 %) 11258 (21,66 %) A bad thing 1063 (12,98 %) 1136 (13,62 %) 851 (9,99 %) 3580 (30,99 %) 3247 (36,27 %) 3151 (35 %) 13028 (25,07 %) missing 889 (9,79 %) 803 (8,78 %) 563 (6,2 %) 302 (4,99 %) 216 (2,36 %) 202 (2,19 %) 2975 (9,91 %) total 9077 (100 %) 9146 (100 %) 9080 (100 %) 6052 (100 %) 9168 (100 %) 9206 (100 %) 54951 (100 %) “Do you think that your country's membership of the European Union would be (is) …?”