Unveiling the end-user viewport resolution from encrypted video traces
Texte intégral
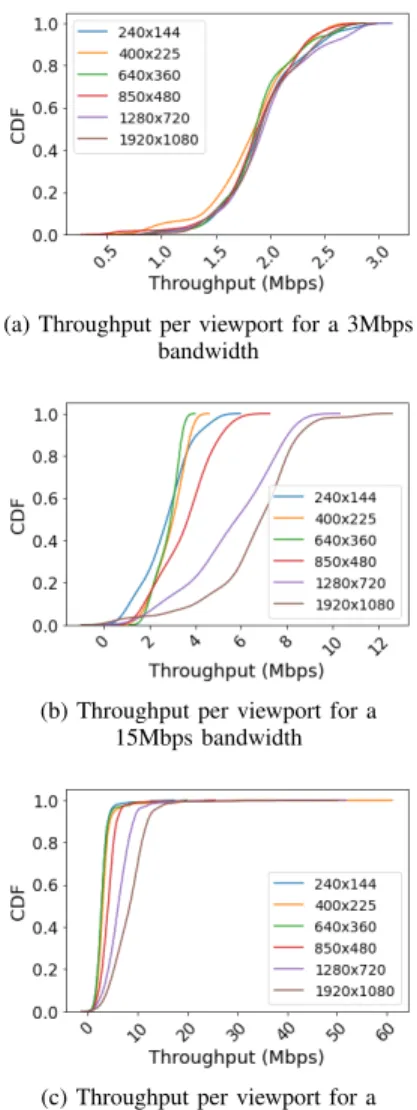
Figure
Documents relatifs
What these similar technologies lack is the personal feedback loop be- tween the end user and the technology, where the personal assistant adapts to the end user and the
Unité de recherche INRIA Rennes : IRISA, Campus universitaire de Beaulieu - 35042 Rennes Cedex (France) Unité de recherche INRIA Rhône-Alpes : 655, avenue de l’Europe - 38334
“[m]ore so than any other American author of the twentieth century, Pynchon documents in fiction the tectonic movements of American history, to the extent that
This article presents best practices for the design of a user-centric approach in accessibility research projects, taking two European projects as an example:
Comme le suggère Laurent Siproudhis d ’ emblée dans le titre de son dernier éditorial pour la revue Colon & Rectum (vous noterez en passant la grande souplesse d ’ esprit de
To match the requirements defined above, a supportive user interface should hide the complexity of the interaction space (various sensors gathering information about the
We present a web application that allows users to reuse RDF content from existing sites (e.g., DBpedia), extract data from the social networks like Facebook and Twitter, and
Interpreters are not always familiar with Asian culture and working with the Asian community, therefore often unable to understand the full cultural implication of the BME deaf person
