HAL Id: hal-02435148
https://hal.uca.fr/hal-02435148
Submitted on 20 Nov 2020
HAL is a multi-disciplinary open access archive for the deposit and dissemination of sci-entific research documents, whether they are pub-lished or not. The documents may come from teaching and research institutions in France or abroad, or from public or private research centers.
L’archive ouverte pluridisciplinaire HAL, est destinée au dépôt et à la diffusion de documents scientifiques de niveau recherche, publiés ou non, émanant des établissements d’enseignement et de recherche français ou étrangers, des laboratoires publics ou privés.
Copyright
Multi-stage growth of the trachytic lava dome of the
Puy de Dôme (Chaîne des Puys, France). Field,
geomorphological and petro-geochemical evidence
Catherine Deniel, Pierre Boivin, Didier Miallier, Marie-Christine Gerbe
To cite this version:
Catherine Deniel, Pierre Boivin, Didier Miallier, Marie-Christine Gerbe. Multi-stage growth of the trachytic lava dome of the Puy de Dôme (Chaîne des Puys, France). Field, geomorphological and petro-geochemical evidence. Journal of Volcanology and Geothermal Research, Elsevier, 2020, 396, pp.106749. �10.1016/j.jvolgeores.2019.106749�. �hal-02435148�
1 Multi-stage growth of the trachytic lava dome of the Puy de Dôme (Chaîne des Puys, France). Field, geomorphological and petro-geochemical evidence.
C. Deniel1*, P. Boivin1, D. Miallier2, M.C. Gerbe3
1
Université Clermont Auvergne, CNRS, IRD, OPGC, LMV, F-63000 Clermont-Ferrand, France
2
Université Clermont Auvergne, CNRS–IN2P3, LPC, F-63000 Clermont-Ferrand, France 3
Université de Lyon, UJM-Saint–Etienne, CNRS, LMV, F-42023 St Etienne, France * Corresponding author. E-mail address: deniel@opgc.univ-bpclermont.fr
UMR 6524 Laboratoire Magmas et Volcans, Campus Universitaire des Cézeaux, 6 Avenue Blaise Pascal, TSA 60026 - CS 60026, 63178 Aubière cedex, France
Abstract
Understanding lava dome eruptions is a major concern in volcanology regarding the assessment of associated hazards. This question is usually addressed through the study of active calc-alkaline domes, however, alkaline domes remaining poorly known. The Puy de Dôme is the most prominent volcano of the Chaîne des Puys Quaternary intraplate volcanic field in the French Massif Central. It is a complex trachytic lava dome ca. 11 ka old. Field investigations, geomorphological and petro-geochemical studies were performed to understand the magmatic system of this dome and reconstruct its volcanic evolution. The different lava facies were fully characterised and their relationships with the volcano building stages have been established. A new four-step evolution is proposed for the growth of this edifice. Mineralogical and geochemical variations document magmatic differentiation with self-mixing and minor crustal contamination in a zoned reservoir within the upper crust. Magma mixing and crustal contamination through fluids interactions during magma ascent and the involvement of fumarolic activity throughout the edifice building are also documented. Further, this work highlights the specific features of the Puy de Dôme compared to calc-alkaline domes: lack of lava flows and almost complete magma degassing during ascent, resulting in the lack of significant explosive activity until the last eruption step.
2
Keywords
Trachytic lava dome; petro-geochemical evidence; zoned magma reservoir; multi-stage growth; Puy de Dôme volcano; French Massif Central.
1. Introduction
Understanding lava dome eruptions, commonly associated to hazardous phenomena, is a major concern in volcanology. Thus, numerous studies were performed to characterise (1) the associated magmas through their viscosity, vesicularity, crystal and volatile contents and (2) address the role of these parameters regarding the dynamics of magma ascent in conduits, extrusion style of magma and effusion rates, and eruptive dynamics which are key factors controlling the formation and evolution of lava domes and their eruptive behavior (e.g., Sparks, 1997; Fink and Griffiths, 1998; Sparks et al., 2000; Watts et al., 2002; Neuberg et al., 2006; Hale and , 2007; Hale and Wadge, 2008; Burgisser et al., 2010, 2011; Husain et al., 2014; 2018 and references therein). These studies, including analog experiments and numerical modelling, have outlined the high complexity of these magmatic systems and associated eruptions. Magma's initial characteristics and degassing-induced crystallisation during magma ascent have especially been identified as key processes regarding the evolution and eruptive behavior of these domes. The mechanisms associated with lava dome eruptions are usually addressed through the study of calc-alkaline domes as these are numerous, long-lived, active and often under monitoring, but not through the studies of extinct monogenetic alkaline domes. Nevertheless, thanks to their simpler magmatic history, associated with a small magma chamber which operated only once (e.g., Eichelberger et al., 1984), alkaline domes are potentially able to bring valuable constraints to the understanding of dome-building eruptions.
The Puy de Dôme (PdD, hereafter), a trachytic lava dome, is the highest (1,465 m a.s.l.) volcano (Figure 1) of the Chaîne des Puys (CdP, hereafter), the most recent intraplate Quaternary volcanic field of the French Massif Central (e.g., Boivin and Thouret, 2014; Boivin et al., 2017 and references therein). As an isolated edifice almost in the centre of the CdP, PdD is catching attention 100 km around and has attracted scientists' attention for a long time. In his pioneering work, Guettard (1752) first mentioned the existence of extinct volcanoes in Auvergne. He immediately identified PdD as a volcano through the nature of its
3
rocks but its shape (Figure 1) was still enigmatic. Indeed, it was not fitting with the standard model of volcanoes used at that time: a scoriaceous cone with a crater, possibly associated with a lava flow. Over more than one century, a vigorous controversy persisted among various authors (Guettard versus Garmage [Mergoil and Mergoil, 2014]; Montlosier, 1788; von Buch, 1802; Ramond, 1815; Poulett Scrope, 1827; Lecoq, 1867; Michel-Lévy, 1890), each one defending more or less fanciful propositions to simultaneoulsy account for the shape of the volcano, the nature of its lavas and the presence of similar deposits over tens of km2 around. The authors who first suggested models presaging present-day concepts were Poulett Scrope (1827) and Michel-Lévy (1890). Poulett Scrope first developed a model of protrusion for Sarcoui (Figure 2a), another trachytic dome of the CdP, based on its regular shape, and then extended it to PdD because of their similarity. Michel-Lévy (1890) evoked superficial laccoliths or surface intrusive rocks while observing that the viscous lava forms the core of the edifice sheathed by projections, themselves pushed away and lifted up by the lava. A strong conceptual change was brought by Lacroix witnessing the 1902 eruption of the Montagne Pelée in Martinique and making the link with the PdD (Lacroix, 1904). He identified the Pelean part of PdD dome and a blanket of Vulcanian projections, with the implications of such a dome terminology in terms of eruptive dynamics (Lacroix, 1908). The vent of these Vulcanian deposits was localised at the foot of the PdD (Glangeaud, 1913), and these deposits were later attributed to Cratère Kilian (Camus, 1975), another trachytic volcano (Figure 2). Further, on the basis of detailed field work, Glangeaud applied Lacroix's model to the other trachytic volcanoes of the CdP. Finally, to account for the PdD asymmetry, Camus (1975) complicated the Pelean model by suggesting a resumption of growth after a sectorial collapse of the initial dome.
4
Figure 1 Puy de Dôme volcano, looking NE with a maximum elevation of 1,465 meters above sea level (a.s.l.), hereafter all elevations are given in meters a.s.l.
(© P. Boivin, 2010)
The layout works at PdD as from 2000-2012 and the local authority's wish to register this place as a "Grand site" and then the "Chaîne des Puys - Faille de Limagne" as a UNESCO World Heritage Site gave new opportunities for observations of the PdD deposits. At the same time, PdD volcano was the focus of geophysical studies: gravimetry, magnetism, 3D electrical imaging (Portal et al., 2016; 2019). It was also chosen as a volcano laboratory for the development of the muonic imagery method (Carloganu, 2018). Our investigations, strongly motivated by the growing interest in dome-building eruptions since Soufrière Hills eruption at Montserrat in 1997 (see references above), took place in this context of renewed interest for this trachytic dome.
Our extensive field work combined with resampling and detailed petrological, mineralogical and geochemical studies was aimed at precisely characterising, for the first time, the lava facies related to the various phases of edification of this lava dome. The eruptive chronology of the volcano and the extent and characterisation of the products (both massive rocks and pyroclastic deposits) associated to each phase have been totally reevaluated. Combined with a high-resolution digital elevation model (DEM, hereafter) plus recent geophysical models, these results allow us to propose a largely renewed scenario for the eruption of this volcano. These results also put new constraints on both magma chamber and conduit processes associated to this monogenetic volcano, as well as its eruptive dynamics that can be compared to those available on complex stratovolcanoes from subduction settings.
2. The Chaîne des Puys volcanic field
The volcanism of the French Massif Central has been interpreted as the result of lithospheric thinning due to the Alpine subduction (Eocene-Oligocene) followed by thermal erosion (Upper Miocene-Present) by hot asthenospheric material pushed aside owing to the Alpine continent-continent collision (Zeyen et al., 1997; Merle and Michon, 2001; Babuska et al., 2002). The CdP approximatively built up between 90 ka and 8.6 ka (Boivin et al., 2017). It is composed of about eighty volcanoes lining up on the Plateau des Dômes, an uplifted Variscan basement block separated from the Limagne graben (mainly of Oligocene age) by a steep
5
north-south trending escarpment, the Limagne fault (Figure 2). The monogenetic volcanic centres (e.g., Nemeth and Kereszturi, 2015; for a discussion of this concept) display a variety of types which include scoria cones accompanied by lava flows, maars, lava domes, and up-heaved plugs. Lavas range from basalts to rhyolites in composition (IUGS classification) and define a series of magmatic differentiation (Bentor, 1954; Batard, 1974). The process of differentiation has been explained by the fractional crystallisation of an alkaline, weakly potassic basalt (Camus, 1975; Maury et al., 1980a; Villemant et al., 1980; Foury, 1983; Boivin et al., 2017). Foury (1983) and Gourgaud and Camus (1984) suggested that differentiation ultimately occurred within intermediate crustal level reservoirs. On the basis of petrological data obtained on CdP trachytes and experimental products from phase equilibria, Martel et al. (2013) refined this model for the trachytic plumbing system of the CdP. They suggested that these intermediate crustal level reservoirs are located between 8 and 16 km depth, and installed in discontinuities of the network of Variscan faults reactivated during the Neogene.
6
Figure 2 Map of the Chaîne des Puys
(a) Simplified volcanological map modified after Boivin et al. (2017). Red box refers to insert enlarged map (b).
3. PdD volcano and its geological setting
In plan view, PdD has an elliptic shape with a long EW axis and a short NS axis (Figure 2b), measuring about 3,260 and 1,670 m, respectively. The areal extent of PdD was largely
7
defined after field work but also strongly benefited from the bottom railway station and car parks buildings which required scrapping of large land areas.
The local basement displays a pronounced asymmetry with a gentle (2.5%) pre-volcanic slope toward the west and a steeper (about 4.5%) slope toward the east. Besides, the eastern edge of the plateau is deeply incised by valleys connecting it to the local base level defined by the Limagne graben, at 300 m. Thereby, the basement in the upper part of the Tiretaine valley (Figure 2a), which is opening on the eastern side of PdD, has been identified by drillings and boreholes (Boivin et al., 2017) at 50-70 m depth just at the foot of the eastern flank of the volcano. This basement consists of various units: the Aubusson anatexites, two micas microgranite dykes including the Manson leucogranite, the Royat granite, Visean hornfelses and the Enval syeno-diorite (Jeambrun et al., 1973 and references therein), the two last units being also encountered as xenoliths in the Kilian (Figure 2) deposits. On the western side, valleys are less incised but their lava filling is thicker (90 m at the Bac de Montmeyre drilling site, Figure 2a). Interpolating data available (outcrops, drillings, and boreholes) on basement elevation around PdD allowed us to put it at about 870 m a.s.l. at the vertical of PdD summit. Data also suggest that PdD stands on a former ridge between the two valleys containing the Tiretaine lava flow to the east and the Mazayes (Figure 2a) lava flow to the west. This ridge would slope gently from 920 m under Puy de Grosmanaux to 860 m under Petit Puy de Dôme (Figure 2b) but the lack of close data on the northern side of PdD results in some uncertainty on these values. The openings toward these two opposite valleys account for the EW elongation of the PdD. On the other hand, the pre-existing Strombolian cones of Puy Redon, Cornebœ f , Cre x de Berte and Petit Puy de Dôme (Figure 2b) have limited PdD extension toward the north and south.
PdD does not stand directly on the Variscan basement as indicated by the presence of older volcanic units (cones and lava flows) at its periphery and basaltic xenoclasts brought to the surface during a late minor summit eruption (Miallier et al., 2010). Parts of buried cones were also inferred from geophysical data and the thickness of the underlying lava flows was estimated at about 100 m (Portal et al., 2016; 2019), outlining that the present apparent volume of the dome is misleading. Consequently, the elevation of PdD edifice above its local substratum may be estimated at 500 to 550 m, with a total volume of the order of 0.2 km3.
8
The DEM and tools of quantitative geomorphology (Figures S1 and S2 in Supplementary Information A) allow to determine the main geomorphological units of PdD and their mutual relationships (see details in Supplementary Information A). Four distinct types of geomorphological units were identified: (1) a "dome" shaped constructional landform, (2) the "Eastern Unit" constructional landform, (3) four "aprons" corresponding to typical destructional landforms, and (4) two "pathways" (N.E. and S.) incising the edifice from the summit plateau, and most probably settled in two destructional landforms (Figure 3).
Figure 3 Geomorphological units of the PdD labeled on the high resolution (0.5 m) DEM (LidArverne/CRAIG - GeoPhenix – 2011) of the center of the CdP.
Four types of geomorphological units are shown: dome, Eastern Unit, aprons (four), and pathways (two). Note also, in close proximity to the dome shape, the three rounded reliefs (P y Redon, Petit P y de Dôme nd cone of Cornebœ f ), p rt y b ried nder the edifice (see Supplementary Information A for more details).
9
5. Volcanic units
Combining field observations and geophysical data, the geomorphological units described above can be ascribed to specific volcanic units.
The morphological "dome" consists of the western part of the volcanic dome which is made of massive porphyritic lavas forming cliffs, spines and spurs.
The morphological "Eastern Unit" corresponds to the Eastern Unit (EU, hereafter) deposits, composed of uniform, consolidated but friable ash, locally embedding blocks of porphyritic lava. This eastern formation is probably not significantly thicker than about 5-15 m, as suggested by outcrops exposed in a long southern radial gully, on the eastern side of the south pathway (Figure 3). Morphologically, it looks younger than the neighbouring formations. On the basis of the DEM and considering a similar extent of the dome on both the eastern and western sides of the volcano, the total volume of this EU deposits is estimated at about 0.007 km3, that is, 3.5 vol % of the whole edifice.
The stratigraphy of the summit of the dome is now qualitatively well known. Its original surface is rough and chaotic and composed of massive trachytic lava blocks of various size wrapped by white, grey, red or yellowish ashes and lapilli. This surface is locally coated by a very thin (5-10 mm) soil, itself covered by a few tens of centimeters thick layer of trachytic ashes and lapilli mixed with xenoliths. This layer (the CR formation) was deposited by a late summit eruption, about three centuries after the dome building (Miallier et al., 2010). A soil has developed in its upper part and is covered by the Kilian pyroclastic unit (Colombier et al., 2017). This unit dated at ca. 9.4 ka (Miallier et al., 2012) is mostly composed of amphibole-biotite trachyte and corresponds to the Vulcanian deposits of Lacroix (1908). It is typically about 1 m thick and coated by the present-day top soil.
A broadly similar sequence is observed on the flanks of the dome wherever it has been preserved from erosion and makes the superficial layers of the "aprons" geomorphological unit. The loose deposits forming the main part of this last morphological unit are observable in ancient quarries (Figure 2b) and in recent excavations. They can be thick (> 10 m) and are mainly composed of trachytic boulders of various size (up to a few m3) embedded in ash and lapilli (Figure 4). These deposits do not display any stratification or grain size sorting that would be indicative of pyroclastic flow, pyroclastic fall, scree or colluvial deposits and they do not extend further than the bottom of the edifice. Besides, no pyroclastic flow in the surroundings of the PdD can be attributed to it. These deposits are thus considered as block
10
and ash flow (BAF) deposits, generated by occasional and small-scale gravitational collapses during the growth of the edifice. Evidence of explosive activity was observed only once as a bomb sag in a thin stratified pyroclastic deposit.
Figure 4 PdD BAF deposits
Outcrop in the ancient quarry located SE of the PdD (Figure 2b). (© A. Gourgaud)
A specific trachytic deposit of PdD type is also observed on various outcrops on the Petit Puy de Dôme (Figures 2b and 5). It forms a sequence of light coloured layers interbedded in the trachybasaltic tuffs of the Nid de la Poule maar (Lafleur, 2006; Fouillant-Bergeat, 2006), itself related to a slightly younger episode than PdD (ca. 10 ka, Miallier et al., 2012). 90% of these light coloured particles consist of volcanoclasts having a grain size smaller than 250 µm. The sequence has a thickness of 10 cm. This deposit, finely stratified and sometimes beveled, consists of a white to yellowish mix of trachytic lava or minerals and mafic lava in various proportions (Figure 5).
11
Figure 5 Photograph of the Nid de la Poule outcrop on Petit Puy de Dôme volcano
White trachytic fine grain deposits interbedded in the brown trachybasaltic tuffs of the Nid de la Poule (NP) maar (Figure 2b). The main layers are outlined.(© D. Miallier, 2006)
6. Inner structure of the volcano
Some features of the inner structure of the dome can be inferred from field observations. The dome is certainly intensely intruded as documented on its outside surface outcrops by trachytic dykes exhibiting evidence of mechanical deformation and separated by septa of breccia and ash. Besides, an important network of fractures has given way to fumaroles up to the surface. The upper part of the dome displays, often along fissures, many yellow or red stains (Figure 6) or fully bleached rocks, resulting from fumarolic alteration. Large hematite crystals are also present in open fissures. The existence of fractures also probably favoured the late summit eruption (Miallier et al., 2010). Fractures also facilitate the penetration of rain, thereby favouring the alteration of the trachyte. Alteration of the dome at depth is documented by the abundance of fumarolised lapilli in the late summit eruption deposits (CR formation). Comprehensive geophysical surveys of the whole volcano and its surroundings were performed by means of four distinct methods, namely electrical resistivity tomography (ERT), gravimetry, magnetometry (Portal et al., 2016; 2019) and muography (Ambrosino et al., 2015). The results indicate that the dome, built on pre-existing scoriaceous cones, is highly heterogeneous at various scales and suggest that its core is significantly altered.
12
Figure 6 Field photograph illustrating the fumarolic activity along a fissure
The outcrop was located along the road leading to PdD summit, before reaching the upper cog railway station. The symmetric colour zonation on each side of the fissure illustrates the macroscopic changes of the trachyte in relation to fumarolic activity along the fissure.
(© P. Boivin, March 18th 2011)
7. Chronology
The dome construction was dated by thermoluminescence (Faïn et al., 1988), 230Th-238U radioactive disequilibrium (Condomines, 1997) and radiocarbon (Miallier et al., 2010). In this study, two new 14C dates, 9,555 ± 45 BP and 9,540 ± 45 BP, were obtained (Table S1) on mm-sized charcoal fragments sampled in the BAF deposits at the southern base of the dome. Combining these new data with the previous ones, by means of a Bayesian approach which includes 14C calibration (Lanos et al., 2015), an age of 11.0 ± 0.2 ka was obtained for the dome construction, the mean age of the late summit eruption being estimated at 10.70 ± 0.15 ka (Miallier et al., 2010).
13
8. Sampling and analytical techniques
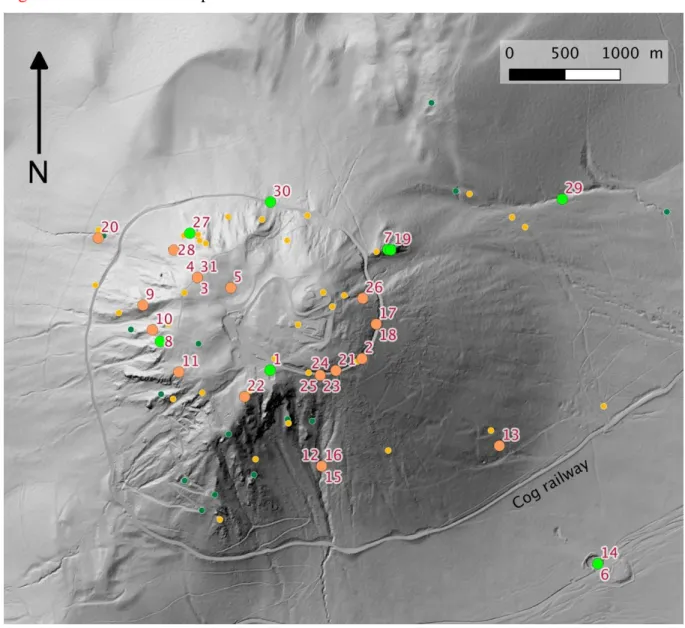
The formations identified above were sampled all around the volcano (over 200 samples,
Figure 7) and analysed in thin section.
Various measurements were performed on many samples from this set (Supplementary Information C): connected porosity and density, modal analyses (Table S2), electron probe microanalyses and Raman analyses, major elements and radionuclide measurements (Table S3).
However, the present study is mainly focused on a smaller set of 30 samples that were analysed more specifically for trace elements, and Sr, Nd and O isotopes (see analytical procedures in Supplementary Information C and Table S4). These samples are located in
Figure 7 with a short description in Table 1.
14
Orange dots: bi-trachytes; green dots: cpx-trachytes. The bigger dots refer to the 30 samples more specifically analysed for geochemistry and isotopes. The associated numbers refer to the "index" numbers in Table 1. Note that cpx-trachytes are more abundant in the SW, absent in the SE and randomly distributed in the N of the volcano.
The 31 selected samples encompass the main groups of rocks identified on the basis of our field and petrographic investigations. They were analysed [some of them from Sforna (2008)] in order to better characterise the different trachytic facies. Bearing in mind that fumarolic activity largely affected the edifice, some conspicuously fumarolised samples were also analysed to assess the possible effect of these processes on the geochemical variations observed among apparently unaltered trachytes.
Bi-trachytes were sampled (1) on massive outcrops of the dome (C928, C931, PB1, PB2 and PB4), (2) as several-m sized blocks in the EU deposits (DM2, DM3, DM6 and 1105-2), (3) as decimeter-sized blocks (DM5) plus lapilli (C511, PB7, C511a and C663) in the pyroclastites of the CR formation, and finally (4) as lithic elements dispersed in a very fine grained matrix (DM1, C949 and C950) in the EU deposits. On the other hand, cpx-trachytes were sampled both on massive outcrops of the dome (DM4, C882, C915, PB3 and 1103-02) and as blocks (C806, C951, C963, PB5, and PB6) in the BAF deposits. The fumarolised samples consist of ashy samples from the EU deposits (PB15-1210-1, PB15-1210-2 and PB15-1210-3), located only a few centimeters apart from each other and close to a fissure, and a bi-trachyte with silicified biotite and groundmass (C943) from the dome.
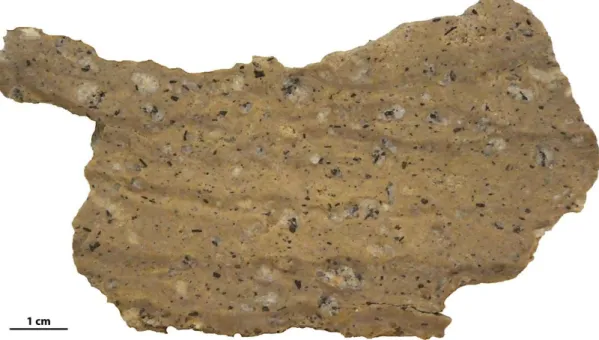
The PB5 cpx-trachyte exhibiting unusual banded features was studied in more detail. The light (PB5C) and dark (PB5F) facies were separated by handpicking, but only grossly because of the intricate texture of the whole rock (WR) sample (Figure 8) preventing a better separation to be achieved. These two sub-samples were then crushed (about 200 g of gravels for each) and analysed separately, in addition to the bulk sample.
Most of these 31 samples were large (1 to 2 kg) and macroscopically fresh. After removing their external parts, these samples were cut and crushed (jaw crusher and then agate mill on a quarted fraction of gravels). Exceptions are represented by the sub-samples described above and the lapilli of the CR formation for which much less material was available. Indeed, the initial amount of material for C511 and C663 was about 700 g and 150 g, respectively. Besides, these lapilli were not as fresh as the other samples. Samples were sieved and the lapilli selected among the largest and freshest, in the 8-16 mm and 16-32 mm fractions for C511 and in the 8-32 mm fraction for C663. Three such sets of lapilli (C511, PB7 and
15
C511a), resulting in 15-30 g of powder each, were analysed for C511 and only one (about 30 g of powder) for C663. Note also that for all fumarolised samples, the amount of starting material was only of the order of 600-800 g.
Figure 8 Banded features in PB5 cpx-trachyte
Photograph of a macroscopic section of the sample. White: feldspar phenocrysts; dark brown: biotite phenocrysts; brown, grey-brown, light brown: various bands.
9. Petrography
Since the 19th century, the PdD lavas were more precisely described by using polarised light microscopy (Michel-Lévy, 1890; Bentor, 1954, for the most noteworthy). Over the last 50 years, the development of in situ micro-analyses allowed a better identification of minerals and the determination of their compositions (Boivin et al., 2017 and references therein). Nevertheless, until now, people have generally considered that PdD is so homogeneous that its composition can be summarized by a single typical sample. Here, the petrography of massive rocks was used to define the two trachytic facies which are also encountered, although with some variation, in pyroclastic deposits.
16
These are mainly trachytes with feldspar and biotite phenocrysts (> 0.5 mm) set in a groundmass consisting of plagioclase microliths and without identifiable glassy component (amounting to a few vol% at most). Besides, as the liquid was close to the eutectic, the glass composition must be very close to that of the latest crystallised feldspar crystals making the recognition of this glass almost impossible with the electronic microprobe. The absence of residual glass in PdD massive trachytes was also mentioned by Boudon et al. (2015). Two lava facies were identified: a predominant K-oligoclase and biotite trachyte (bi-trachyte) and a K-oligoclase, biotite, sanidine and clinopyroxene trachyte (cpx-trachyte) (Figure 7).
A large variation of the maximum size and relative abundance of phenocrysts was observed over 30 thin sections of 28 samples (Table S2). However, the statistical comparison of the two main lava facies (Table 2) does not reveal any significant difference, except a higher cristallinity for the cpx-trachytes.
Figure 9 PdD lava facies
(a) Bi-trachyte (sample C931). (b) Cpx-trachyte (sample 1103-2). O: oligoclase; B: biotite; Ox: Ti-Fe oxide; S: sanidine; P: green cpx.
In the bi-trachytes, feldspar phenocrysts consist of plagioclase (oligoclase to potassic oligoclase). They are the most abundant (9 vol%) and the largest and often form clusters in which euhedral crystals diverge suggesting a single center of crystallisation (Figure 9a). In most cases, these phenocrysts display an internal zone of variable thickness exhibiting disequilibrium textures (see Section 10.1.2.). Small euhedral biotite crystals are very often included, sometimes with apatite and Fe-Ti oxides. Biotite is the second phenocryst phase albeit much less abundant (1.5%), with inclusions of prismatic apatite, Ti-magnetite and
17
zircon. Fe-Ti oxides (magnetite and ilmenite) may form mm-sized crystal clusters with apatite. In one-third of the cases, biotite crystals outline the magma flow (trachytic texture). The groundmass mostly consists of anorthose feldspar microliths and Fe-Ti oxide grains. The porosity is highly variable (1-60%) with a mean at about 20%.
Cpx-trachytes display the same paragenesis as bi-trachytes, plus anorthose and sanidine phenocrysts, of similar size as oligoclase crystals, and small crystals (140-1,250 µm) of green clinopyroxene. These cpx crystals are rather stubby (mean L/l =1.95 for n=105), except in two samples (including PB5 which originality will be discussed later) in which elongated prisms (max L/l ~ 5.5) are observed. Cpx crystals are often associated to apatite crystals and form clusters with Fe-Ti oxides (Figure 9b). The groundmass of cpx-trachytes looks similar to that of bi-trachytes, with additional sanidine microliths.
9.2. Pyroclastic deposits
The bi-trachyte lava facies occurs in two pyroclastic deposits.
The EU deposits are composed of up to 40% of 1 to 7 mm large, lithic elements of bi-trachyte. These elements are rounded, with a core consisting of one or a few plagioclase ± biotite phenocrysts encased in a holocrystalline groundmass comprising feldspar microliths, opaque minerals and interstitial silica. These elements are evenly distributed and packed in a homogeneous, friable, and very porous matrix consisting of anorthose feldspar microliths, clusters of cristobalite crystals and hematite grains.
The CR formation contains lapilli of fresh or fumarolised trachyte, fragments of basalts, scoria and xenoliths of basement rocks (Miallier et al., 2010). The fresh K-oligoclase and biotite trachytic elements, initially considered as juvenile magma of a phreatomagmatic eruption, do not exhibit any of the expected features (quenched bombs, dense lapilli, glass in the groundmass), suggesting instead a series of purely phreatic explosions. Petrographically, this remobilised lava facies is indistinguishable from the main bi-trachyte facies.
A cpx-trachyte paragenesis is observed in the trachytic fine-grained layers intercalated in the tuffs of the Nid de la Poule maar. These tuffs contain juvenile clasts of olivine and clinopyroxene-bearing trachybasalt, either quenched or not, black and red scoria from Petit Puy de Dôme and lithic elements of older basalts. The less contaminated (see Section 5) intercalated fine-grained layer is almost white and composed of trachytic elements: alkali feldspar, biotite, green clinopyroxene, clusters of feldspar microliths and silica (Figure 10).
18
This paragenesis is so similar to that of PdD cpx-trachyte that it justifies the inclusion of this trachytic deposit in our study.
Figure 10 Back Scattered Electron (BSE) photographs [Scanning Electron Microscope (SEM)] of the Nid de la Poule trachytic deposit
Trachytic volcanoclasts in the white tuff, Nid de la Poule maar (Figure 5). A: apatite; C: cristobalite; F: alkaline feldspar; P: clinopyroxene; b: basaltic ash; ba: altered basaltic ash; t: fragment of trachytic groundmass.
9.3. Mafic enclaves and silicic xenoliths
Very rare and small sized (< 10 cm) xenoliths, with contrasted compositions, are also encountered in massive trachytes. In the course of this work, only three granitic xenoliths, more or less melted (buchite) were found along with about twenty mafic enclaves. The latter were interpreted either as cumulates, when they had a granular texture, or in terms of magma mixing, for the others (Arnaud, 1989; Arnaud et al., 1992). These xenoliths and enclaves were not considered in our study.
9.4. Fumarolised rocks
The syn-eruptive to late-stage fumarolic activity also produced specific petrographic facies. The transformations affecting both bi- and cpx-trachytes macroscopically consist in changes of colour, from grey to pink, red, yellow and white (Figure 6) and a chert-like appearance in the more advanced stages (see also Supplementary Information D).
19
10. Mineralogy
This section is based on numerous mineral analyses performed during this study and complemented by data from Sourisseau (2007) and Sforna (2008). The whole data set is available in Supplementary Information E (Table S5). Only the mean compositions of minerals are reported in Table 3.
10.1. Feldspars
10.1.1. Chemical zoning
Feldspar phenocrysts and microliths from all the trachytes define a continuous chemical trend, from plagioclase (sodic andesine An32) to sanidine (Or53) (Figure 11a). On the other hand, feldspars from mafic enclaves (Arnaud, 1989) display totally distinct compositions, much An-richer (labrador An59 - andesine An41).
More specifically, feldspar phenocrysts from bi-trachytes exhibit an oligoclase core An32-20 and rims enriched in Na-K (K-oligoclase, An25-15Or19-25) (Figure 11b), whereas in cpx-trachytes additional rims or even whole crystals reaching sanidine compositions (Figure 11c) are observed.
Feldspar microliths from bi-trachytes mainly plot in the anorthose field but may reach sanidine (An23-1Or10-54) compositions (Figure 11d). In cpx-trachytes, the range of compositions seems narrower (An16-1Or16-47) but this is based on a smaller number of analyses available (Table 3).
20
Figure 11 Feldspar compositions
(a) Whole data set. (b) Phenocrysts in bi-trachytes. (c) Phenocrysts in cpx-trachytes. (d) Microliths in bi-trachytes (orange) and in cpx-trachytes (green).
10.1.2. Disequilibrium textures
Numerous plagioclase phenocrysts from both bi- and cpx-trachytes display conspicuous fusion-recrystallisation zones concentric to their compositional zoning patterns (Figure 12). Such features were first described in CdP volcanic rocks as "cloudy zones" (e.g., Bentor, 1951; Poldervaart and Gilkey, 1954). They were later called "sieve textures" (e.g., Nelson and Montana, 1992). The development of these features induces numerous discontinuities in crystals growth with voids infiltrated by a highly porous groundmass, exhibiting the same minerals as the groundmasss of the sample itself, and where silica phase is crystallising (Figures 12a and 12b).
This transformation, naked-eye observed on outcrops, is a specific characteristic of PdD trachytes among CdP trachytes. Such features were variously interpreted in the literature as the result of (1) magma mixing, (2) convection, (3) differential movements (convective self-mixing) in the magma chamber during differentiation or (4) decompression (see Supplementary Information F for more details and references). These textures are usually accompanied by a strong contrast of feldspar compositions (An%) between the sieved zones and the newly crystallised ones. This is never observed for PdD feldspars which do not display significant compositional variations between crystals zones. Thus, our preferred interpretation is that of differential movements in the magma chamber during differentiation
21
resulting in the heterogeneous distribution of fluids. Indeed, classical phase diagrams show that pressure (especially PH2O) is a key parameter regarding the composition of a plagioclase crystallising at a given temperature. Small PH2O variations have the potential to induce variations of plagioclase compositions (see references in Supplementary Information F), although in a restricted range, as observed for PdD feldspars. This interpretation would also be consistent with the recurrence of sieve-textured zones in a single crystal (Figures 12b).
Figure 12 Chemical zoning and disequilibrium textures in plagioclase phenocrysts (SEM X images)
(a) Zoned plagioclase phenocryst in PB4 bi-trachyte. The core (oligoclase) displays a sieve texture, whereas the rim illustrates the growth of euhedral and zoned K-oligoclase. Silica, oxides and K-feldspar only occur in the groundmass. The light blue colour at the bottom left is an artefact of overexposure. (b) Zoned sieve-textured plagioclase phenocryst illustrating the development of recurrent sieve textures in a cpx-trachyte (PB08-2801-2) which does not belong to the main set. Biotite rims (left hand side of the picture) are oxidised. (c) Resorbed plagioclase in PB08-2801-2 cpx-trachyte. Zoned and highly resorbed oligoclase phenocryst used as a nucleus for the development of K-feldspar (anorthoclase and sanidine).
22
Some plagioclase phenocrysts from the cpx-trachytes, including sample PB5 with banded features (Figure 8), display a highly resorbed core of oligoclase which served as a nucleus for the growth of K-feldspars (anorthose and sanidine) (Figure 12c). The first crystal growing layers are barium-rich illustrating the fact that Ba, previously concentrated in the liquid, suddenly becomes compatible at the onset of K-feldspar crystallisation in cpx-trachytes.
10.2. Biotite
This mineral is ubiquitous, with crystals up to 1.5 mm long amounting to about 1 vol% of the phenocrysts. Smaller size crystals are also scattered in the groundmass. [Mg] ratios mostly range between 50 and 61 and Si/Al ratios between 2 and 2.3 (Table 3). No chemical zoning is observed between cores and rims. Partial or even total oxidation (see Supplementary Information C) is commonly observed, with the growth of iron oxides starting from crystal rims and along cleavages (Figures 12b and S5), and making crystals opaque. Biotite in cpx-trachytes is enriched in iron (lower [Mg]), Mn and silica (higher Si/Al) compared to biotite in bi-trachytes (Table 3).
10.3. Clinopyroxene
Green clinopyroxene, associated to sanidine, is the distinguishing feature of cpx-trachytes. Crystals are generally euhedral, sometimes with curved edges (Figure 9). The compositions are quite homogeneous (mean of Ca46±0.4Mg35±1Fe19±1), at the limit of diopside-augite compositions. The green colour may be related to the presence of Fe3+ resulting in 6.6 wt% aegirine component. Although these cpx compositions display the expected linear negative correlation between Mg and Fe, no significant zoning is observed between crystal cores and rims. Mn variations between 2.14 and 3.14 wt% (mean at 2.65 wt%) are not associated to any zoning but rather reflect inter-sample variations. No disequilibrium features were ever observed. Note that green clinopyroxenes from the Nid de la Poule deposits are among the most enriched in Mn (MnO = 3.04 wt%) whereas sample PB5, with macroscopic banding evoking magma mixing, exhibits both the Mn-richest and Mn-poorest (3.14 and 2.16 wt%, respectively) cpx.
23
Raman spectroscopy analyses [Figure S6 and Boudon et al. (2015)] indicate that the silica phase is systematically cristobalite although it used to be considered as tridymite on the basis of crystals shape (Bentor, 1954). Such characteristics suggest a late-stage pseudomorphosis (Figure 13), but this process is not addressed here.
Figure 13 SEM and microscope photographs of cristobalite (C)
(a) Euhedral crystals in a fissure (BSE SEM) in PB3 cpx-trachyte. (b) Euhedral tridymite crystal pseudomorphosed into cristobalite (natural light microscope) in a bi-trachyte.
Analyses (Table 3) of various silica patches define (1) a main group (SiO2: 97.6 wt%, Al2O3: 1.8 wt%, Na2O: 0.7 wt%), and (2) a subordinate one with a larger spread, lower silica (mean 94.5 wt%) and more secondary elements (Figure S7). The first group, mostly composed of euhedral crystals in fissures and voids, and sometimes replacing tridymite, suggests that syn- and post-eruptive fluids were present. The second group, consisting of patches in interstitial position, represents the end products of in situ fractional crystallisation.
24
Fe-Ti oxides occur in all trachytes, generally as clusters or as scattered grains in the groundmass but also, occasionally, as euhedral phenocrysts. It is rarely possible to associate pairs of Ti-magnetite/ilmenite crystals to estimate the oxygen fugacity (Buddington and Lindsley, 1964; Lepage, 2003) of the magmatic system. Indeed, ilmenite is scarce and the large Ti-magnetite crystals are almost systematically reequilibrated at low temperatures, as attested by ilmenite exsolution, and possible oxidation at the contact with atmospheric oxygen (cf. biotite oxidation in Supplementary Information F). Such a process is common in lava bodies undergoing relatively slow cooling (Haggerty, 1976). Nevertheless, tentative estimates suggest that the fO2-T°C trajectory of trachytic magmas was intermediate between the NNO and HM buffer curves, in keeping with the sole value published so far (Maury et al., 1980a) and the fO2 buffer in alkaline series, classically slightly higher than NNO (Anderson, 1968; Maury et al., 1980b; Boivin and Bachèlery, 2009). This value was also used by Martel et al. (2013) to set their experimental conditions.
Accessory minerals consist of small zircon and apatite crystals, often associated to Ti-oxide clusters. Although very rare, sphene (titanite) was observed in four cpx-trachytes (Sourisseau, 2007).
11. Geochemistry
11.1. Major and trace element geochemistry
Major and trace element contents are given in Table 4 and analytical procedures described in
Supplementary Information C. The range of variation of both major and trace element concentrations is very limited although it is obvious that the composition of the PdD trachyte cannot be defined based on a single sample as it used to be (Maury et al., 1980a; Martel et al., 2013; France et al., 2016).
11.1.1. Major element data
SiO2 variation among WR fresh samples is only 66-68.5 wt%, Al2O3 16-17.3 wt%, K2O 4.6- 5 wt%, Na2O 5.6-6.1 wt%, TiO2 0.34-0.49 wt%, CaO 1-1.7 wt%, P2O5 below detection limit to 0.21 wt% and MgO 0.21-0.66 wt%. However, it must be outlined that these ranges are
25
much larger than for any other trachytic volcano from the CdP (Boivin et al., 2015; Miallier et al., 2017).
Despite some scatter, Al2O3, MgO, CaO, P2O5 and TiO2 overall decrease while K2O increases with increasing SiO2 (Figure 14). Furthermore, the two main groups of trachytes identified on the basis of their mineralogy are distinguished in these diagrams despite some overlap, bi-trachytes displaying less evolved compositions and a larger dispersion. Although pyroclastites mostly plot in the field of bi-trachytes, in agreement with their mineralogy, lapilli from the CR formation and two blocks (DM2 and DM3) included in the EU deposits mostly plot outside the main trend, with lower CaO and P2O5 but higher Al2O3 contents than other samples with similar SiO2 contents. Note, however, that the massive bi-trachyte C928 lies within this group. Further, CR pyroclastites exhibit more evolved compositions than the EU deposits. The latter and two included blocks (DM6 and 1105-2) display the less evolved compositions encountered, together with PB2 (the least evolved one), also located on the eastern flank.
As already observed for their mineral compositions, PB5C and PB5F (sub-samples) have identical bulk compositions.
26
Figure 14 Selection of some Harker diagrams for the various lava groups
Diagrams are given at two distinct scales to visualise the set of unaltered samples (right column) and fumarolised samples (left column). Numbers of some outstanding samples are given. Bi- and cpx-trachytes are distinguished although a significant dispersion is observed,
27
especially among the less differentiated bi-trachytes. The compositions of fumarolised samples are very variable.
A large range of compositions is also observed among fumarolised samples which overall depart from the other samples with, more specifically, high to very high SiO2 contents (up to 76 wt % and even 98 wt%). Large variations are also observed for most major elements such as Al2O3 (1-17.3 wt%), Fe2O3 (0.2-4.6 wt%), CaO (0.1-1.4 wt%), Na2O (0.2-6.2 wt%) or K2O (0.3-5 wt%), demonstrating that fumarolic activity was accompanied by large chemical changes (also Figure S4 in Supplementary Information D). Even the three samples taken close to a fissure, and very close to each other, display a large range of compositions (e.g., Al2O3: 13.5-17.1 wt%, Fe2O3: 0.7-4.6 wt%, Na2O: 4.8-5.8 wt% or K2O: 3.6-4.8 wt%).
11.1.2. Trace element data
11.1.2.1. Multi-element and REE patterns
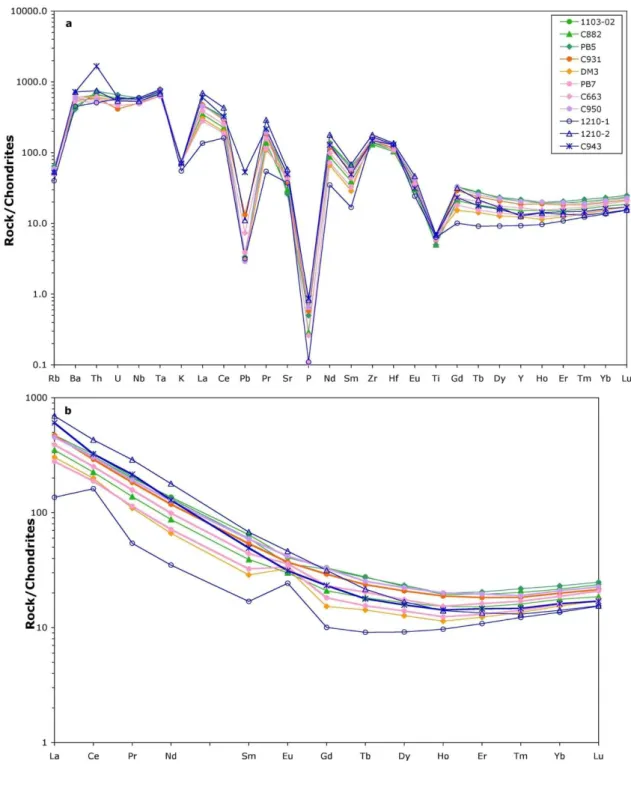
All samples display similar multi-element patterns with strong negative anomalies in Rb, K, Pb, P and Ti and smaller ones in Sr and Sm (Figure 15a). These patterns also illustrate the higher enrichment in the most incompatible elements (but Ba) in cpx-trachytes compared to bi-trachytes, consistent with their more evolved character and the onset of potassic feldspar fractionation (see Section 9.1. and Figure 12c). Cpx-trachytes are also generally less enriched in Sr, P, Zr, Hf and Ti, probably in relation with plagioclase, apatite, zircon and Fe-Ti oxides fractionation. The larger spread of compositions among bi-trachytes is further illustrated in these diagrams, as the affiliation of both CR and EU pyroclastite units to this group.
Despite global similar shape for Rare Earth Elements (REE) patterns (Figure 15b), the fractionation between LREE and HREE is variable within each group. The range of (La/Yb)N is 16.8-23.6 for bi-trachytes, including both groups of pyroclastites, versus 17.2-22.1 for cpx-trachytes (Table 4), further outlining the larger scatter among the former. Note that CR pyroclastite samples plus DM2 and DM3 blocks from the EU are significantly less enriched in
REE than other EU samples, with (La/Yb)N 16.8-21.4 versus 19.5-22.4. Eu anomaly is absent or positive (CR pyroclastites except DM5 plus C928 and PB1, and DM2 and DM3 from the EU) in bi-trachytes, and absent or negative in cpx-trachytes. PB5C and PB5F sub-samples remain indistinguishable based on their trace element compositions.
28
Also, from Ba to Sm, the variation among fumarolised samples encompasses the full range of variation encountered among fresh samples. It is even larger for REE (La to Eu), with (La/Yb)N of 10-49.3, Th and Pb. They also exhibit the highest Zr and Hf contents and the lowest concentrations of more compatible lanthanides (Gd to Lu).
Figure 15 Spiderdiagrams for a selection of samples
(a) Representative multi-element and (b) REE patterns normalised to chondrites (Sun and McDonough, 1989). Colour codes refer to the distinct units: cpx-trachytes (green),
bi-29
trachytes (orange), CR pyroclastites (pink), EU pyroclastite (purple), fumarolised samples (blue). The range of variation among fumarolised samples encompasses the full range of variation encountered among fresh samples.
11.1.2.2. Binary trace element diagrams
Th is a highly incompatible element which is more sensitive to the degree of evolution of magmas than SiO2 but, in felsic rocks, it may be affected by the fractionation of accessory minerals. However, the consistent variation between Th and SiO2 and the great similarity of U-Th, Rb-Th or Rb/Sr-Th variations (Rb and Sr being unaffected by accessory mineral fractionation) suggest that this effect is here very limited, allowing Th to be used as an index of differentiation. Although Th concentration range (15-21.8 ppm) remains fairly restricted, bi-trachytes (15-18.9 ppm) and cpx-trachytes (17.8-21.8 ppm) are again roughly distinguished in binary trace element diagrams such as U-Th (Figure 16). U and Th are also positively correlated, as expected for two highly incompatible elements during magmatic differentiation, but with a large dispersion indicating the involvement of additional processes than crystal fractionation, both within and between groups.
Compared with fresh rocks, fumarolised samples display a larger range of variation for Th (14.8-48.4 ppm) but almost none for U (4.3-4.9 ppm), which was probably buffered by the fluid phase. Besides, the range (15-22 ppm) displayed by the three samples collected next to a fissure encompasses that of all the undisturbed samples.
30
Figure 16 U ppm versus Th ppm variation
C943 with 4.9 ppm of U and a much higher Th content (48.4 ppm) than all the other samples is not plotted for the sake of clarity. Error bars (2SD) arise from the four replicate measurements of DM3 sample (Table S4) performed in the course of this study. Although U and Th are positively correlated, a large dispersion is observed suggesting the involvement of additional processes besides crystal fractionation.
11.2. Radionuclides
Similarly, a large variability is observed for the activities of both 226Ra (51-76 Bq.kg-1), belonging to the radioactive decay series of 238U, and 232Th (60-92 Bq.kg-1) (Table S3). This variation is larger than that observed in the six other CdP trachytic volcanoes (Boivin et al., 2015), including Grand Sarcoui which shares many characteristics with PdD (Miallier et al., 2017). As expected, a positive correlation is also observed between 226Ra and 232Th activities and the main groups previously described are identifiable (Figure 17). The Nid de la Poule trachytic deposits, which were not analysed for major and trace elements because of the poor quality of the samples (see Section 5.), were analysed for (226Ra) and (232Th). Both radionuclide activities are among the highest measured, confirming the highly evolved character of these products, as already shown by their cpx compositions (see Section 10.3.).
31
Furthermore, these activities must be considered as minimum estimates because the trachytic component could not be completely separated from intimately associated, less evolved components (see Section 9.2.).
Figure 17 (226Ra) versus (232Th) variation
Ra and Th activities define a better correlation than U and Th concentrations. CR pyroclastites from PdD summit exhibit the least evolved bi-trachyte compositions whereas Nid de la Poule trachytic deposits display the most differentiated cpx-trachyte compositions.
Note that the sample groups (especially CR) and the positive correlation appear better defined with 226Ra and 232Th activities than with U and Th concentrations (Figure 16). This is due to the smaller uncertainties on activity measurements and to the fact that Ra and U elements behave differently. Error bars are 2SD statistical and systematic uncertainties.
11.3. Radiogenic and stable isotope geochemistry
11.3.1. Radiogenic (Sr and Nd) isotopes
32
143
Nd/144Nd isotope ratios (0.512732 to 0.512745) variation is insignificant as it is of the same order of magnitude as the 2SD on the mean of 22 JNdi-1 standard measurements (see
Supplementary Information C for analytical procedures), with the exception of PB7 which is significantly more radiogenic (0.512796).
Although broadly homogeneous, Sr isotopes allow to roughly distinguish the two main lava facies: bi-trachytes (including CR and EU pyroclastites) with lower ratios (0.704491 < 87
Sr/86Sr < 0.704515), and cpx-trachytes with more variable and slightly higher ratios (0.704523 < 87Sr/86Sr < 0.704570). Indeed, only one cpx-trachyte (PB3) has a Sr isotope ratio (0.704498) similar to bi-trachytes (Figure 18b). Besides, PB7 (CR formation) is less radiogenic (0.704463) than all the other samples, in line with its more radiogenic Nd isotope signature (Figure 18a).
The peculiar distribution of Sr isotope signatures in PB5 cpx-trachyte must also be outlined. While PB5 and PB5C exhibit similar ratios (0.704558 and 0.704567, respectively), PB5F displays a significantly higher value (0.704637), corresponding to the most radiogenic signature measured in this study.
Interestingly, both Sr and Nd isotope ratios of the few analysed fumarolised samples are similar to those of non fumarolised samples, suggesting either that the magmatic system remained closed regarding Sr and Nd isotopes, or that the mass balance between fumarolic fluids and rocks could not result in a variation of isotopic ratios in the latter.
33
34
(a) 143Nd/144Nd - 87Sr/86Sr, (b) Th ppm - 87Sr/86Sr and (c) 18OWR (‰ VS OW) - 87Sr/86Sr variation. Error bars for isotopic ratios are the 2SD given in Supplementary Information C whereas for Th, it is as in Figure 16. 143Nd/144Nd variation is insignificant except for PB7 CR sample. Bi- and cpx-trachytes are roughly distinguished through 87Sr/86Sr and cpx-trachytes display slightly higher 18OWR. Fumarolised samples have indistinguishable Sr-Nd signatures and display a large range of 18OWR.
11.3.2. O isotopes
In contrast with Sr-Nd isotopes, a large range of 18O is observed (Table 5), from 5.7 to 13.7 ‰ (Figure 18c) [see Supplementary Data Information C for analytical procedure]. Although only eleven samples were analysed, the cpx-trachytes seem to have 18O slightly higher and more variable (7.2-9.4 ‰) than massive bi-trachytes (5.7-6.9 ‰). C950 (EU pyroclastite) displays a slightly higher 18O (7.4 ‰) than the other bi-trachytes. Furthermore, the two fumarolised samples analysed, associated to the same fissure, display one of the lowest 18O (6 ‰) and the highest (13.7 ‰) values, suggesting that fumarolised samples have a large range of oxygen isotope compositions, as already observed for most major and trace elements.
12. Discussion
Our field, geomorphological, petro-mineralogical, geochemical and isotopic data bring new constraints on the genesis of PdD magmas and on the processes involved in the development of the volcano, allowing us to revisit the model of this edifice growth.
12.1. Magmatic differentiation, magma mixing and crustal contamination
In this section, only those processes which occurred in the uppermost crustal magma chamber associated to PdD will be evaluated, without consideration of the deeper crustal history of magmas which is out of the scope of this paper. Despite some overlap between groups, major and trace element compositions document an increasing degree of differentiation, from PB2 bi-trachyte and the EU pyroclastites to the rest of bi-trachytes (including the CR pyroclastites) and then cpx-trachytes. Besides, our mineralogical and radioactive nuclide data reveal a genetic link between the trachytic deposits of the Nid de la Poule and PdD cpx-trachytes, the
35
former exhibiting one of the most evolved cpx-trachyte compositions. These trachytic volcanoclasts reached the surface after the eruption of PdD, due to the explosive activity of a maar on Petit Puy de Dôme (see Section 12.4.2.).
However, the dispersion observed in Harker diagrams, both for the whole data set and within each group, suggests that crystal fractionation alone cannot account for the differentiation among these trachytes. This is further illustrated by the large scatter in binary trace element diagrams involving either highly incompatible elements with very similar behaviour during differentiation (e.g., U, Th, La), or less incompatible elements (e.g., Sr, Nb, Zr, Y), including elements sensitive to plagioclase and zircon fractionation in evolved compositions (see Section 11.1.2.2.) (Figures 16 and 19). Sr isotope ratios (Figure 18b), higher and more variable in cpx-trachytes than in bi-trachytes, also require the involvement of additional processes.
Figure 19 Binary trace element diagrams
(a) La versus Th; (b)Y versus Nb; (c) Y versus Sr and (d) Zr versus Sr. Error bars (2SD) as in Figure 16. The dispersion observed with both highly incompatible (Th, La) and less
36
incompatible (Sr, Nb, Zr, Y) trace elements suggests the involvement of additional processes besides crystal fractionation during differentiation. Note the group with lower La and Y contents.
The outstanding macroscopic banding (Figure 8) and distinct mineralogical characteristics of PB5 suggest the involvement of magma mixing processes. Specifically, it is in this sample that the most extreme cpx compositions (the whole range of Mn content) are encountered. Also, plagioclase phenocrysts displaying resorbed/growth features coexist with homogeneous crystals, indicating the existence of inherited crystals and thus the interaction of distinct magmas.
Although granite and buchite xenoliths are very rare in cpx-trachytes (and absent in bi-trachytes), crustal contamination could have been involved as both the magma chamber and conduit are located in the granitic basement. The banded sample PB5 is one of the three most evolved cpx-trachytes of this study and also the most radiogenic in Sr, with significant intrasample Sr isotope heterogeneity. However, it does not display any petrological or mineralogical evidence of crustal contamination. Moreover, the Sr isotope heterogeneity contrasting with Nd isotope homogeneity is incompatible with bulk assimilation of the country-rocks and would rather suggest selective crustal contamination or the interaction with Sr-rich fluids with a radiogenic signature. We suggest that late magmatic fluids associated to the more evolved magmas (cpx-trachytes) and interacting with the granitic country-rocks at the roof and walls of the magma chamber and/or conduit would have favoured the preferential destabilisation of the ca. 300 Ma old biotite of the local basement, characterised by highly radiogenic 87Sr/86Sr ratios (1.06 to 3.67, Vialette, 1962). Such fluids, highly radiogenic in Sr, would account for the observed decoupling between Sr and Nd isotopes and the fact that cpx-trachytes, the most evolved and first emitted magmas (see Section 12.4.1.), display a more radiogenic Sr isotope signature. Indeed, cpx-trachytic magmas could have been variably contaminated in that way, possibly at the top of the magma chamber but especially in the magma conduit, and then imperfectly mixed because of their high viscosity due to their evolved composition. Such contamination-mixing process would be compatible with all our petrological, mineralogical and Sr isotope data and the dispersion of major and trace element data. Among our samples, banded sample PB5 would give the best illustration of such a process, probably in the magma conduit (see Section 12.4.1.). Mechanical mixing and shearing between magma batches happening during ascent in magma conduits has also been
37
reported for andesitic domes (e.g., Montserrat, Burgisser et al. 2010). In this case, magmas were only distinguished through their state of degassing and crystallisation.
At first sight, the small (except C882) increase of 18O in cpx-trachytes (7.2-7.4 ‰) comp red to bi-trachytes (5.7-6.9 ‰) (Figure 18c) could simply be explained by an increasing degree of differentiation. However, this is not supported by the 18O - SiO2 relationships (Figure 20). Indeed, although PB6, PB5C and PB5F display slightly higher 18O than PB1 and C928, their SiO2 contents are almost identical. Furthermore, PB6, PB5C and PB5F, though almost identical for their 18O, display significantly different 87Sr/86Sr ratios (Figure 18), indicating a decoupling of O and Sr isotopes and thus a complex interplay of crustal contamination-mixing, and probably fluid interactions during the genesis of the cpx-trachytes.
Figure 20 18OWR (‰ VS OW) versus SiO2 wt% variation
Error bars refer to the 1SD of 18O given in Supplementary Data Information C and a 2SD for SiO2 wt% deliberately slightly larger (0.5) than that given in Table S4. The small increase of
18
38
differentiation. The variation among bi-trachytes and the high 18OWR of C882 do not support an exclusive control by crystal fractionation and crustal contamination-mixing processes.
The homogeneous Sr isotopes of bi-trachytes suggest that these magmas were probably less, or not, affected by contamination/mixing processes. Both the lower 87Sr/86Sr and the absence of crustal xenoliths in this facies would also be consistent with the fact that the bi-trachytes were emitted after the cpx-trachytes, and were potentially less affected by crustal contamination at the magma chamber roof/walls and/or during magma ascent. Although PB1, PB2 and C928 bi-trachytes display almost identical 18O (Figure 20), the lower and higher values of DM3 and C950, respectively, over the same range of SiO2, do not support an exclusive control by crystal fractionation.
12.2. A distinct group
The anomalous character of some samples, namely the cpx-trachyte C882 with a much higher
18
O than expected and DM3 and C950, suggests the involvement of additional processes than crystal fractionation, crustal contamination and magma mixing (probably located in the magma conduit) in their genesis.
The anomalous character of some samples is also illustrated in the Y-Sr and Zr-Sr diagrams (Figures 19c and 19d) where double trends are observed. In the Zr-Sr diagram, one trend is displaced toward higher Sr contents at similar Zr contents whereas in the Y-Sr diagram, one trend is displaced toward lower Y contents at similar Sr contents.
Bi-trachytic samples PB2, C949, C950, DM2, DM3, DM5 belonging to the high Sr group in the Zr-Sr diagram and having similar Sr isotope ratios (the five analysed samples), do not belong to the same trend in the Y-Sr diagram. Indeed, DM2 and DM3 plot on the lower Y-Sr trend, with significantly lower Y contents. Note that two other bi-trachytic samples (PB1 and C928) and one cpx-trachyte (C882) belonging to the low Sr-Zr trend also plot on this low Y-Sr trend. This distinct, low Y-Y-Sr group is also identified in the Y-Th and Y-Nb diagrams (Figures 21 and 19b) where the other samples define an overall positive correlation. This group consists of massive bi-trachytes (PB1 from a spine and C928 from a crest), bi-trachytic blocks from the dome having a brecciated groundmass (DM2 and DM3) and embedded in the EU pyroclastite, a massive cpx-trachyte from a northeastern crest (C882) and all the CR pyroclastites. It is also recognisable in the La-Th diagram (Figure 18a) due to its lower La contents.
39
Figure 21 Y versus Th variation
Error bars as in Figure 19.
The low Y group is distinguished as in Figure 19. It is also characterised by low REE contents and ratios such as Sm/Yb, in addition to its lower CaO, P2O5 and higher TiO2 contents.
This group is actually well identified with all the REE and Y, and also with some REE ratios such as Sm/Yb, which are lower than in the rest of samples. Although less conspicuous, the distinction can also be made with major elements, mainly CaO but also P2O5 and TiO2 (Figure
14), these samples exhibiting lower CaO and P2O5 (except PB1) but higher TiO2 contents for similar SiO2 contents. In the CaO versus SiO2 diagram, they actually define a secondary trend of differentiation, parallel to the first one but with lower CaO concentrations. The fact that the samples from this marginal group belong to the various magmatic groups identified in this study suggests that their features could be related to processes other than purely magmatic, such as tardimagmatic (fumarolic activity?) or secondary (meteoric alteration?) processes.
40
12.3.1. Alteration
The 27 non fumarolised samples were selected for both their representativity and freshness (macroscopic and microscopic examination). Only CR samples for which little material was available were of lower quality as they consist of lapilli ejected during a late phreatic eruption, in relation to a hydrothermal system. In thin section, biotite is generally largely oxidised and a yellow to green pervasive alteration of the groundmass is observed, outlining that these samples suffered alteration. We decided to analyse them, however, as this specific unit, sampled during layout works on PdD summit, does not crop out elsewhere on the volcano.
The freshness of the samples may also be evaluated through their LOI, which is usually impossible with basalts because of the presence of Fe2+ affecting the LOI measurements. Two thirds of our samples display LOI < 0.4 wt% and only four samples have LOI > 0.8 wt% (Table 4, Figure 22a). Not surprisingly, three CR samples are clearly apart with LOI of 0.85 to 1.1 wt% whereas fumarolised samples have values of 0.6 to 2.4 wt%, the former value overlapping values measured in the non fumarolised samples. Note that C806, with one of the two highest LOI (1.05 wt%), does not belong to the marginal group of samples mentioned above whereas PB7 and DM2 from this group display LOI < 0.4 wt%. Samples from the marginal group plotting among the other samples generally display the highest LOI at a given Th content. However, two other samples (C931 and C963) also define this upper LOI limit (with either Th or SiO2). A similar pattern is observed in many other LOI-x diagrams, x being either a potentially highly mobile element during alteration (U, K) [Figure 22b] or a reputed immobile element such as the REE and Y (Figure 22c). In LOI-REE (or Y) diagrams, the marginal group is again clearly identified with an additional subgroup consisting of the three CR samples having a higher LOI.
There is no correlation between Sr or O isotope ratios and LOI although both isotope ratios may easily be modified by alteration and/or secondary processes. Specifically, low temperature reequilibration of the rocks with meteoric water would result in higher 18O because of very positive rock/water fractionations, becoming even more positive with decreasing temperature (e.g., Zhao and Zheng, 2003).
Thus, based on the low LOI and because alteration cannot similarly affect highly mobile and immobile elements while leaving Sr and especially O isotopes unaffected, we conclude that it does not account for the characteristics of the marginal group of samples. Concerning the CR formation, alteration and small samples size cast doubt on the representativity of its
41
geochemical signature and we will not try here to interpret it thoroughly. The intragroup positive correlation observed almost systematically among three samples of this group (Figure 22) could indeed just result from alteration processes. The same interpretation might be proposed for the positive correlation observed between U and Th contents (Figure 16) whereas it is absent between Ra and Th activities (Figure 17). Also, bearing in mind the polygenic nature of the sampled CR deposit, the isotopic signature of PB7 (the most primitive measured in this study) could simply reflect a foreign origin.
42


![Figure 10 Back Scattered Electron (BSE) photographs [Scanning Electron Microscope (SEM)] of the Nid de la Poule trachytic deposit](https://thumb-eu.123doks.com/thumbv2/123doknet/13621441.425614/19.892.110.789.175.412/figure-scattered-electron-photographs-scanning-electron-microscope-trachytic.webp)