HAL Id: inserm-00784862
https://www.hal.inserm.fr/inserm-00784862
Submitted on 10 Jun 2013
HAL is a multi-disciplinary open access
archive for the deposit and dissemination of
sci-entific research documents, whether they are
pub-lished or not. The documents may come from
teaching and research institutions in France or
abroad, or from public or private research centers.
L’archive ouverte pluridisciplinaire HAL, est
destinée au dépôt et à la diffusion de documents
scientifiques de niveau recherche, publiés ou non,
émanant des établissements d’enseignement et de
recherche français ou étrangers, des laboratoires
publics ou privés.
Robust perfusion maps in Arterial Spin Labeling by
means of M-estimators
Camille Maumet, Pierre Maurel, Jean-Christophe Ferré, Christian Barillot
To cite this version:
Camille Maumet, Pierre Maurel, Jean-Christophe Ferré, Christian Barillot. Robust perfusion maps
in Arterial Spin Labeling by means of M-estimators. International Society for Magnetic Resonance
in Medicine 21st Annual Meeting & Exhibition (ISMRM), Apr 2013, Salt Lake City, United States.
pp.3037. �inserm-00784862�
4122
Robust perfusion maps in Arterial Spin Labeling by means of M-estimators
Camille MAUMET1, Pierre Maurel1, Jean-Christophe Ferré1,2, and Christian Barillot1
1Inria, IRISA, RENNES, Brittany, France, 2Department of Neuroradiology, CHU Rennes, Rennes, Brittany, France
Target audience: Medical doctors, computer scientists.
Purpose: Non-invasive measurement of Cerebral Blood Flow (CBF) is now feasible thanks to the introduction of Arterial Spin Labeling (ASL) Magnetic Resonance Imaging (MRI) techniques. To date, due to the low signal-to-noise ratio of ASL, a single acquisition (pair of control/label scans) is not sufficient to estimate perfusion reliably. Instead, the acquisition is usually repeated several times and the perfusion information is calculated by averaging across the repetitions.
However, due to its zero breakdown point, the sample mean is very sensitive to outliers. In this paper, we propose to compute ASL CBF maps using Huber's M-estimator, a robust statistical function that is not overly impacted by outliers. This method is compared to an empirical approach, introduced in [1], based on z-score thresholding.
Methods: Starting from a set of perfusion-weighted images, obtained after pair-wise subtracting the control and label scans, the objective is to compute a single perfusion volume. Though sample mean, as an unbiased estimate of mean, ensures convergence as the number of repetitions grows, this estimator is very sensitive to outliers. Yet, in ASL sequences, the presence of artefacts related to acquisition or post-processing (in particular, sudden subject motion may cause strong corolla-shaped artefacts) can produce outliers in the repetitions. To avoid the detrimental effects that a few abnormal repetitions could have in the final perfusion map, it is often suggested to ignore the volumes corresponding to the motion peaks using an appropriate threshold. Other authors have proposed to include the motion parameters as confounding factor in a statistical analysis to account for motion errors [2]. We will focus on a more general approach, where outliers are not specifically motion-related. In [1], the authors proposed an automatic algorithm for outlier rejection in ASL perfusion series, based on z-score thresholding of the mean and standard deviation of intensities at the volume (or slice) level. Once the outlier volumes are identified, the perfusion map is then computed by averaging the remaining repetitions. However, z-score is known to be sensitive upon sample size and is suffering from masking effects when more than one outliers are present in the set. On top of this, the method presented in [1] is mainly empirical. Another solution to deal with outliers is to employ robust statistics such as M-estimators of location, which will not be overly impacted by outliers. We focused on Huber's M-estimator [3], which is the most widespread M-estimator of this category. The idea behind it is to down-weight the data points that are too far, in term of standard deviation, from the estimated mean location.
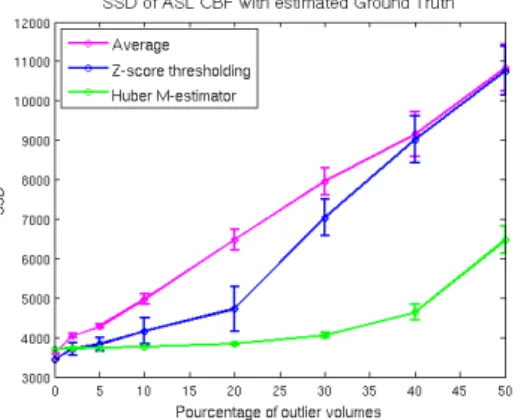
Results: In a first experiment, we illustrated the theoretical behavior of the 3 methods (sample mean, z-thresholding from [1] and Huber's M-estimator) in the presence of outliers. To this aim, we added outliers (from a uniform distribution U(-100, 100)) to an ASL serie (60 pairs). We computed the sum of squared differences (SSD) between the CBF estimates and the ground truth computed by averaging a long ASL serie (250 pairs, ~25 min). We studied different levels of corruption and repeated the experiment 30 times. As displayed in fig. 1, z-thresholding and Huber’s M-estimator perform better than averaging as soon as outliers are present in the data. If more than 5% of the volumes are corrupted, then M-estimators provide better estimates than both z-thresholding and averaging. In a second experiment, we compared the performances of the 3 methods on real clinical datasets. The quality of the estimated ASL CBF map was assessed by computing a linear correlation index with a CBF map extracted from the most
validated MR technique for perfusion: Dynamic Susceptibility Contrast (DSC) imaging. 26 patients diagnosed with brain tumors were involved in this experiment. To investigate the behavior of the different CBF estimators on datasets of various sizes, we further decimated the data (to get from 5 to 50 volumes) by randomly picking a subset of the available volumes. The experiment was repeated 20 times. As displayed in fig. 2, both z-thresholding and Huber's M-estimator outperform the sample mean. Huber's M-estimator appears marginally better than z-thresholding. Fig. 3 presents an example in which we can clearly see the improved quality of both robust ASL CBF maps.
Discussion: We studied the behavior of z-thresholding and Huber's M-estimators to compute CBF estimates in ASL. On theoretical ground, Huber's M-estimator is clearly more robust than z-thresholding. On the tested clinical cases, the superiority was less pronounced but still present. Overall, both robust methods outperform the sample mean on simulated and real data. In patient populations, where artefacts are more frequent, we advise the use of a robust approach to compute CBF maps in ASL.
References: [1] Tan et al., JMRI, 2009 [2] Wang et al. MRI 2012 , [3] Huber et al., The Annals of Mathematical Statistics, 1964
Figure 2: Correlation of ASL CBF estimates with DSC CBF in real clinical datasets in experiment 2.
Figure 1: Sum of squared differences between ASL CBF estimates and ground truth in experiment 1.
Figure 3: Example of estimated CBF maps (40 volumes); a. DSC CBF, b. Average, c. z-thresholding, d. M-estimator