HAL Id: hal-00295558
https://hal.archives-ouvertes.fr/hal-00295558
Submitted on 30 Nov 2004
HAL is a multi-disciplinary open access
archive for the deposit and dissemination of
sci-entific research documents, whether they are
pub-lished or not. The documents may come from
teaching and research institutions in France or
abroad, or from public or private research centers.
L’archive ouverte pluridisciplinaire HAL, est
destinée au dépôt et à la diffusion de documents
scientifiques de niveau recherche, publiés ou non,
émanant des établissements d’enseignement et de
recherche français ou étrangers, des laboratoires
publics ou privés.
Aerosol seasonal variability over the Mediterranean
region and relative impact of maritime, continental and
Saharan dust particles over the basin from MODIS data
in the year 2001
F. Barnaba, G. P. Gobbi
To cite this version:
F. Barnaba, G. P. Gobbi. Aerosol seasonal variability over the Mediterranean region and relative
impact of maritime, continental and Saharan dust particles over the basin from MODIS data in
the year 2001. Atmospheric Chemistry and Physics, European Geosciences Union, 2004, 4 (9/10),
pp.2367-2391. �hal-00295558�
SRef-ID: 1680-7324/acp/2004-4-2367 European Geosciences Union
Chemistry
and Physics
Aerosol seasonal variability over the Mediterranean region and
relative impact of maritime, continental and Saharan dust particles
over the basin from MODIS data in the year 2001
F. Barnaba and G. P. Gobbi
Istituto di Scienze dell’Atmosfera e del Clima, ISAC-CNR, Via Fosso del Cavaliere, 100, 00133, Roma, Italy Received: 17 May 2004 – Published in Atmos. Chem. Phys. Discuss.: 4 August 2004
Revised: 8 November 2004 – Accepted: 18 November 2004 – Published: 30 November 2004
Abstract. The one-year (2001) record of aerosol data from
the space borne Moderate Resolution Imaging Spectrora-diometer (MODIS) is analyzed focusing on the Mediter-ranean region. The MODIS aerosol optical thickness stan-dard product (AOT at 550 nm) provided over both land and ocean is employed to evaluate the seasonal and spatial vari-ability of the atmospheric particulate over the region. Ex-pected accuracy of the MODIS AOT is (±0.05±0.2×AOT) over land and (±0.03±0.05×AOT) over ocean. The sea-sonal analysis reveals a significant AOT variability all over the region, with minimum values in Winter (AOT<0.15) and maximum in Summer (AOT>0.2). The spatial variability is also found to be considerable, particularly over land. The impact of some major urban sites and industrialized areas is detectable. For the sole Mediterranean basin, a method (aerosol mask) was implemented to separate the contribution of maritime, continental and desert dust aerosol to the total AOT. Input of both continental and desert dust particles is well captured, showing North-to-South and South-to-North AOT gradients, respectively. A quantitative summary of the AOT seasonal and regional variability is given for different sectors of the Mediterranean basin. Results of this sum-mary were also used to test the aerosol mask assumptions and indicate the method adopted to be suitable for the aerosol type selection. Estimates of the atmospheric aerosol mass load were performed employing specifically-derived mass-to-extinction efficiencies (α). For each aerosol type, a reli-able mean α value was determined on the basis of both lidar measurements of extinction and aerosol models. These esti-mates indicate a total of 43 Mtons of desert dust suspended over the basin during 2001. A comparable value is derived for maritime aerosol. Opposite to the dust case, a minor sea-sonal variability (within 15%) of maritime aerosol mass is
Correspondence to: F. Barnaba
(f.barnaba@isac.cnr.it)
found. This latter result is considered a further check of the suitability of the methodology adopted to separate, on the ba-sis of MODIS data, the three aerosol types which dominate the Mediterranean region.
1 Introduction
The great effort spent over the last decade by the scien-tific community to investigate atmospheric particulate mat-ter reflects the importance attributed to aerosol in control-ling the Earth’s climate (e.g. Penner et al., 2001). Major advancements in the field have been fostered by a new gen-eration of space based instruments (e.g. ATSR-2 on board the ESA-ERS2, MODIS and MISR on board the NASA Terra, POLDER on board the ADEOS), specifically devel-oped to facilitate detection and characterization of atmo-spheric aerosols (e.g. King et al., 1999). A large amount of space-retrieved aerosol data has been produced in recent years and, after the initial period of quality checking (e.g. Chu et al., 2002; Remer et al., 2002; Chu et al., 2003; Levy et al., 2003; Liu et al., 2004), validated information is now becoming available. Even though further improvement of aerosol dedicated instruments and inversion techniques is still needed, it is important to exploit the large, routinely available set of data, particularly considering the unique po-tential of space-based observations in terms of spatial cover-age.
On this basis, a one-year-dataset (2001) of the aerosol opti-cal thickness operational product (AOT) from the Moderate-resolution Imaging Spectroradiometer (MODIS, on board the NASA platform Terra) has been employed and analyzed to get a picture of the aerosol seasonal and regional variability over the Mediterranean region. This study was performed in combination with the analysis by Gobbi et al. (2004) in © 2004 Author(s). This work is licensed under a Creative Commons License.
2368 F. Barnaba and G. P. Gobbi: Aerosol seasonal variability over the Mediterranean region which the record of lidar soundings collected in the year
2001 was used to characterize the seasonal variability of the aerosol vertical distribution over Rome (Italy), as representa-tive of Central Mediterranean conditions.
The Mediterranean represents a unique area in terms of suspended particulate matter. Bounded to the north by the European continent and to the south by the North Africa arid regions, it is largely affected by both Saharan dust, anthro-pogenic aerosols and, of course, maritime aerosols. Trans-port of Saharan dust from the North African coasts to the Mediterranean and Europe has been widely investigated (ei-ther as long term analyses or as “case studies”) employing in situ samplings (e.g. Molinaroli et al., 1993; Loye-Pilot and Martin, 1996; Avila et al., 1998; Kubilay et al., 2000; Col-laud Coen et al., 2003), lidar (e.g. Hamonou et al., 1999; Gobbi et al., 2000; Di Sarra, et al., 2001; Muller et al., 2003; De Tomasi et al., 2003; Dulac and Chazette, 2003; Gobbi et al., 2004) and satellite observations (e.g. Dulac et al., 1992a; Moulin et al., 1998; Israelevich et al., 2002). Conversely, studies of the export of particles from the Eu-ropean continent (i.e. mainly pollution-related cases) to the Mediterranean Sea are still limited. However, a growing in-terest in this topic is now emerging. A recent international effort to quantify the impact of anthropogenic emissions on the natural background of the Mediterranean environment is represented by the Mediterranean Intensive Oxidant Study (MINOS). Largely based on experimental results, the MI-NOS project highlighted the important role of pollutants in the summertime Mediterranean atmosphere (e.g. Lelieveld, 2002). Models have also been usefully employed to investi-gate the export pathways of air pollution from Europe (e.g. Stohl et al., 2002; Duncan and Bey, 2004). Still, Duncan and Bey (2004) point out the current lack of observations of pollution-related parameters to be compared to model results in the European region.
The strength of the dust outbreaks over the Mediterranean tends to facilitate the Saharan dust detection by both ground and space based observations, allowing the quantification of its transport and of its optical and microphysical properties. As opposite to Saharan dust, investigation of the export of particulate matter from the industrialized countries surround-ing the Mediterranean (in the followsurround-ing referred to as “conti-nental aerosols”) is complicated by the fact that an extremely large number of species and gas precursors (including inor-ganic and orinor-ganic compounds) contribute to it. In analyzing space-based observations, such a complexity can partly be reduced focusing on some specific physical and optical prop-erties of these particles. In fact, continental aerosol is recog-nized to be mainly composed of fine particles (r<0.6 µm) so that their optical properties are strongly dominated by the aerosol fine fraction (e.g. Dubovik et al., 2002; Kaufman et al., 2002).
In this study we perform a seasonal analysis of the MODIS-derived AOT field over the Mediterranean region (land and ocean) to investigate the aerosol’s seasonal and
re-gional patterns. Moreover, we evaluate the contribution to the total AOT of continental and desert-dust aerosols over the Mediterranean basin (in addition to the maritime aerosol one). This result is obtained by implementing a simple scheme (hereafter referred to as “aerosol mask”) that com-bines the MODIS operational retrieval of the aerosol optical thickness with a second MODIS product (the fine fraction) indicating the relative contribution of the fine particles to the total AOT. The aerosol mask scheme is described in Sect. 2, together with examples of its application to specific case studies. In Sect. 3, results are presented in terms of season-ally averaged maps of both total AOT and relative AOT con-tributions of maritime, continental and desert dust aerosols. A summary of the aerosol seasonal variability is then given in Sect. 3.1, where regional analysis is performed by divid-ing the Mediterranean basin into ten different sectors. Es-timates of the aerosol mass load in the ten sectors of the Mediterranean basin are then given in Sect. 3.2. These have been obtained, for the three different aerosol types, employ-ing appropriate mass-to-extinction efficiencies (α=AOT/M) derived from lidar observations and model-based results. In order to focus Sect. 3.2 on the presentation and discussion of results, the procedure employed to derive the α factors is de-scribed in Appendix A. In Sect. 3.2, the Mediterranean sec-tors summary is also employed as a test of the aerosol mask capability to actually discriminate between the three aerosol types addressed in this study.
2 Methods
The Moderate Resolution Imaging Spectroradiometer (MODIS) was launched in December 1999 on the polar orbiting NASA-EOS Terra spacecraft. Terra’s sun-synchronous orbit has a dayside equatorial 10:30 am local crossing time. Since February 2000, MODIS data are acquired in 36 spectral bands from the visible to the thermal infrared. A nearly global image is produced daily thanks to the instrument scanning angle of 110◦(i.e. swath width of 2330 km). Aerosol retrievals from MODIS data are performed over land and ocean surfaces by means of two separate algorithms thoroughly described in Kauf-man and Tanr´e (1998). Aerosol products are stored in MODIS Level 2 (MOD04 L2) files, each corresponding to five-minute-acquisition along the satellite orbit. The two aerosol products employed in this study are: 1) the optical thickness at 550 nm (MOD04 L2 Scientific Data Set: Optical Depth Land And Ocean, in the following referred to as AOT) and 2) the fine fraction (MOD04 L2 Scientific Data Set: Optical Depth Ratio Small Ocean, in the following referred to as FF). This latter is defined as the ratio of optical thickness of small mode vs effective optical thickness at 550 nm. Both products are given at a spatial resolution of 10×10 km (at nadir). The AOT is provided over both land and ocean merging the two different Atmos. Chem. Phys., 4, 2367–2391, 2004 www.atmos-chem-phys.org/acp/4/2367/
retrievals developed for the two different surfaces. The fine fraction product is only operational over ocean surfaces (although Chu et al., (2003) showed that separation of fine and coarse particles over land is possible by comparing the path radiances at 660 and 470 nm). As discussed in detail in the MODIS aerosol products validation studies, a different accuracy is associated to the MODIS AOT retrievals over land (1AOTland=±0.05±0.2 AOT; Chu et al., 2002; Chu et
al., 2003) and over ocean (1AOTocean=±0.03±0.05 AOT;
Remer et al., 2002). Over land, errors larger than 1AOTland
can be found in coastal zones due to sub-pixel water contam-ination. This effect tends to produce an AOT overestimation (Chu et al., 2003). Over ocean, the validation by Remer et al. (2002) shows the major uncertainties to occur at small optical thickness, when the aerosol contribution to the measured radiance is low and surface contributions (as foam and water color) can be misinterpreted. Similarly, a significant water color contribution can reduce the ocean AOT retrieval quality in coastal areas. Largely based on Mediterranean test sites, the study by Remer et al. (2002) also indicates the particle size-dependent parameters (as the FF) to be retrieved with an accuracy within ±25%.
In this work, daily MODIS observations over the Mediter-ranean region (about three L2 files per day) were collected for the whole year 2001 (except for the period 15 June–3 July, due to instrumental problems). For each L2 file, AOT and FF data were binned into a 0.1◦×0.1◦ grid (i.e. about 10×10 km pixels), corresponding to the geographical area within the latitude and longitude ranges 30◦N–50◦N and 10◦W–35◦E, respectively. The derived 0.1-degree-binned AOT data were then averaged on a seasonal basis, the four seasons being defined as DJF (December-January-February, i.e. Winter), MAM (March-April-May, i.e. Spring), JJA (June-July-August, i.e. Summer), SON (September-October-November, i.e. Fall). Moreover, for each L2 file, AOT and FF data were jointly analyzed (in co-located 0.1-degree-bins) to distinguish between maritime, continental and desert dust aerosol following the method described in Sect. 2.1. Then, for each season, the contribution of the three aerosol types to the total, mean AOT was computed.
2.1 The aerosol mask
In order to reduce the complexity of the atmospheric aerosol system, some general categories can be identified on the ba-sis of the particles origin. In particular, over the Mediter-ranean, three main aerosol types are expected to dominate the atmospheric load: 1) maritime aerosol produced on the sea surface by winds; 2) continental aerosol originating in the industrialized countries surrounding the Mediterranean Sea from both anthropogenic and non-anthropogenic activi-ties (e.g. fossil fuel combustion, industrial activity, soil ero-sion); 3) desert dust lifted into the Mediterranean atmosphere from the North African arid regions. Produced by such dif-ferent mechanisms, these aerosol types generally show
sub-43
DE
SE
RT
D
UST
CONTINENTAL
M
ARIT
IME
0.0 0.1 0.2 0.3 0.4 0.5 0.6 0.7 0.8 0.9 1.0FINE FRACTION
0.0 0.1 0.2 0.3 0.4 0.5 0.6 0.7 0.8 0.9AEROSOL OPTICAL THICKNESS
Fig. 1. Aerosol mask defining the regions corresponding to
con-tinental, desert dust and maritime aerosol (green, yellow and blue areas, respectively) in the Fine Fraction (FF) versus Aerosol Optical Thickness (AOT) space.
stantially different optical and physical properties (e.g. Kauf-man et al., 2002). In fact, in urban/industrial conditions, op-tical properties are dominated by fine particles (e.g. Remer and Kaufman, 1998; Dubovik et al., 2002) while, in the pres-ence of desert dust, these are strongly dominated by coarse particles. In maritime conditions, the relative contribution of coarse particles, although variable (Smirnov et al., 2002), is generally higher than in urban/industrial conditions and lower than for desert dust (e.g. Dubovik et al., 2002).
Following the previous considerations, we implemented a simple method (aerosol mask) to separate the contribution of the three aerosol types over the Mediterranean Sea, based on the combination of the MODIS AOT and FF data. In par-ticular, we proceeded with defining which regions of the FF vs. AOT space would be peculiar to the three aerosol types. The following considerations were taken into account to de-fine the three regions limits shown in Fig. 1 (blue, green and yellow portions corresponding to maritime, continen-tal and desert dust aerosol, respectively). As opposite to remote oceanic regions, it is particularly difficult to define “pure maritime conditions” in inland seas as the Mediter-ranean. Avoiding the most turbid conditions (associated to Saharan dust transport), in the Mediterranean one can dis-tinguish between clean atmospheres, when AOT values are close to the ones registered in background oceanic regions (i.e. AOT≤0.1), and “standard” atmospheres, wherein the mean AOT is in the range 0.2–0.3 (Smirnov et al., 1995, 2002). Although the latter values can appear as rather high if compared to the ones typical of open oceanic areas, a mean AOT of 0.29 ±0.22 is actually found when averaging the www.atmos-chem-phys.org/acp/4/2367/ Atmos. Chem. Phys., 4, 2367–2391, 2004
2370 F. Barnaba and G. P. Gobbi: Aerosol seasonal variability over the Mediterranean region 11 AOT values referring to the Mediterranean Sea and
col-lected by Smirnov et al. (2002) on the basis of 30 years of published data. This average value becomes 0.18±0.11 when AOTs>0.5 are not considered as possibly “contaminated” by non-maritime aerosols. We have therefore set to 0.3 the up-per limit of maritime AOT in our scheme. Due to the vari-ability of both meteorological conditions (relative humidity, mean wind speed) and contamination sources (dust, smoke, urban-industrial aerosols), a significant spread is generally observed in the relative weight of fine and coarse particles in maritime environments. Over the Atlantic and the Pacific Ocean (to which most observations in the literature refer), the fine aerosol contribution to the total AOT is found to reach values up to about 70% (e.g. Kaufman et al., 2001; Kaufman et al., 2002). In our scheme, we have allowed the fine frac-tion of maritime aerosol to vary up to 0.8 (see Fig. 1). These assumptions would classify as “maritime aerosol” both dusty conditions with AOT<0.3 and continentally-affected condi-tions with AOT<0.3 and FF<0.8. This choice avoids defi-nition of areas of “uncertain aerosol type” in Fig. 1 and pre-vents us from over predicting the presence of both continen-tal and/or desert dust particles over the Mediterranean. Being very simple, this scheme is certainly associated to some mar-gin of error (i.e. incorrect aerosol type interpretation), par-ticularly at the border lines of the three regions. In this re-spect, the outcome of the aerosol mask will be evaluated on the basis of specific cases registered in 2001 in the follow-ing section, whereas the overall (statistical) performance of this scheme will be assessed on the basis of the whole 2001 record in Sect. 3.1.
2.2 Individual tests of the aerosol mask
Four cases are presented to show the response of the aerosol mask to different aerosol conditions. The latter have been evaluated on the basis of both satellite true-color images (SeaWiFS Mediterranean pictures, as composite of im-ages acquired approximately between 10:00 and 13:00 UT, i.e. almost in coincidence with the MODIS overpass) and wind fields at 700 mb, 850 mb and 925 mb (images from the NOAA CIRES Climate Diagnostic Center, based on NCEP/NCAR re-analysis, Kalnay et al., 1996). Wind fields are found to be particularly useful in evaluating the trans-port of continental aerosols. In fact, as opposite to desert dust transport (mostly associated to high AOTs), pollution-related plumes are often associated to low aerosol optical thicknesses. In such conditions, the limited aerosol load in the atmospheric column does not allow its identification in the true-color images. This also means that, in these cases, the fine fraction parameter plays a major role in the aerosol type classification.
The first test case, reported in Fig. 2, refers to 26 March 2001, when a dust plume was blown eastward from the Tunisian/Libyan coasts. The SeaWiFS image (Fig. 2a) clearly reveals the geographical extension of the dust plume
moving northeast through the Central Mediterranean and reaching up to the Black Sea. The outcome of the aerosol mask applied to this event is shown in Fig. 2b. Here the pro-posed method appears to reproduce the dust pattern over the Mediterranean. In particular, the southern (cloud-free) edge of the dust plume is well identified (note that in this plot, and in the following case studies, the green border line between the yellow dust plume and the blue maritime aerosol region is falsely produced by the graphical interpolation. In fact, no green border is visible when the dust plume is bounded by black, i.e. unclassified, regions). As opposed to Saha-ran dust, the mask-derived presence of continental aerosols in Fig. 2b (revealed at the eastern coasts of Spain and over the Gulf of Lion, South France) is not as evident in the Sea-WiFS image. An explanation of the aerosol mask outcomes can be derived considering the relevant wind field shown in Fig. 2c. In this plot, the westerly circulation affecting both Spain and Southern France is likely to transport continental aerosols from those regions over the Mediterranean Sea. The wind field in Fig. 2c also confirms the dust advection over the Central/Eastern Mediterranean and further indicates the dust transport to mainly occur at the upper levels. In par-ticular, winds mainly drive dust from Libya to the Eastern Mediterranean at 850 mb (central panel) while strong winds (v>16 m/s) from Algeria and Tunisia also advect dust to the Central Mediterranean at 700 mb (bottom panel).
The second case, reported in Fig. 3, refers to the following day, i.e. 27 March, when some residual dust was still uplifted eastward from the Libyan coasts as revealed by the SeaW-iFS image. The corresponding outcome of the aerosol mask reported in Fig. 3b shows that the dust plume from Libya is well detected. Agreement between Fig. 3a and b is also found over the Black Sea and in the Cyprus region, where both the true color SeaWiFS image and the aerosol mask re-veal the presence of dust. In this case, wind fields in Fig. 3c indicate the dust transport to mainly occur at upper levels (P<850 mb), a piece of information that cannot be derived from the true color image of Fig. 3a on its own. Although no evidence of haze is visible in Fig. 3a, the aerosol mask indi-cates aerosol of anthropogenic origin off the Sardinian coasts in Fig. 3b. Westerly winds flowing over the island (Fig. 3c) are compatible with this result.
The third case, reported in Fig. 4, refers to 1 August 2001. The SeaWiFS picture in Fig. 4a shows two differ-ent conditions characterizing the Western and the Eastern Mediterranean, respectively. A well defined dust plume is visible in Fig. 4a, extending from North West Africa north-ward to Spain and eastnorth-ward tonorth-wards Sardinia. Conversely, the Eastern Mediterranean is covered by an inhomogeneous haze layer. The outcome of the relevant aerosol mask is re-ported in Fig. 4b. Here, the presence of dust is well identi-fied. In particular, the north-eastern edge of the dust plume visible in Fig. 4a is well reproduced in Fig. 4b. In the lat-ter, dust is also detected over the Gulf of Biscay (Northern Spain), a region covered by clouds in Fig. 4a but definitely Atmos. Chem. Phys., 4, 2367–2391, 2004 www.atmos-chem-phys.org/acp/4/2367/
Figure 2 (a) (b) (c)
Fig. 2. Conditions over the Mediterranean on 26 March 2001: (a) True color image (from SeaWiFS), (b) corresponding aerosol mask
outcome from MODIS FF and AOT data (blue, green and yellow areas corresponding to maritime, continental and desert dust aerosol, respectively), and (c) mean daily composite wind fields at 925, 850 and 700 mb (top, central and bottom panel, respectively; the color bar indicates the wind speed in m/s; data from NOAA-CIRES based on NCEP/NCAR reanalysis).
Figure 3
(a)
(b)
(c)
Fig. 3. As in Fig. 2 but case of 27 March 2001.
2372 F. Barnaba and G. P. Gobbi: Aerosol seasonal variability over the Mediterranean region Figure 4
(a)
(b)
(c)
Fig. 4. As in Fig. 2 but case of 1 August 2001.
subject to advection from the North West Saharan regions (i.e. Fig. 4c). In the Eastern Mediterranean the aerosol mask identifies a dominance of continental particles corresponding to the hazy region in Fig. 4a. The origin of such haze is sug-gested by the wind maps of Fig. 4c. In fact, a North-easterly flow characterizes the Eastern Mediterranean at lower lev-els (925, 850 mb), with the strongest winds (v≥8 m/s) in the region within Southern Italy and Crete. This advection pattern is likely to transport over the Mediterranean anthro-pogenic aerosol from Eastern Europe (Romania, Bulgaria) and Turkey and is therefore consistent with the aerosol mask results of Fig. 4b. As a matter of fact, in August 2001 the Mediterranean Intensive Oxidant Study (MINOS) conducted in Crete (Lelieveld et al., 2002) well highlighted the strong advection of pollutants over the Mediterranean caused by the northerly transport occurring at the lower levels (Sciare, 2003a). It is worth noticing that, in contrast to the pollution advection pattern occurring at the lower levels, the wind field in Fig. 4c indicates dust transport over the Western Mediter-ranean to mainly occur at the higher levels (850, 700 mb).
The fourth case study reported in Fig. 5 refers to 13 Oc-tober 2001. The SeaWiFS true color image in Fig. 5a re-veals a complex atmospheric pattern over the Mediterranean with the presence of both dust and haze, characterizing the western and eastern basin, respectively. In addition, a hazy layer is visible over the Po Valley region (Northern Italy), the Italian east coasts and, partially, over the Adriatic Sea. The corresponding outcome of the aerosol mask derived from
MODIS data is reported in Fig. 5b. This latter clearly depicts the dust plume transported northward from Algeria and well reproduces both the east and west plume edges. Both East-ern Mediterranean and Adriatic Sea haze layers of Fig. 5a are mainly interpreted as continental aerosol in Fig. 5b. How-ever, some minimal misinterpretation of haze as dust is ob-served. This is mainly produced by the fine fraction being lower than 0.7 in those regions. As mentioned in Sect. 2.1, some percentage of misinterpreted pixels was expected to be associated to the proposed aerosol mask. For this day, wind fields in Fig. 5c suggest advection patterns transporting con-tinental aerosol South-westward to the Mediterranean basin at the lower levels (from Turkey, Bulgaria, Greece) and Sa-haran dust transported higher up in the atmosphere from the African continent. In this respect, the four cases presented confirm the general particle type-dependent aerosol vertical displacement observed by lidar at a Central Mediterranean site (Gobbi et al., 2004), with desert dust dominating the al-titude range 2–6 km and continental aerosol prevailing in the boundary layers.
Overall, these results indicate that the aerosol mask per-forms rather well at distinguishing between maritime, con-tinental and desert dust aerosol on the basis of the standard MODIS AOT and FF products. This approach was therefore employed to estimate seasonal contributions of each aerosol type to the total AOT over the Mediterranean. Relevant re-sults are discussed hereafter.
Figure 5
(c)
(a)
(b)
Fig. 5. As in Fig. 2 but case of 13 October 2001.
3 Results and discussion
Results of the data analysis are reported in Figs. 6 to 9, referring respectively to the four seasons DJF, MAM, JJA and SON. In each figure, plot a) shows the total mean sea-sonal aerosol optical thickness (AOTSat 550 nm, given over
both land and ocean) whereas plots b), c) and d) show the mean contribution to AOTSof, respectively, maritime, desert
dust and continental aerosol over the basin (AOT∗S
,type, the
subscript “type” indicating continental (“cont”), maritime (“mar”) or desert dust (“dust”) aerosols). A detailed defini-tion of the variables AOTSand AOT∗S,typeis given hereafter.
A synopsis of the whole set of aerosol optical thickness vari-ables discussed in this study is provided in Table 1.
For each 0.1◦×0.1◦pixel, the AOT average over the sea-son S, AOTS, is defined as:
AOTS= 1 NS NS X j=1 AOTj (1)
where NS is the total number of AOT retrievals (AOTj)in
the season S.
Over the ocean, an aerosol type (continental, maritime or desert dust) is associated to each retrieved AOTj employing
the mask described in Sect. 2.2. Therefore, for each season S (and for each ocean pixel), the mean AOT associated to the three aerosol types is computed as:
AOTS,type= 1 NS,type NS ,type X j=1 AOTtype,j (2)
where NS,type is the total number of AOTs classified as
“type” (i.e. AOTtype,j) in that pixel during the season S. For each ocean pixel, the seasonal frequency of occurrence of each aerosol type, fS,type, is
also derived as fS,type=NS,type/NS (thus resulting fS,cont+fS,mar+fS,dust=1). This parameter allows one
to calculate the mean seasonal contribution of each aerosol type to the total AOTS as:
AOTS,type
∗
=fS,type·AOTS,type (3)
Therefore we have, for each pixel, AOTS=AOT∗S,cont+AOTS∗,mar+AOT∗S,dust.
In Figs. 6a to 9a, missing data (black areas) are found over bright surfaces (e.g. scarcely vegetated areas or regions cov-ered by snow) where the MODIS retrieval is not performed (Kaufman et al., 1997) or in regions corresponding to a per-sistent presence of clouds during the whole season. In gen-eral, occurrence of cloudy pixels in the investigated region www.atmos-chem-phys.org/acp/4/2367/ Atmos. Chem. Phys., 4, 2367–2391, 2004
2374 F. Barnaba and G. P. Gobbi: Aerosol seasonal variability over the Mediterranean region 0.1 0.15 0.20 0.25 0.30 0.35 0.40 0.45 0.10 0.15 0.20 0.25 0.05 0.075 0.10 0.125 0.15 0.05 0.075 0.10 0.125 0.15 (a) (b) (c) (d) maritime continental desert dust
Fig. 6. (a) Winter (DJF) mean seasonal aerosol optical thickness at 550 nm (AOTDJ F, given over both land and ocean) and mean contribution
to AOTDJ F of maritime (b), desert dust (c), and continental (d) aerosol over the basin (AOT∗DJ F,mar, AOT∗DJ F,dustand AOT∗DJ F,cont, respectively, with AOTDJ F=AOT∗DJ F,mar+AOT∗DJ F,dust+AOT∗DJ F,cont). Black regions in plot a) (missing data) correspond to bright
surfaces (e.g. sand, snow) or areas with persistent cloud cover during the season.
0.1 0.15 0.20 0.25 0.30 0.35 0.40 0.45 0.05 0.075 0.10 0.125 0.15 0.05 0.075 0.10 0.125 0.15 0.10 0.15 0.20 0.25 (a) (b) (c) (d) maritime continental desert dust
Fig. 7. As in Fig. 6 but for the Spring season (MAM).
0.1 0.15 0.20 0.25 0.30 0.35 0.40 0.45 0.05 0.075 0.10 0.125 0.15 0.05 0.075 0.10 0.125 0.15 0.10 0.15 0.20 0.25 (a) (b) (c) (d) maritime continental desert dust
Fig. 8. As in Fig. 6 but for the Summer season (JJA).
0.1 0.15 0.20 0.25 0.30 0.35 0.40 0.45 0.10 0.15 0.20 0.25 0.05 0.075 0.10 0.125 0.15 0.05 0.075 0.10 0.125 0.15 (a) (b) (c) (d) maritime continental desert dust
Fig. 9. As in Fig. 6 but for the Fall season (SON).
2376 F. Barnaba and G. P. Gobbi: Aerosol seasonal variability over the Mediterranean region
Table 1. Synopsis of the whole set of variables employed to describe the variability of the aerosol optical thickness.
34
Table 1. Synopsis of the whole set of variables employed to describe the variability of the
aerosol optical thickness .
Variable Definition Description
S AOT
∑
= = S j j S S N 1 AOT N 1AOT Pixel (0.1°×0.1°) seasonal average AOT. NS is the pixel total
number of AOT retrievals (AOTj) in the season S.
type , AOTS
∑
= = , type N 1 type, type , type , AOT N 1 AOT S j j S SPixel (0.1°×0.1°) seasonal average AOT associated to each aerosol type. NS, type is the pixel total number of AOTj
classified as “type” (i.e, AOTtype,j) during the season S. *
type ,
AOTS , type , type
* type
, AOT
AOTS = fS ⋅ S
Mean seasonal contribution of each aerosol type to the pixel AOTS. For each pixel, it is AOTS = AOT*S,cont + AOT*S,mar +
AOT*
S,dust being fS, type = NS,type / NS (with fS,cont + fS,mar + fS,dust
= 1).
Analysis by Sectors of the Mediterranean basin (e.g. Sect. 3.1)
SEC , AOTS
∑
= = PSEC 1 P P , SEC SEC , AOT P 1 AOT k k SS Sector (SEC) seasonal (S) average AOT. Pk is the k
th pixel in sector SEC; PSEC is the total number of pixels in SEC.
type SEC, , AOTS
∑
= = P type,SEC 1 P P type, , SEC type SEC, , AOT P 1 AOT k k S SSector (SEC) seasonal (S) average AOT associated to each aerosol type. Pk is the kth pixel in sector SEC; Ptype, SEC is the
total number of pixels in SEC in which the parameter
AOTS,type is defined; PSEC is the total number of pixels in the
sector SEC (independent from aerosol type).
* type SEC, , AOTS
∑
= = type,SEC P 1 P * P type, , SEC * type SEC, , AOT P 1 AOT k k S SMean seasonal (S) contribution of each aerosol type to the sector AOTS, SEC. Pk is the kth pixel in SEC; Ptype, SEC is the
total number of pixels in SEC in which the parameter
AOTS,type (and thus AOT*S,type) is defined; PSEC is the number
of pixels in SEC. For each sector it is AOTS,SEC =
AOT*
S,SEC,cont + AOT*S,SEC,mar + AOT*S,SEC,dust
SEC in type , AOTS
∑
= = P type,SEC 1 P , type, P SEC type, SEC in type , P AOT 1 AOT k k S SSeasonal (S) average AOT associated to each aerosol type averaged regionally only over those pixels in sector SEC where the aerosol type is detected (Ptype, SEC). Being Ptype, SEC ≤ PSEC, it is AOTS, type in SEC ≠ AOTS, SEC, type..
strongly depends on the season and latitude. During 2001, minimum incidence of clouds (mean cloud fraction ≤20%) was registered in Summer in the Eastern part of the Mediter-ranean basin (latitudes <40◦N, longitudes >15◦E) while maximum incidence of clouds (mean cloud fraction ≥70%) was registered in Winter above 44◦N. We therefore believe
that the seasonal averages presented provide reliable statis-tics even in the worst cases of highest cloud occurrence (i.e. about 30% of successful retrievals).
Comparison of the four a)-plots in Figs. 6 to 9 reveals the strong seasonal cycle of the aerosol optical thickness all over the Mediterranean, with the lowest AOT observed in Winter and maximum AOT values registered in Spring-Summer. These latter are possibly related to the increase of
both photochemical and convective activity registered dur-ing the warmest months of the year. For example, in cen-tral Italy, the higher AOT values observed in Spring-Summer are associated to aerosol extending up to altitudes of 3–4 km while in the Winter months lower AOT are registered with aerosols confined below 2 km (Gobbi et al., 2004). The mod-eling study of Duncan and Bey (2004) also highlights the important role of convection as a pathway to the export of European pollution to the middle troposphere in summer. It is also worth mentioning that surface aerosol mass measure-ments (PM2.5 and PM10) performed all over Europe (Van Dingenen et al., 2004; Putaud et al., 2004) generally show a different trend with maxima during the cold seasons, partic-ularly at polluted sites. In fact, in the winter months a larger
condensation of semi-volatile species is expected (Van Din-genen et al., 2004) and, in addition, the low convective activ-ity is likely to keep the aerosol particles in the lowest levels where these are sampled. Conversely, in the warmer months, both reduced RH at the ground and convection-driven mixing of atmospheric particulate to the higher levels translate into a lower amount of aerosol mass being measured by in situ samplers at the ground. These results confirm that knowl-edge of the vertical distribution of the particles is necessary to correlate aerosol columnar quantities (as the AOT) to par-ticulate measurements (as PM) at the ground (e.g. Chu et al., 2003; Wang and Christopher, 2003).
Another general feature emerging from Figs. 6a–9a is the impact of some major European cities and/or industrialized areas. The Po Valley (i.e. the most industrialized region in Italy) is the most evident case of such an effect. An increase in AOT is also evident for example in the Hungarian region and over main urban sites as Marseille in France, Rome and Naples in Italy, and Thessaloniki in Greece. Overall, the AOT pattern observed in plots a) of Figs. 6–9 can be well related to anthropogenic sources as suggested by recent stud-ies performed by Robles Gonzales et al. (2003) and Schaap et al. (2004) by means of chemical-transport models. These studies (in which sea salt and dust aerosol types are not con-sidered) show the AOT field over Europe to be strongly re-lated to the distribution of inorganic aerosol precursor emis-sions (sulfates, nitrates). For example, the Po Valley and the Eastern Europe region (e.g. Hungary, Bulgaria) are shown to be characterized by higher concentrations of NO3and/or
SO4 and SO2 with respect to Western Europe, where high
values of these constituents are only found in the northern coast of Spain. In Figs. 6a–9a, the high AOT values over the Nile-delta region are likely affected by water contamination. The winter plots of Fig. 6 show the AOT in the Mediter-ranean region to be mostly confined below 0.15–0.20, with higher values over land only registered in Northern Italy, Western France and in the Hungarian region. AOT values higher that 0.15 over the Mediterranean Sea are mainly re-lated to some Saharan dust transport events as revealed by Fig. 6c. However, minimum incidence of long range dust transport is registered in this season, in agreement with the seasonal analysis by Gobbi et al. (2004) performed employ-ing lidar data collected at Rome in the year 2001. Fig-ure 6d reveals some advection of continental aerosol over the Mediterranean with larger impact in the North and North-Eastern regions. This pattern is compatible with the domi-nance of Westerlies over the Mediterranean in Winter (e.g. Stohl et al., 2002).
Opposite to the winter case, the Spring plots of Fig. 7 show a mean Mediterranean AOT generally higher than 0.15 over both land and ocean. In the Po Valley region AOT reaches values higher than 0.45, almost double with respect to Win-ter. Figures 7c and d reveal that both dust and continental aerosols contribute to the high AOT values observed over the Mediterranean and the Black Sea. In particular, a major
im-pact of Saharan dust is evident over the Eastern and the Cen-tral Mediterranean, while advection of continental aerosol mainly affects Western and Central Mediterranean as well as the North Atlantic (Bay of Biscay) and the Black Sea. It is worth mentioning that, by exploiting the polarization capa-bilities of the POLDER instrument, Tanr´e et al. (2001) high-lighted a maximum impact of pollution events over central Europe in Spring. However, in that study July and August data were not available. Comparison of Figs. 7a and c shows the contribution of dust to the total AOT to reach 60% close to the Libyan and Egyptian-Israeli coasts. A similar contri-bution by continental aerosol is found to the North of Spain, in the Black Sea and in the Northern Adriatic Sea (right in the outflow of the Po Valley region).
As already pointed out, maximum aerosol optical thick-ness values are reached in Summer (Fig. 8), with AOT>0.2 prevailing over both the European continent and the Mediter-ranean basin. Actually, the summer AOT field of Fig. 8a compares quite well with the one retrieved at 555 nm by Rob-les GonzaRob-les et al. (2003) employing August 1997 data col-lected by the ATSR-2 radiometer on board the ESA ERS-2 platform. Overall, model calculations performed over Eu-rope for the summer period (August) by Robles Gonzales et al. (2003) suggest a maximum contribution of nitrates and sulphates to the total AOT (at 555 nm) of 10% and 70%, respectively. Figure 8a shows a particular AOT increase with respect to Spring over Eastern Europe (AOT>0.3 over Hungaria, Romania, Ukraine). This effect is possibly con-nected to the frequent biomass burning events that occurred in Eastern Europe in the Summer 2001 (e.g. Salisbury et al., 2003; Sciare et al., 2003b). It is worth mentioning that, al-though not specifically addressed in this study, biomass burn-ing episodes are likely to be classified as continental aerosol in our scheme. In fact, these are characterized by high AOT associated to a large fraction of fine particles (e.g. Dubovik et al., 2002). In Fig. 8a, high AOT values are observed in Crete and in the Southeastern European coastal regions (mainly Greece and Turkey). Some water contamination in land pix-els and water color impact on the ocean pixpix-els are likely re-sponsible for this effect. It is however worth mentioning that the observed MODIS AOT as high as 0.4 (±0.13) in Crete and along the Turkish coasts are still compatible with the AERONET data (http://aeronet.gsfc.nasa.gov). In fact, the AERONET quality assured AOT values available for those areas in this period of the year show a mean AOT=0.23±0.08 in the FORTH-Crete site (35.3◦N, 25.7◦E, Crete, Greece,
August 2003) and a mean AOT=0.44±0.24 in the IMS-METU-Erdemli coastal site (36.6◦N, 34.2◦E, Turkey,
Au-gust 2000). Figure 8d shows the Summer impact of con-tinental aerosol (maximum of the year) to extend all over the basin, with particular strength over the Central and East-ern Mediterranean (with the exception of the area South of Cyprus). These results are in agreement with the recent anal-ysis of the Angstrom exponent variability over the Mediter-ranean obtained by Jamet et al. (2004) from neural network www.atmos-chem-phys.org/acp/4/2367/ Atmos. Chem. Phys., 4, 2367–2391, 2004
2378 F. Barnaba and G. P. Gobbi: Aerosol seasonal variability over the Mediterranean region inversion of SeaWiFS data for the year 2000. Overall, the
AOT pattern in Fig. 8d suggests a prevalent northerly flow in the lower layers, where transport of pollutants mainly occurs (e.g. Stohl et al., 2002). In this respect, an extensive anal-ysis of air mass trajectories in the Mediterranean during the MINOS campaign (August 2001) presented by Lelieveld et al. (2002), revealed a dominant northerly flow below 4 km, confirming the results by Stohl et al. (2002) and Duncan and Bey (2004) of a Summer southward flow of European pollu-tion over the Mediterranean basin and Africa. Conversely, in the middle and upper troposphere (i.e. in the region where the Saharan dust transport mainly occurs), Lelieveld et al. (2002) found westerly/southerly winds to prevail. In fact, similarly to the Spring case (Fig. 7), the Summer continental aerosol distribution in the Mediterranean basin appears to comple-ment the Saharan dust one (Figs. 8c and d). In particular, continental aerosol dominate the Central and Eastern basin whereas a major impact of dust is observed in the Central-Western Mediterranean. With respect to the Spring condi-tions, a Summer westward shift of Saharan dust transport is thus observed in 2001. This is in agreement with the gen-eral pattern of dust transport over the Mediterranean emerg-ing from multi annual analysis of satellite data (Moulin et al., 1998; Israelevich et al., 2002). It is also worth noticing that the minor impact of both continental and dust aerosol over the South-eastern Mediterranean (south of Cyprus) veals the large maritime contribution to the AOT in this re-gion (Fig. 8b). A Summer increase in biogenic (marine phy-toplankton) sulphate aerosols could account for such result. In fact, an important impact of biogenic sulphur is found in the Summer Eastern Mediterranean atmosphere, even though the major source of sulphate in this region is still assigned to long-range transport (Ganor et al., 2000; Kouvarakis et al., 2002).
Figure 9 shows the substantial reduction of the Fall AOT average with respect to the Summer one. However, AOT values as high as 0.2 are still observed over a large part of the European continent (e.g. Western France, Northern Italy, Hungarian region) as well as over Southern Mediterranean. In this latter region AOT values are affected by Saharan dust whose contribution to the total AOT is still of the order of 50%, and even larger close to the African coasts (Fig. 9c). While a minimum impact of Saharan dust is observed in win-ter (Fig. 6c), the minimum impact of continental aerosol is registered in Fall (Fig. 9d), with residual continental influ-ences mainly visible in the Northern Adriatic Sea (outflow of the Po Valley region) and in the Greek Halkidiki peninsula. In this respect, it is worth mentioning a further factor playing a major role in determining the observed aerosols seasonal pattern: precipitation, i.e. the most efficient removal process of atmospheric particulate. In fact, the observed seasonal pat-tern of the Mediterranean AOT should also be interpreted in connection to the seasonal and latitudinal pattern of precip-itation in the Mediterranean (e.g. Mariotti et al., 2002). In particular, even considering the mentioned increase of
pho-tochemical and convective activity in Spring-Summer, the higher mean AOT registered in this period of the year is also a consequence of a minimum aerosol scavenging by precip-itation. Conversely, the higher precipitation rate registered over the Mediterranean in Fall and Winter (particularly at latitudes ≥40◦N) tends to reduce the mean residence time of aerosols in the atmosphere, and, in turn, the mean AOT. In the case of non-local aerosol (e.g. continental aerosol trans-ported over the Mediterranean), this precipitation effect is expected to be even more evident. In fact, when aerosols travel time is comparable to the mean time interval between two rain events, the advection-related aerosol load cannot be completely re-established (e.g. Bergametti et al., 1989). In-terestingly, during the year 2001 the highest seasonal rain rates (Rr) over the Mediterranean basin were registered in
Fall (Rr mean values higher than 2 mm/day) with maximum
values (Rr>3 mm/day) over the Adriatic Sea, the Balearic
Is-lands and the Cyprus region. In Winter the mean Rrover the
basin was 1.5–2.5 mm/day whereas the Spring and Summer means were Rr<1 and Rr<0.5 mm/day, respectively (data
from NCEP/NCAR reanalysis).
3.1 Mediterranean AOT data summary
To provide a summary of the seasonal and regional variabil-ity discussed so far, aerosol optical thicknesses averaged over both season and Mediterranean sectors were computed and are reported in Table 2. Regional averages have been per-formed considering the Mediterranean basin as divided into the ten sectors (SEC) shown in Fig. 10. These were selected to define a Western, Central and Eastern Mediterranean basin (longitudinal partitions at 8◦and 21◦W) and to facilitate the evaluation of North-to-South AOT gradients (latitudinal par-titions at 35◦, 38◦ and 41◦N). A detailed definition of the
variables reported in Table 2 is given hereafter. Tables 2a, b, c, and d refer to the Winter, Spring, Summer and Fall av-erages, respectively. The seasonal averages AOTS,type and
AOT∗S
,type (see Figs. 6–9b, c, d) defined in Table 1 and
de-rived for each ocean pixel, were averaged regionally. This is, for the ten sectors of Fig. 10 the following quantities were computed: AOTS,SEC,type= 1 PSEC Ptype,SEC X Pk=1 AOTS,type,Pk (4) AOTS,SEC,type ∗= 1 PSEC Ptype,SEC X Pk=1 AOTS,type,Pk ∗ (5)
where the subscript Pkindicates the k-th pixel in sector SEC;
Ptype,SEC is the total number of pixels in SEC in which the
parameter AOTS,type(and AOT∗S,type) is defined; and PSECis
the total number of pixels in the sector SEC (independent of the aerosol type).
It is worth noticing that, since an aerosol type is not neces-sarily detected in the whole sector during a season (i.e. being Atmos. Chem. Phys., 4, 2367–2391, 2004 www.atmos-chem-phys.org/acp/4/2367/
Fig. 10. The ten sectors of the Mediterranean basin employed in the analysis. The relative area of each sector (in percent) is 4.7, 8.1, 9.2,
11.3, 3.1, 7.8, 12.6, 10.2, 13.4, 19.6, respectively.
Ptype,SEC≤PSEC), the quantity AOTS,SEC,type does not
coin-cide with AOTS,type in SEC, i.e. the AOT averaged only over
the pixels classified as “type” in sector SEC
(it is : AOTS,SEC,type= 1 PSEC Ptype,SEC X Pk=1 AOTS,type,Pk≤ ≤ 1 Ptype,SEC Ptype,SEC X Pk=1
AOTS,type,Pk=AOTS,type in SEC).
For example: the quantity AOTDJ F,5,dust in Table 2a
is the desert dust average AOT over the whole sector 5 in winter (0.18±0.07). However, since only a fraction of sector 5 was covered by dust, AOTDJ F,5,dust is smaller
than the mean AOT of dust events in that sector, i.e. AOTDJ F,dust in 5 (0.44±0.11). For completeness, the whole
set of AOTS,type in SEC values are also given in Table 2 (in
parentheses).
Data presented in Table 2 clearly show the following: 1. A seasonal pattern of the aerosol optical thickness in
the Mediterranean, with mean AOT values (AOTS,SEC)
spanning the range 0.12–0.14 in Winter, 0.17–0.28 in Spring, 0.20–0.28 in Summer and 0.15–0.26 in Fall. 2. A seasonal cycle of dust distribution within the basin,
associated to a South-to-North gradient. In fact, a Spring maximum dust impact is found in the Eastern-Central Mediterranean (AOTMAM,SEC,dust>0.45, with
dust percentage AOT contribution >40 % in Sectors 10-8 and 9-7-4, respectively). In Summer and Fall
dust maxima shift to the Central-Western Mediterranean (AOTJ J A,SEC,dust and AOTSON,SEC,dust≥0.44 in
Sec-tors 9-7-4, and 6-3, with dust percentage contribu-tions to AOT ≥28%). In Winter a residual dust ac-tivity is registered in the Western part of the basin (AOTDJ F,SEC,dust≥0.32 in sectors 6-3-1) but in the
South-Eastern Mediterranean the beginning of a “new cycle” is also detected (AOTDJ F,SEC,dust=0.37 in
Sec-tor 10).
3. A transport of continental aerosol from the European continent over the basin with maximum impact along the coastal regions. In fact, the highest contribution of continental particles to the total AOT is found in Sectors 2 and 5 in Winter (>30%), in Sectors 1, 2, 5 in Spring (≥35%), in Sectors 1, 2, 4, 5, 8 in Summer (≥43%) and again in Sectors 2 and 5 in Fall (≥19%).
A graphical representation of these patterns in terms of aerosol mass is provided in the following Sect. 3.2.
In the case of desert dust, the results obtained for the year 2001 and reported in Table 2 can be compared to the 11-year climatology (from 1984 to 1994) obtained by Moulin et al. (1998). In that study, seasonal averages of the optical thickness due to Saharan dust over the Western, Central and Eastern Mediterranean were computed on the basis of daily analysis of Meteosat images. To be compared to the Moulin et al. (1998) data, the dust contribution to the total AOT in the Western (SEC=1, 3, 6), Central (SEC=2, 4, 7, 9) and East-ern (SEC=5, 8, 10) Mediterranean can be computed by aver-aging the AOT∗
S,SEC,dustvalues in Table 2 over the relevant
2380 F. Barnaba and G. P. Gobbi: Aerosol seasonal variability over the Mediterranean region
Table 2a. Winter AOTS,SEC,type and AOT∗S
,SEC,type averages (S=DJF) and relevant standard deviations (s.d.) computed for the ten sectors of Fig. 10 and for the three aerosol types as indicated in Sect. 3.1. For completeness, the AOTS,type in SEC values corresponding to the AOTS,SEC,type ones are also reported. Moreover, being the mean seasonal AOT in each sector given by AOTS,SEC=AOT∗S,SEC,cont+AOT∗S,SEC,mar+AOT∗S,SEC,dust, the values AOT∗S,SEC,type/AOTS,SEC(in percent) are also reported in the Table, indicating the relative contribution of each aerosol type to the seasonal AOT in the sector.
35 Table 2a. Winter AOTS, SEC, type and AOT*S, SEC, type averages (S = DJF) and relevant standard
deviations (s. d.) computed for the ten sectors of Fig. 10 and for the three aerosol types as indicated in Appendix A. For completeness, the AOTS, type in SEC values corresponding to the
AOTS, SEC, type ones are also reported. Moreover, being the mean seasonal AOT in each sector
given by AOTS, SEC = AOT*S, SEC, cont + AOT*S, SEC, mar + AOT*S, SEC, dust, the values AOT*S, SEC,
type / AOTS, SEC (in percent) are also reported in the Table.
AOTDJF, SEC, type ± s. d. (AOTDJF, type in SEC ± s. d.)
AOT*
DJF, SEC, type± s. d. (AOT*
DJF, SEC, type /AOTDJF, SEC) in % Sector
dust continental maritime dust continental maritime
AOTDJF, SEC ± s. d. 1 0.32 ± 0.09 (0.41 ± 0.10) 0.13 ± 0.05 (0.13 ± 0.06) 0.12 ± 0.02 (0.12 ± 0.02) 0.03 ± 0.01 (22%) 0.02 ± 0.01 (14%) 0.09 ± 0.02 (64%) 0.14 ± 0.02 2 0.27 ± 0.14 (0.45 ± 0.18) 0.14 ± 0.06 (0.15 ± 0.06) 0.11 ± 0.02 (0.11 ± 0.02) 0.02 ± 0.02 (15%) 0.04 ± 0.02 (31%) 0.07 ± 0.02 (54%) 0.13 ± 0.04 3 0.32 ± 0.21 (0.50 ± 0.26) 0.11 ± 0.08 (0.11 ± 0.08) 0.11 ± 0.02 (0.11 ± 0.02) 0.02 ± 0.02 (17%) 0.02 ± 0.01 (17%) 0.08 ± 0.02 (66%) 0.12 ± 0.03 4 0.30 ± 0.15 (0.47 ± 0.19) 0.14 ± 0.06 (0.15 ± 0.06) 0.12 ± 0.02 (0.12 ± 0.02) 0.02 ± 0.02 (14%) 0.03 ± 0.01 (22%) 0.09 ± 0.02 (64%) 0.14 ± 0.02 5 0.18 ± 0.07 (0.44 ± 0.11) 0.13 ± 0.05 (0.14 ± 0.06) 0.11 ± 0.04 (0.12 ± 0.04) 0.02 ± 0.03 (16%) 0.05 ± 0.03 (42%) 0.05 ± 0.03 (42%) 0.12 ± 0.05 6 0.43 ± 0.25 (0.58 ± 0.29) 0.08 ± 0.05 (0.08 ± 0.05) 0.11 ± 0.02 (0.11 ± 0.02) 0.03 ± 0.03 (25%) 0.02 ± 0.01 (17%) 0.07 ± 0.02 (58%) 0.12 ± 0.04 7 0.30 ± 0.12 (0.44 ± 0.15) 0.14 ± 0.08 (0.14 ± 0.08) 0.12 ± 0.02 (0.12 ± 0.02) 0.02 ± 0.02 (14%) 0.02 ± 0.02 (14%) 0.10 ± 0.02 (72%) 0.14 ± 0.02 8 0.23 ± 0.18 (0.53 ± 0.26) 0.10 ± 0.04 (0.11 ± 0.04) 0.12 ± 0.02 (0.12 ± 0.02) 0.02 ± 0.04 (17%) 0.03 ± 0.02 (25%) 0.07 ± 0.03 (58%) 0.12 ± 0.05 9 0.31 ± 0.10 (0.42 ± 0.12) 0.08 ± 0.07 (0.10 ± 0.08) 0.11 ± 0.01 (0.11 ± 0.01) 0.02 ± 0.01 (15%) 0.01 ± 0.01 (8%) 0.10 ± 0.01 (77%) 0.13 ± 0.02 10 0.37 ± 0.28 (0.59 ± 0.36) 0.10 ± 0.04 (0.10 ± 0.04) 0.13 ± 0.02 (0.13 ± 0.02) 0.03 ± 0.03 (22%) 0.02 ± 0.02 (14%) 0.09 ± 0.02 (64%) 0.14 ± 0.04
sectors, weighted by the area of each sector (see Fig. 10 cap-tion). In this way, we find that 8 out of our 12 seasonal av-erages (four seasons times the three regions) are within the variability ranges obtained by Moulin et al. (1998), whereas the variability ranges of 11 out of our 12 seasonal averages overlap with the ones of Moulin et al. (1998). Our mean dust optical thickness is however generally lower (about −30%), with maximum and minimum relative differences registered in Winter (−50%) and Fall (−7%), respectively.
The sector analysis described above was also used as a control tool of the criteria adopted to built the aerosol
mask. To this purpose, the mean seasonal AOT values characterizing each aerosol type in the different sectors (i.e. the AOTS,type in SEC values in Table 2) were associated
to the corresponding mean seasonal fine fraction values, FFS,type in SEC. Relevant results are shown in Fig. 11, where
the three regions of the aerosol mask (see Fig. 1) have also been indicated. This graph confirms that the three FF vs. AOT regions selected are well suited to identify the three aerosol types. This is because the distribution of points in the three regions of Fig. 11 (maritime, continental and dust) shows no tendency to overlap. Conversely, a concentration
Table 2b. As in Table 2a but for the Spring season (S=MAM).
36
AOTMAM, SEC, type ± s. d. (AOTMAM, type in SEC ± s. d.)
AOT*
MAM, SEC, type± s. d. (AOT*
MAM, SEC, type /AOTMAM, SEC) in % Sector
dust continental maritime dust continental maritime
AOTMAM, SEC
± s. d. 1 0.30 ± 0.12 (0.40 ± 0.14) 0.14 ± 0.04 (0.14 ± 0.04) 0.17 ± 0.03 (0.17 ± 0.03) 0.03 ± 0.02 (18%) 0.06 ± 0.03 (35%) 0.08 ± 0.03 (47%) 0.17 ± 0.03 2 0.35 ± 0.28 (0.55 ± 0.35) 0.16 ± 0.05 (0.16 ± 0.05) 0.15 ± 0.03 (0.16 ± 0.03) 0.04 ± 0.04 (22%) 0.08 ± 0.04 (44%) 0.06 ± 0.03 (34%) 0.18 ± 0.05 3 0.34 ± 0.15 (0.46 ± 0.17) 0.12 ± 0.03 (0.12 ± 0.03) 0.16 ± 0.03 (0.16 ± 0.03) 0.04 ± 0.03 (24%) 0.05 ± 0.02 (29%) 0.08 ± 0.03 (47%) 0.17 ± 0.03 4 0.56 ± 0.28 (0.65 ± 0.30) 0.16 ± 0.05 (0.16 ± 0.05) 0.16 ± 0.03 (0.17 ± 0.03) 0.09 ± 0.07 (41%) 0.06 ± 0.03 (27%) 0.07 ± 0.02 (32%) 0.22 ± 0.07 5 0.30 ± 0.11 (0.51 ± 0.14) 0.15 ± 0.11 (0.16 ± 0.11) 0.13 ± 0.04 (0.17 ± 0.05) 0.05 ± 0.04 (29%) 0.08 ± 0.10 (47%) 0.04 ± 0.02 (24%) 0.17 ± 0.10 6 0.36 ± 0.12 (0.46 ± 0.14) 0.12 ± 0.04 (0.13 ± 0.04) 0.16 ± 0.02 (0.16 ± 0.03) 0.06 ± 0.04 (33%) 0.04 ± 0.02 (22%) 0.08 ± 0.03 (45%) 0.18 ± 0.04 7 0.54 ± 0.18 (0.57 ± 0.18) 0.15 ± 0.05 (0.15 ± 0.05) 0.16 ± 0.02 (0.17 ± 0.02) 0.12 ± 0.06 (48%) 0.05 ± 0.02 (20%) 0.08 ± 0.02 (32%) 0.25 ± 0.06 8 0.47 ± 0.20 (0.55 ± 0.22) 0.12 ± 0.05 (0.14 ± 0.06) 0.15 ± 0.03 (0.17 ± 0.03) 0.12 ± 0.11 (52%) 0.04 ± 0.03 (17%) 0.07 ± 0.03 (31%) 0.23 ± 0.11 9 0.63 ± 0.28 (0.65 ± 0.28) 0.14 ± 0.05 (0.15 ± 0.05) 0.16 ± 0.02 (0.16 ± 0.02) 0.17 ± 0.10 (61%) 0.03 ± 0.02 (11%) 0.08 ± 0.02 (28%) 0.28 ± 0.09 10 0.54 ± 0.31 (0.61 ± 0.33) 0.10 ± 0.06 (0.13 ± 0.07) 0.16 ± 0.03 (0.17 ± 0.03) 0.14 ± 0.13 (54%) 0.02 ± 0.02 (8%) 0.10 ± 0.03 (38%) 0.26 ± 0.12
of points along the regions limits would have been found for a wrong choice of the three regions thresholds. In partic-ular, a clear-cut distinction between continental and desert dust aerosol emerges, not only in terms of fine fraction (im-posed) but also in terms of AOT. This means that, even if high AOT can be associated to some episodes of continental aerosol transport, these conditions are I) not frequent (mean continental AOT <0.3 and mean desert dust AOT>0.4 in Fig. 11 and Table 2), and II) well discernible from dust events by the aerosol mask (definite distinction between continental and dust points in the FF vs. AOT space of Fig. 11).
3.2 Estimation of the aerosol mass loading
Starting from AOT values, estimates of the column aerosol loading, M (g/m2), can be derived employing an appropri-ate conversion factor, generally referred to as the mass-to-extinction efficiency, α=AOT/M (m2/g). Since both AOT and M depend on particles physical and optical properties, substantially different α are associated to different aerosol types. An updated compilation of α values can be found in the last IPCC report (Table 5.1 in Penner et al., 2001) where these are classified on the basis of geographical region and/or aerosol type. For example, minimum and maximum values of α=1.8 ±0.5 m2/g and α=3.8±1.0 m2/g are there reported for maritime aerosols, corresponding to “Pacific marine – accumulation and coarse mode”, and “Atlantic marine”, www.atmos-chem-phys.org/acp/4/2367/ Atmos. Chem. Phys., 4, 2367–2391, 2004
2382 F. Barnaba and G. P. Gobbi: Aerosol seasonal variability over the Mediterranean region
Table 2c. As in Table 2a but for the Summer season (S=JJA).
37 Table 2c. As in Table 2a but for the summer season (S = JJA).
AOTJJA, SEC, type ± s. d. (AOTJJA, type in SEC ± s. d.)
AOT*
JJA, SEC, type± s. d. (AOT*
JJA, SEC, type /AOTJJA, SEC) in % Sector
dust continental maritime dust continental maritime
AOTJJA, SEC
± s. d. 1 0.40 ± 0.14 (0.52 ± 0.16) 0.22 ± 0.06 (0.22 ± 0.06) 0.15 ± 0.03 (0.15 ± 0.03) 0.05 ± 0.04 (24%) 0.09 ± 0.04 (43%) 0.07 ± 0.02 (33%) 0.21 ± 0.04 2 0.30 ± 0.23 (0.59 ± 0.33) 0.22 ± 0.06 (0.23 ± 0.06) 0.12 ± 0.04 (0.14 ± 0.04) 0.03 ± 0.04 (15%) 0.13 ± 0.06 (65%) 0.04 ± 0.02 (20%) 0.20 ± 0.05 3 0.44 ± 0.12 (0.49 ± 0.13) 0.20 ± 0.05 (0.20 ± 0.05) 0.16 ± 0.03 (0.16 ± 0.03) 0.10 ± 0.06 (42%) 0.07 ± 0.04 (29%) 0.07 ± 0.02 (29%) 0.24 ± 0.05 4 0.44 ± 0.16 (0.55 ± 0.18) 0.20 ± 0.06 (0.21 ± 0.06) 0.13 ± 0.03 (0.14 ± 0.03) 0.06 ± 0.04 (28%) 0.10 ± 0.05 (48%) 0.05 ± 0.02 (24%) 0.21 ± 0.05 5 0.06 ± 0.03 (0.39 ± 0.07) 0.25 ± 0.06 (0.28 ± 0.06) 0.13 ± 0.04 (0.16 ± 0.04) 0.01 ± 0.01 (5%) 0.15 ± 0.07 (75%) 0.04 ± 0.02 (20%) 0.20 ± 0.06 6 0.54 ± 0.15 (0.59 ± 0.16) 0.17 ± 0.08 (0.20 ± 0.09) 0.15 ± 0.04 (0.15 ± 0.04) 0.18 ± 0.09 (64%) 0.03 ± 0.02 (11%) 0.07 ± 0.03 (25%) 0.28 ± 0.08 7 0.48 ± 0.12 (0.53 ± 0.12) 0.21 ± 0.05 (0.21 ± 0.05) 0.16 ± 0.03 (0.16 ± 0.03) 0.10 ± 0.06 (42%) 0.07 ± 0.04 (29%) 0.07 ± 0.02 (29%) 0.24 ± 0.04 8 0.20 ± 0.07 (0.41 ± 0.10) 0.22 ± 0.07 (0.28 ± 0.08) 0.15 ± 0.04 (0.17 ± 0.04) 0.03 ± 0.03 (15%) 0.09 ± 0.06 (45%) 0.08 ± 0.04 (40%) 0.20 ± 0.05 9 0.47 ± 0.12 (0.49 ± 0.13) 0.19 ± 0.04 (0.20 ± 0.05) 0.17 ± 0.02 (0.17 ± 0.02) 0.10 ± 0.06 (43%) 0.05 ± 0.03 (22%) 0.08 ± 0.03 (35%) 0.23 ± 0.05 10 0.27 ± 0.13 (0.41 ± 0.16) 0.13 ± 0.07 (0.20 ± 0.08) 0.17 ± 0.03 (0.18 ± 0.03) 0.05 ± 0.05 (25%) 0.03 ± 0.03 (15%) 0.12 ± 0.04 (60%) 0.20 ± 0.04
respectively. For continental aerosols, minimum and max-imum values of α=1.00±0.08 m2/g and α=3.5±1.2 m2/g are given, corresponding respectively to “background continen-tal – accumulation and coarse mode” and “polluted conti-nental”. The α parameter being very sensitive to the particle size distribution, a large variability (more than an order of magnitude) of mass-to-extinction efficiencies of desert dust can be found in literature (e.g. Moulin et al., 1997; Cachorro and Tanr´e, 1997). This large variability is explained con-sidering that it includes values from different dust models and measurement techniques, and, in the latter case, different distance from the sources, different aerosol sampling levels, different dust load conditions in the atmosphere, etc. Over the Mediterranean, Dulac et al. (1992a, 1992b) derived α in the range 0.6–0.9 m2/g from desert aerosol samples
col-lected at the surface level in Corsica (France). To our knowl-edge no specific value is reported for continental and mar-itime aerosol types in this region. We then performed an original investigation to evaluate the α values typical of the three Mediterranean aerosol types addressed in this study. To this purpose, we employed 1) a large statistics of lidar mea-surements to determine typical aerosol extinction coefficients and 2) aerosol models to link such aerosol extinction values to the relevant mass. These models were specifically devel-oped to invert lidar measurements in maritime, continental and desert-dust conditions (Barnaba and Gobbi, 2001; Barn-aba and Gobbi, 2004). Both lidar observations and numeri-cal computations refer to the wavelength of 532 nm, i.e. very close to the 550 nm MODIS one. Lidar observations per-formed at Mediterranean sites under appropriate aerosol load
Table 2d. As in Table 2a but for the Fall season (S=SON).
38
AOTSON, SEC, type ± s. d. (AOTSON, type in SEC ± s. d.)
AOT*
SON, SEC, type± s. d. (AOT*
SON, SEC, type /AOTSON, SEC) in % Sector
dust continental maritime dust continental maritime
AOTSON, SEC
± s. d. 1 0.38 ± 0.06 (0.41 ± 0.07) 0.16 ± 0.08 (0.24 ± 0.09) 0.13 ± 0.02 (0.13 ± 0.02) 0.04 ± 0.02 (26%) 0.01 ± 0.01 (7%) 0.10 ± 0.02 (67%) 0.15 ± 0.02 2 0.39 ± 0.12 (0.46 ± 0.13) 0.21 ± 0.10 (0.25 ± 0.11) 0.12 ± 0.02 (0.12 ± 0.02) 0.04 ± 0.03 (25%) 0.03 ± 0.02 (19%) 0.09 ± 0.02 (56%) 0.16 ± 0.04 3 0.43 ± 0.10 (0.45 ± 0.10) 0.13 ± 0.07 (0.22 ± 0.10) 0.14 ± 0.02 (0.14 ± 0.02) 0.07 ± 0.04 (37%) 0.01 ± 0.01 (5%) 0.11 ± 0.02 (58%) 0.19 ± 0.03 4 0.48 ± 0.24 (0.51 ± 0.24) 0.17 ± 0.07 (0.23 ± 0.08) 0.13 ± 0.02 (0.13 ± 0.02) 0.06 ± 0.04 (33%) 0.02 ± 0.01 (11%) 0.10 ± 0.02 (56%) 0.18 ± 0.03 5 0.29 ± 0.05 (0.40 ± 0.06) 0.27 ± 0.10 (0.30 ± 0.11) 0.14 ± 0.02 (0.14 ± 0.02) 0.03 ± 0.03 (18%) 0.05 ± 0.05 (29%) 0.09 ± 0.03 (53%) 0.17 ± 0.05 6 0.46 ± 0.10 (0.48 ± 0.10) 0.16 ± 0.11 (0.34 ± 0.16) 0.15 ± 0.02 (0.15 ± 0.02) 0.12 ± 0.06 (52%) 0.01 ± 0.02 (4%) 0.10 ± 0.02 (44%) 0.23 ± 0.05 7 0.46 ± 0.07 (0.47 ± 0.07) 0.18 ± 0.07 (0.23 ± 0.09) 0.15 ± 0.02 (0.15 ± 0.02) 0.10 ± 0.05 (45.5%) 0.02 ± 0.01 (9%) 0.10 ± 0.02 (45.5%) 0.22 ± 0.04 8 0.31 ± 0.06 (0.40 ± 0.07) 0.19 ± 0.08 (0.25 ± 0.09) 0.15 ± 0.03 (0.15 ± 0.03) 0.04 ± 0.03 (23%) 0.02 ± 0.02 (12%) 0.11 ± 0.03 (65%) 0.17 ± 0.04 9 0.46 ± 0.08 (0.47 ± 0.08) 0.19 ± 0.08 (0.22 ± 0.09) 0.17 ± 0.02 (0.17 ± 0.02) 0.13 ± 0.06 (50%) 0.02 ± 0.01 (8%) 0.11 ± 0.02 (42%) 0.26 ± 0.05 10 0.38 ± 0.08 (0.41 ± 0.08) 0.16 ± 0.08 (0.21 ± 0.09) 0.15 ± 0.02 (0.15 ± 0.02) 0.05 ± 0.03 (28%) 0.01 ± 0.01 (5%) 0.12 ± 0.02 (67%) 0.18 ± 0.03
conditions have been considered. In particular, lidar mea-surements for the year 2001 collected in a semi-urban site at the outskirts of Rome (41.8◦N, 12.6◦E), Italy (Gobbi et al., 2004) were used to derive a suitable α value of continental aerosols (αcont). Considering the mean distance between the
Rome site and the Saharan region (about 1000–1500 km), li-dar measurements recorded in Rome during the seven ma-jor dust events registered in 2001 were used as representa-tive of transported desert dust conditions to derive a typical Mediterranean αdust. Finally, lidar observations performed
in Crete (35.5◦N, 23.7◦E), Greece, in May 1999 (Gobbi et
al., 2000) were employed as representative of Mediterranean maritime conditions to derive αmar. A detailed description
of the procedure employed to derive the three investigated mass-to-extinction efficiencies is given in Appendix A. The
resulting coefficients are: αcont=2.80 m2/g, αdust=1.36 m2/g
and αmar=1.85 m2/g for continental, desert dust and maritime
aerosol, respectively.
Both αcont and αmar fall within the variability range of
IPCC reported above. Our αdust value is somewhat higher
than the one derived by Dulac et al. (1992a) in the Northwest-ern Mediterranean (α=1/(1.13 g/m2)=0.88 m2/g) from cas-cade impactor desert dust samples, i.e. for dust aerosol sam-pled at the surface level (note that, for a given AOT, the higher α the lower the dust mass). Some discussion on the
αdustvalue obtained is given ahead in this Section.
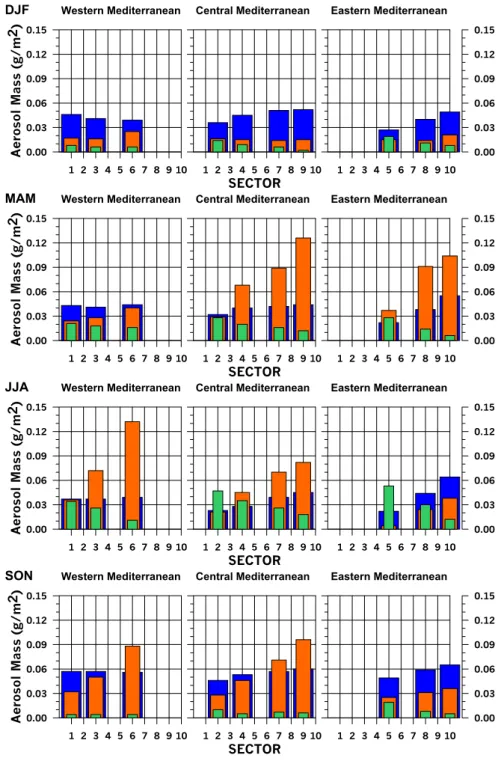
Based on the derived mass-to-extinction efficiencies, the mean seasonal (S) maritime, continental and desert dust mass loads, evaluated for each of the ten sectors (SEC) of Fig. 10 (i.e. MS∗
,SEC,type=AOTS,SEC,type
∗
/αtype, expressed in