HAL Id: hal-00697100
https://hal.archives-ouvertes.fr/hal-00697100
Submitted on 14 May 2012
HAL is a multi-disciplinary open access
archive for the deposit and dissemination of
sci-entific research documents, whether they are
pub-lished or not. The documents may come from
teaching and research institutions in France or
abroad, or from public or private research centers.
L’archive ouverte pluridisciplinaire HAL, est
destinée au dépôt et à la diffusion de documents
scientifiques de niveau recherche, publiés ou non,
émanant des établissements d’enseignement et de
recherche français ou étrangers, des laboratoires
publics ou privés.
Tracking Aerosol Particles’ Histories for Interpretation
of the Recent INCA Campaign
Marie Monier, Wolfram Wobrock, Jean-François Gayet, Andrea Flossmann
To cite this version:
Marie Monier, Wolfram Wobrock, Jean-François Gayet, Andrea Flossmann. Development of a Detailed
Microphysics Cirrus Model Tracking Aerosol Particles’ Histories for Interpretation of the Recent INCA
Campaign. Journal of the Atmospheric Sciences, American Meteorological Society, 2006, 63 (2), p.
504-525. �10.1175/JAS3656.1�. �hal-00697100�
Development of a Detailed Microphysics Cirrus Model Tracking Aerosol Particles’
Histories for Interpretation of the Recent INCA Campaign
MARIEMONIER, WOLFRAM WOBROCK, JEAN-FRANÇOISGAYET,ANDANDREAFLOSSMANN
Laboratoire de Météorologie Physique, OPGC/Universite´ Blaise Pascal/CNRS, Clermont-Ferrand, France
(Manuscript received 27 June 2004, in final form 28 June 2005)
ABSTRACT
Cirrus clouds play an important role in the earth’s energy balance. To quantify their impact, information is needed on their microstructure and more precisely on the number and size of the ice crystals. With the anthropogenic activity, more and more aerosol particles and water vapor are released even at the altitude where cirrus clouds are formed. Cirrus clouds formed in a polluted air mass may have different micro-physical properties and, therefore, a different impact on the climate system via the changed radiative properties compared to background cirrus clouds. To study this aspect, the European project called the Interhemispheric Differences in Cirrus Properties due to Anthropogenic Emissions (INCA) measured the microphysical properties of cirrus clouds together with the physical and chemicals properties of aerosol particles in clean air (at Punta Arenas, Chile) and polluted air (at Prestwick, Scotland). The goal of the present work was to develop a detailed microphysics model for cirrus clouds for the interpretation and the generalization of the INCA observations. This model considers moist aerosol particles through the Exter-nally Mixed (EXMIX) model, so that the chemical composition of solution droplets can be followed. Ice crystal formation is described through homogeneous or heterogeneous nucleation. The crystals then grow by deposition. With this model, the interactions between the microphysical processes, simulated ice crystal concentrations, and dimensional distributions of the INCA observations were studied, and explanations were provided for the observed differences between background and polluted cirrus clouds.
1. Introduction
Cirrus clouds play a key role in the earth’s energy budget through three different mechanisms. First, they reflect a part of the incoming solar radiation; the mag-nitude of this effect is controlled by their vertical struc-ture and particularly their microphysical composition (shape, number, and size of the ice crystals). Second, they trap a part of the outgoing infrared radiation from the earth’s surface and lower troposphere. Third, they also participate in atmospheric chemistry (Brune et al. 1999; Reichardt et al. 1996), which can change the at-mospheric chemical content and thus the oxidizing ca-pacity of the atmosphere. In the upper troposphere, poor in particles, ice crystals offer a surface for the gas to be involved in chemical reactions through heteroge-neous mechanisms. The total ice surface (i.e., the ice
crystal shape and size distribution) controls the magni-tude of this effect. The net effect of these processes can lead to negative but also positive radiative forcing (Ra-manathan and Collins 1991). Cirrus clouds have there-fore been the subjects of thorough investigation in the last decades. Numerous experiments [the First Interna-tional Satellite Cloud Climatology Project (ISCCP) Re-gional Experiment (FIRE), the Subsonic Aircraft Con-trail and Cloud Effects Special Study (SUCCESS), the European Cloud Radiation Experiment (EUCREX), the International Cirrus Experiment (ICE), Aerosol Condensation Trail (AEROCONTRAIL), and the In-teraction of Aerosol and Cold Clouds (INTACC); Heymsfield et McFarquhar 2002] have raised our knowledge by providing in situ data on cirrus cloud systems. Several theoretical models of cirrus cloud have been developed from that knowledge. A wide panel of available models at different scales is given in Sundqvist (2002), Jakob (2002), Starr and Quante (2002), and Khvorostyanov and Sassen (2002). Additionally, a re-view of available models at the microphysical scale is given in Lin et al. (2002).
Corresponding author address: Prof. Andrea I. Flossmann, LaMP, Université Blaise Pascal, 24 avenue des Landais, 63177 Aubière, France.
E-mail: [email protected]
© 2006 American Meteorological Society
Altitudes where cirrus clouds are commonly encoun-tered are the upper troposphere. Air traffic injects wa-ter vapor and aerosol particles and changes the com-position of the upper troposphere. One impact is the formation of contrails resulting in an increase in con-trail coverage (Gierens et al. 1999). In a second place, jet engine exhaust could trigger cirrus cloud formation. Ice nuclei are produced by the gas-to-particle conver-sion and are also released by contrail evaporation. Air-craft emissions may then have caused observable long-term increases in cirrus occurrence frequency and amounts (Boucher 1999) with a possible large impact on radiative forcing (Houghton et al. 2001). Research is ongoing to understand, additionally, if cirrus clouds formed on anthropogenic ice nuclei will have micro-physical properties differing from natural cirrus clouds. For this purpose, the flight campaign known as the Interhemispheric Differences in Cirrus Properties due to Anthropogenic Emissions (INCA; Ström 2001) took place in 2000 to provide comparable datasets of “pol-luted” versus “natural” cirrus clouds. The Falcon air-plane from the Deutsches Zentrum für Luft- und Raumfahrt (DLR), Germany, was equipped with a number of instruments to characterize the microphysi-cal properties of cirrus clouds, the physimicrophysi-cal and chemi-cal properties of the particles free in the air and con-tained in the ice phase, as well as the amounts of a few trace gases. Two flight campaigns were performed, one at Punta Arena, Chile (hereafter PA), and one at Prestwick, Scotland (hereafter PR), in the same season: autumn (March–April for PA, September–October for PR) within the same year (2000). These two sites were chosen for two different reasons. The first is the simi-larity of their latitudes (about 50°). The second is the contrast in anthropogenic sources near the two sites. The PA site represents a clean atmosphere, while PR is an area highly exposed to anthropogenic emissions. The particle-polluted aspect of the PR region is obvious through the entire troposphere from the measurements of aerosol concentration (Minikin et al. 2003). The use of the combination of an optical particle counter and a Fast Forward Scattering Probe (FSSP) to count and size the ice crystals makes the presence of a very strong concentration of small crystals (length under 20 m) obvious. Their concentration ranges from a few to 20 ice crystals per cubic centimeter (Gayet et al. 2002). They represent 20% of the total ice water content of the clouds and 50% of the total extinction measured by the Polar Nephelometer and derived from the Particle Measuring System (PMS) probe measurements as well (Gayet et al. 2004). Previous campaign observations, in which the use of the FSSP was not common, showed
total concentration of ice crystals smaller by a factor between 10 and 100 (Dowling and Radke 1990; Heyms-field and McFarquhar 2002). The INCA measurements also showed that for the PR campaign the concentra-tion of ice crystals is twice the mean concentraconcentra-tion of the PA campaign (about 1 ice crystal cm⫺3for PA and 2 for PR). This difference in concentration is associ-ated, for cirrus clouds sampled in supersaturated re-gions, with larger effective diameter of ice crystals for PA, with differences up to 10 m (Gayet et al. 2004). A thorough view of results depicted by the INCA experi-ment is available in the European final report (Ström 2001, which can be found online at http://www.pa.op. dlr.de/inca/).
Thus, the measurements of the INCA campaign seem to show differences in the microphysical proper-ties of the cirrus clouds sampled over both a clean area and a highly polluted one. To understand these differ-ences and to generalize these analyses, modeling stud-ies are necessary. Some of the conclusions of the INCA campaign arose from the comparison of the measure-ments of residual and interstitial aerosol properties. To understand the INCA observations and conclusions, we need a model capable of fully describing aerosol and cirrus clouds interactions, that is, to follow the aerosol content and its chemical properties inside the ice crys-tals. We thus developed a cirrus cloud model with de-tailed microphysics that explicitly describes aerosol content and chemical composition for interstitial wet aerosol particles and also ice crystals. To entirely de-scribe the aerosol content of the ice crystal particle, we also took into account, in our model, the impact of the interstitial wet aerosol particles by the ice crystals. The objective of the present work is to understand how the chemistry and the concentration of wet aerosols influ-ence the formation of cirrus clouds. Our model success-fully simulates the very high ice crystals concentration and the crystals size distributions observed in natural cirrus clouds during the INCA campaign and also simu-lates residual aerosol size distribution in agreement with the INCA observations.
The paper is organized in six sections. Section 2 pro-vides a description of the dynamics and microphysics of the new cirrus cloud model; section 3 presents the re-sults of sensitivity tests of the parameters that influence the ice crystal concentrations. Studies regarding conse-quences on the residual aerosols are presented in sec-tion 4. In secsec-tion 5 we investigate the capability of the model to reproduce particle size distributions in agree-ment with the INCA observations. Finally a proper case study is done in section 6. Further discussion and conclusions are provided in section 7.
2. Description of the model
To put the emphasis on a detailed treatment of the explicit microphysics we have used a simplified dynam-ics model. Two different dynamical frameworks are used: a simple air parcel model and a one-dimensional vertically resolved model. For the microphysics of cir-rus clouds, we assume that aerosol particles are an in-ternal mixing of sulfuric acid and some inactive mate-rial as silicates. Therefore, their humidification by con-densation leads to sulfuric acid solution droplets with an insoluble core. Under favorable thermodynamics conditions, these droplets can freeze and the ice phase can be initiated either in the liquid phase of the solution droplets (nucleation is then defined as homogeneous) or at the surface of the insoluble core (heterogeneous nucleation and more accurately, a condensation-freezing mechanism). The ice crystals subsequently formed can then grow by vapor diffusion or by collec-tion of solucollec-tion droplets through Brownian mocollec-tion, phoretic effects, or inertial impaction.
a. Modeling of dynamical processes
1) AIR PARCEL MODEL
This Lagrangian model is based on the elementary theory of an air parcel in free convection. Vertical mo-tion of air parcels can be generated either by buoyancy or mechanical forces. The heat, mass, and moment transport then induced is responsible for cloud forma-tion. The air parcel is assumed to be adiabatic and ho-mogeneous. That means that it maintains its identity during thermodynamics processes as no heat or mass exchange with the environment is possible and that the properties of the air parcel are assumed to be uniform
everywhere. The air parcel pressure adjusts instanta-neously to that of the surrounding air, which is in hy-drostatic equilibrium. The vertical velocity is pre-scribed. Our set of equations for the temperature, pres-sure, density, and humidity of the air is identical to that described in Pruppacher and Klett [1997; from their Eqs. (12-26)–(12-35)]. However, as the updraft is not large, we assume entrainment to be negligible.
This simple model has the advantage to completely control interactions between dynamics and microphys-ics. We will then use this framework to study each mi-crophysical process and their interactions. However, the absence of sedimentation of large ice crystals rep-resents a limitation to adequately model cirrus clouds. That is why we equally deployed a vertically resolved cirrus cloud model.
2) VERTICALLY RESOLVED CIRRUS CLOUD MODEL
We used the cylindrical model, which was first pre-sented by Asai and Kasahara (1967) for their study of cumulus cloud formation and evolution. Two concen-tric cylinders model the air as represented in Fig. 1: the inner cylinder represents the convective cell and the outer cylinder the surrounding subsidence. Lateral ex-changes between the two cylinders are allowed through the u˜ velocity. This model is thus not strictly one-di-mensional. In this model radial symmetry is assumed. The radius of the outer cylinder is set to be at least 10 times greater than the inner radius, so that the environ-ment can be assumed to be insensitive to the fluctua-tions of the cloudy column. The pressure of the inner cylinder adjusts instantaneously to that of the outer. Microphysical processes are computed only in the inner cylinder. The model equations in the form of flux di-vergence are given by
0 ⫽ ⫺1 ⭸共w兲 ⭸z ⫺ 2 r1 u˜, we⫽ 2 2⫺ 1w, ⭸共w兲 ⭸t ⫽ ⫺ ⭸共ww兲 ⭸z ⫺ 2 r1w˜ u˜ ⫹ 2 r1␣ 2 |we⫺ w|共we⫺ w兲⫹
冋
⫺ e e ⫺共qc⫹ qi兲册
g, ⭸共兲 ⭸t ⫽ ⫺ ⭸共w兲 ⭸z ⫺ 2 r1˜u˜ ⫹ 2 r1␣ 2 |we⫺ w|共e⫺ 兲⫹ L cp ⭸q ⭸t冏
mic⫹ Qdiab, ⭸共q兲 ⭸t ⫽ ⫺ ⭸共wq兲 ⭸z ⫺ 2 r1q˜u˜ ⫹ 2 r1␣ 2 |we⫺ w|共qe⫺ q兲⫹ ⭸q ⭸t冏
mic, ⭸fwatⲐice ⭸t ⫽ ⫺ ⭸关共w ⫹ U⬁,dropⲐcrys兲fwatⲐice兴 ⭸z ⫺ 2 r1 f˜watⲐiceu˜ ⫹ 2 r1 ␣2|we⫺ w|共fwatⲐice,e⫺ fwatⲐice兲⫹ ⭸fwatⲐice ⭸t冏
mic. 共1兲For a symbol list see the appendix. The variables with an e subscript represent the outer cylinder values, the one with a tilde are the boundary values, and all others are the inner cylinder values. The boundary values are defined following von der Emde and Kahlig (1989). Diabatic heating due to radiation in the potential tem-perature equation is not considered in our study. Time integration once ice crystals are formed is short. Since we only focused on cirrus cloud formation regions, this is not of large consequence for our study. The bottom layer is assumed to be a constant source of moisture temperature and particles. The top layer is hermetical but far enough from the updrafts to prevent significant convergence of heat, moisture, and particles.
During the INCA campaign, observations mainly fo-cused on cirrus clouds not resulting from deep convec-tion. The authors are aware that this special dynamical framework was designed to model cumulonimbus tow-ers and that there are no theories or observations to support local environmental subsidence around cirrus “cells” as a general response of the atmosphere. How-ever, this model was available at our institute, devel-oped for other applications (cumulus simulation), and we have modified certain parameters of the cumulus model in such a way that it quite closely reproduces the conditions in and around cirrus clouds. This was done by increasing the radius of the outer cylinder in such a way that the environment is almost at rest. Thus, in our modeling studies on the short duration of the integra-tion, the exchanges between the two cylinders were negligible in the evolution of the clouds and, in fact, the dynamics became those of a purely 1D situation.
For the calculations, we use a time-splitting
proce-dure and compute the evolution of the variables due to dynamical processes first; once this is done we compute the microphysical changes using the new conditions and then update the thermodynamic parameters. The time step is set to 2 s; however, for the processes using ad-vection, a time-splitting procedure could be applied in order to guarantee the Courant–Friedrich–Levy crite-rion. The inner cylinder has a radius of 3.5 km and the outer, a radius of 35 km. The advection scheme for the vertical flux divergence is the Multidimensional Positive Definite Advection Transport Algorithm (MPDATA) scheme developed by Smolarkiewicz (1983). The terminal velocities for liquid particles are taken from Pruppacher and Klett (1997) and for ice crystals from Heymsfield and Iaquinta (2000).
b. Modeling of microphysical processes
Our microphysical module is based on the warm mi-crophysics model, Externally Mixed (EXMIX) pre-sented in Wobrock et al. (2001). Aerosol particles grow by water vapor diffusion to solution droplets or to cloud droplets. At cold temperatures and under ice-super-saturated conditions, we have extended EXMIX to consider that aerosol particles can also be ice nuclei and form ice crystals.
The strength of the EXMIX model for warm clouds is that the particles’ histories are not lost during the numerical integration as bin models typically do. This model allows us to study the cloud composition from two different approaches. Similar to almost all bin mod-els, we can study the microphysical processes inside the cloud by the knowledge of number and sizes of cloud droplets and aerosol particles. Another interesting as-pect to studying the microphysical processes inside the cloud is to follow the behavior of aerosol particles that can remain in the interstitial air or be immerged in the condensed phase of the cloud. EXMIX can describe this second approach as it tracks the aerosol particles without any assumptions such as a cut-size diameter for the aerosol particles’ activation. This last way is quite useful when trying to understand the formation of the cloud. During the INCA campaign a counterflow vir-tual impactor (CVI) probe was used for measurements of the residual aerosol particles. We then decided to use the EXMIX philosophy to perform a case study on this campaign and extended it for cold clouds.
The capability of the model to track the particles histories comes from the formulation of the number distribution of droplets. The number size distribution of droplets, fwat(m, mAP,N, xi), is indeed treated as a
func-tion of the total particle mass m, the dry aerosol mass
mAP,N, and the chemical composition xiof the aerosol
FIG. 1. Schematic view of the cloudy (radius r1) and subsidence
(radius r2) columns both with a height H for the 1-1⁄2dimensional
model. The radial velocity u˜ drives exchange between the two cylinders.
particle. In this study only one type of aerosol particle is treated and there is no external mixture, so the num-ber distribution of liquid particles resumes in that case to fwat (m, mAP,N). If m Ⰷ mAP,N activated drops are present while for inactivated solution droplets m and
mAP,Ntypically differ only by a factor of 3 or less. For
m ⫽ mAP,N,fwatrepresents the dry aerosol particle dis-tribution. To better understand this unique aspect of the model (i.e., the simulated wet aerosol distribution becomes a 2D function of m and mAP,N) see Fig. 2. Figure 2 shows one example of a wet aerosol size tribution simulated by EXMIX model. The number
dis-tribution of ice crystals fice(m, mAP,N) is given by the same variables. However, m represents the mass of ice crystal, here again we only used one chemical compo-sition for the aerosol particles for that study.
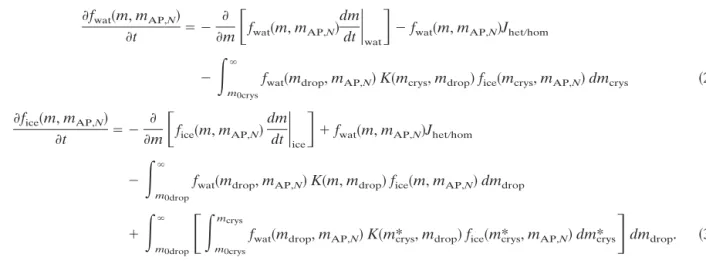
We consider that aerosol particles grow by conden-sation, can act as ice nuclei, and can be scavenged by ice crystals. We also consider that ice crystals grow by de-position, are formed through homogeneous and hetero-geneous nucleation, and can collide and collect aerosol particles and ice crystals. Both number distributions fwat and ficeare thus calculated by numerical integration of the following two equations:
⭸fwat共m, mAP,N兲
⭸t ⫽ ⫺
⭸
⭸m
冋
fwat共m, mAP,N兲dm
dt
冏
wat册
⫺ fwat共m, mAP,N兲JhetⲐhom⫺
冕
m0crys
⬁
fwat共mdrop, mAP,N兲K共mcrys, mdrop兲fice共mcrys, mAP,N兲dmcrys 共2兲 ⭸fice共m, mAP,N兲
⭸t ⫽ ⫺
⭸
⭸m
冋
fice共m, mAP,N兲dm
dt
冏
ice册
⫹ fwat共m, mAP,N兲JhetⲐhom ⫺冕
m0drop
⬁
fwat共mdrop, mAP,N兲K共m, mdrop兲fice共m, mAP,N兲dmdrop
⫹
冕
m0drop
⬁
冋
冕
m0crys mcrysfwat共mdrop, mAP,N兲K共m*crys, mdrop兲fice共m*crys, mAP,N兲dm*crys
册
dmdrop. 共3兲 The first term on the right-hand side of both equationsdescribes the time evolution by vapor diffusion growth [see Pruppacher and Klett 1997, their Eq. (12-39)]. The growth rate (dm/dt)watis used as given in Pruppacher and Klett [1997, from their Eqs. (13-26) to (13-27b)]. The depositional growth of ice crystals given by (dm/dt)iceis also calculated following Pruppacher and Klett [1997, their Eq. (13-76)]. Key parameters control-ling (dm/dt)iceare ice supersaturation and crystal shape, which influence capacity and the mass–length relation-ship, the ice crystals are supposed to be columnar and the deposition coefficient is set to 1 when it is not men-tioned any other way.
The loss of the wet aerosol particles due to their
nucleationto form crystals is considered in the second term on the right-hand side of Eq. (2). Consequently, this process appears as a source term in the evolution for ice crystals in Eq. (3). The different nucleation rates used in this study for homogeneous nucleation, Jhom, and for heterogeneous nucleation, Jhet, will be pre-sented in the following section.
The last terms in both equations represent the
sto-chastic removal of aerosol particles after collision and collection by ice crystals. We use the collection kernel
Kgiven by Martin et al. (1980) and Wang and Wusheng (2000). To compute these terms we have adapted the numerical scheme proposed by Bott (2000) to solve the stochastic equation of collision and coalescence in the case of a two-dimensional particle size distribution.
We assume the composition of dry aerosol particles to be sulfuric acid in internal mixing with some inertial material as silicates.
For the numerical solution of Eqs. (2) and (3) a loga-rithmically equidistant mass grid is introduced, that is,
mj⫹1⫽ mj, j ⫽1, . . . , n,
yielding the equally spaced logarithmic mass grid mesh, ⌬ln mj⫽ ⌬ln m ⫽ ln . Note that n is the total number
of grid points, which is 130 in our model for the first coordinate (i.e., the mass of the wet aerosol particles or the ice crystals) and 75 for the second coordinate (i.e., the mass of the dry aerosol particle that has served as the nucleus). In the present model  ⫽ 21/2, yielding a
doubling of the particle mass after two grid cells. The mass of the first bin for both coordinates is the one of a pure sulfuric acid sphere with a radius of 1 nm. Con-sequently, the mass of the last bin for the aerosol grid corresponds to a pure sulfuric aerosol particle of 5-m radius. For the condensed particles (liquid or ice) grid, the mass of 0.1 g is reached in the last bin.
c. Modeling of the nucleation process
An important unresolved question is whether homo-geneous or heterohomo-geneous nucleation dominates the ice crystal formation. In an attempt to address this prob-lem, we have introduced both these mechanisms into the model.
1) HOMOGENEOUS NUCLEATION
The form of the theoretical homogeneous nucleation rate is given by Pruppacher and Klett [1997, their Eq. (7-51) for supercooled solution]:
Jhom⫽ 2Nc
冉
solkT iceh冊冉
iceⲐsol kT冊
1Ⲑ2 exp冉
⫺⌬Fact RT ⫺ ⌬Fg kT冊
⫻ Vsol. 共4兲To form an ice crystal, two energy barriers must be overcome: ⌬Factis the activation energy and ⌬Fgis the
germ formation energy. The activation energy is ap-proximated by the autodiffusion energy of water in so-lution since the difference in minimal potential energy between the ice and liquid phase can be neglected. It has, therefore, the following form [Pruppacher and Klett 1997, their Eq. (3-21)]:
共⌬F兲act,w R ⬇
dln
冉
wT
冊
d共1ⲐT兲 , 共5兲
where wis the viscosity of solution.
The germ formation energy is the energy the volume should gain to sustain its interface with the supercooled solution. This energy has the form of [Pruppacher and Klett 1997, their Eq. (7-52), from (6-51) to (6-58)]
⌬Fg⫽ 4 3 iceⲐsolag 2 , where ag⫽ 2MwiceⲐsol
Ⲑ
ice 2MwsolⲐair r冉
1 ice⫺ 1 sol冊
⫹ Lm,0ln T0 T ⫹ RT lnaw ; 共6兲agis the germ radius; the terms with a bar are averaged
between T and T0.
In Eqs. (4), (5), and (6), the solution properties ap-pear through density, surface tension, water activity, and viscosity. Due to the variable chemical composition of the aerosol, these parameters are mostly unknown and need to be parameterized. To study the sensitivity of the results with respect to the chosen parameteriza-tion we have compared different parameterizaparameteriza-tions given in literature for the case of sulfuric acid aerosol particles. These are taken from Tabazadeh et al. (2000, hereafter TAB, and references herein), DeMott et al. (1997, hereafter DEM), and Koop et al. (2000, here-after KOO).
The approach of TAB is based on laboratory studies of surface tension, density, and activation energy for a solution of sulfuric acid. These values are fitted as a function of temperature and mass percentage wts. As
our model concept with fwat(m, mAP,N, xi) directly
pro-vides wts (⫽ mAP,N/m) a further parameterization for
wtsas used in TAB is not needed. Figure 2 shows
iso-contours for the mass fraction of sulfuric acid for the moist aerosol particles in the dashed lines as well as the moist aerosol particles 2D size distribution in shaded areas. The thick line is the value of the mass fraction for the same conditions according to Clegg and Brimble-combe (1995) as used in TAB. Figure 2 shows that with
FIG. 2. Two-dimensional size distribution (cm⫺3
) for moist aerosol particles when the first ice crystals formed (shaded con-tours). Distribution of the weight percentage of sulfuric acid (dashed line). The thick line represents the value of 19.64%, which is given by Clegg and Brimblecombe (1995) for the same thermodynamics conditions.
our treatment not all the moist aerosol particles have the same composition for the same initial size. This is the main difference between our treatment and other models that do not have a two-dimensional size distri-bution.
Solution density is computed with a polynomial func-tion of temperature and mass percentage from a dataset provided by Myrhe et al. (1998):
sol⫽ 1 1000
兺
i⫽0 10 Aiwts i with Ai⫽兺
j⫽0 4 BijT共⬚C兲 j 共7a兲 (coefficients of the polynomial function Bijare given inMyrhe et al. 1998). The surface tension of the ice– solution interface is computed thanks to Antonoff’s rule:
solⲐice共wts, T兲⫽ |solⲐair共wts, T兲⫺ iceⲐair|. 共7b兲 The dataset from Sabinina and Terpugov (1935) is used to parameterize the surface tension of air–solution in-terface with the expression of
solⲐair⫽ 142.35 ⫺ 0.96525wts
⫺ T共0.22954 ⫺ 0.0033948wts兲. 共7c兲
Finally, energy of activation is derived from the experi-ment of Koop et al. (1998) on a polynomial form:
⌬Fact⫽
兺
i⫽0 8 Ai⫻ 10⫺12⫻ wts i 共7d兲 (coefficients of the polynomial function Ai are alsogiven in TAB). Equations (7a)–(7d) are expressed in the centimeter–gram–second (CGS) system unit.
DEM follows the classical approach for homoge-neous nucleation of pure water (Pruppacher and Klett 1997). For that approach, the effect of the solution is considered by the use of a so-called effective tempera-ture, which corrects the droplet temperature by a freez-ing point depression, as first proposed by Sassen and Dodd (1989):
Teff⫽ T ⫹ ⌬Tm, 共8a兲
where ⌬Tmrepresents the extra cooling due to solution
effects, which is needed for freezing. This cooling is a function of the molality, , of the solution and is given in DEM with
⌬Tm⫽ 3.513627 ⫹ 0.4716382⫹ 0.0332083
⫹ 0.025054, 共8b兲
where is an empirical parameter to account for addi-tional change in the nucleation temperature due to the nonideality of the solution. This coefficient influences highly the nucleation efficiency. We assumed it equals to 2 following Lin et al. (2002).
KOO found from laboratory studies that the homo-geneous nucleation rate is independent of the solute nature of the aerosol and depends only on water activ-ity. Thus, the only variables for this approach of the nucleation rate are temperature and water activity of the solution:
log共Jhom兲⫽ ⫺906.7 ⫹ 8502⌬aw⫺ 26924共⌬aw兲
2 ⫹ 29180共⌬aw兲 3 , ⌬aw共c, T兲⫽ aw共c eff, T兲⫺ a w i 共T兲, aw i共T兲 ⫽ exp兵关210368 ⫹ 131.438T ⫺ 3.32373 ⫻ 106T⫺1⫺ 41729.1 ln共T兲兴⫻ 107ⲐRT其, 共9兲 where aw(ceff, T ) is the water activity of the solution
and ai
w(T ) is the water activity of solution in
equilib-rium with the ice phase.
2) HETEROGENEOUS NUCLEATION
Even if theoretical expression for heterogeneous nucleation is available in the literature (Jensen et al. 1994; Khvorostyanov and Curry 2000), we could not find any dataset to solve each variable in this expres-sion. That is why we used empirical approaches of Mey-ers et al. (1992, hereafter MEY), DEM97, and DeMott et al. (1998, hereafter DEM98), which are based on field or laboratory experiments.
The parameterization of MEY only needs the knowl-edge of the ice supersaturation s,iand is given by
NIN⫽ 10⫺3⫻ exp共⫺0.639 ⫹ 12.96 ⫻ s,i兲. 共10兲 The MEY parameterization gives only a number of ac-tivated ice nuclei at a given ice supersaturation ratio, but does not provide any information about the size of the ice nuclei. We assumed that all aerosol particles, whatever their size, nucleate with the same efficiency. The approach DEM97, similar to their approach for homogeneous nucleation, uses an effective tempera-ture. In addition, this parameterization takes the sur-face of the insoluble soot particles into account, imply-ing that the nucleation rate of insoluble particles in-creases with size:
In that case we assumed that the insoluble part of the aerosol particles is a sphere composed of soot with a density of 1.84 g cm⫺3.
The third approach for heterogeneous nucleation (DEM98) is mainly based on aircraft observations in cirrus clouds. DEM98 found a strong correlation be-tween the number of ice crystals and the number of cloud nuclei, NAP, which is the number of particle greater than 12 nm measured in clear air. This param-eterization for ice nuclei also takes the effective tem-perature into account.
NIN⫽ NAP⫻ 1.3 ⫻ 10 ⫺23
⫻共T ⫺ Teff兲11.75. 共12兲
3. Investigations on ice crystal number concentrations
a. Nucleation rate studies
The three parameterizations for homogeneous and heterogeneous nucleation have been tested in the dy-namical frame of the air parcel model. The model re-sults are compared with those of Lin et al. (2002). Fol-lowing their recent comparative study on detailed cirrus models, we investigated the following two scenarios: a cold-air case, where the air parcel starts at 170 hPa, T ⫽ ⫺60°C, and RHi⫽ 100%, and a warm-air case starting
at 340 hPa, T ⫽ ⫺40°C, and RHi⫽ 100%. To be
con-sistent with the study of Lin et al. (2002), we assumed aerosol particles to be pure sulfuric acid in the case of homogeneous nucleation and their distribution to con-sist of a single-mode lognormal distribution with a total number of particles of 200 cm⫺3, a mean radius of 20 nm, and a standard deviation of 2.3. To compute how moist the aerosol particles are, we assumed they are
initially at equilibrium with their environment and we use the Köhler equation. The resulting ice crystals were assumed to be spherical. More details on the dynamical and microphysical model setup are given in Lin et al. (2002).
1) HOMOGENEOUS NUCLEATION ONLY
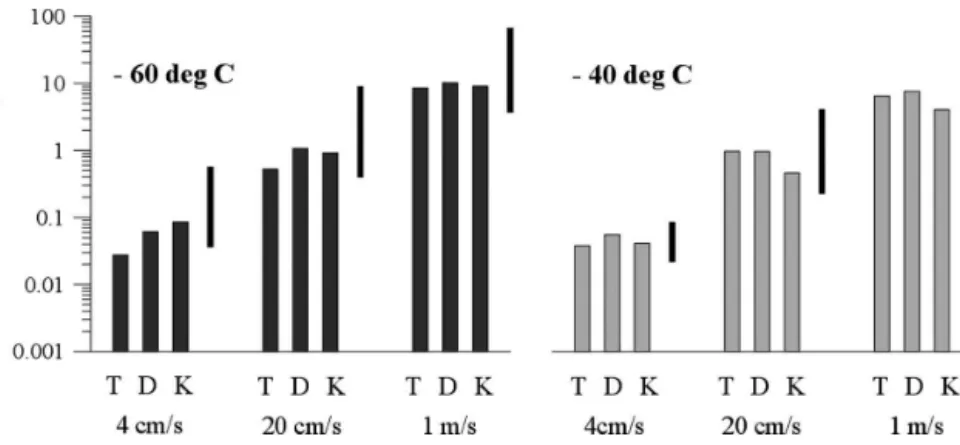
Figure 3 presents the results for the modeled ice number concentration after a vertical ascent of 800 m. The results for the cold-air case are displayed on the left-hand side; the ones for the warm-air case are on the right-hand side. Each case was run for a vertical wind speed of 4, 20, and 100 cm s⫺1. For each case and each updraft speed, three different rates for homogeneous nucleation [see section 2b(1)] were compared. The el-evated black bar for each case and each updraft velocity gives the range of the results found in Lin et al. (2002) for the same parcel studies. TAB, DEM, and KOO compared seven numerically different detailed cirrus models, which essentially used the same three param-eterizations for homogeneous nucleation. However, each used its own numerical air parcel framework.
Figure 3 shows that the number of ice crystals formed increases significantly with the intensity of the vertical wind. The reason for this behavior results from the crease of the maximum in ice supersaturation with in-creasing vertical wind speed (see Table 1). We also note that the influence of the air temperature on ice crystal production is less pronounced. In our study, a number increase for the cold-air case only becomes visible for the highest updraft speed of 1 m s⫺1and this increase is of the same order of magnitude as the numerical vari-ability of our results. If we compare our results with the ones of corresponding models using TAB, DEM, or KOO in Lin et al. (2002), we can see some significant
FIG. 3. Total number of ice crystals formed by homogeneous nucleation using different
vertical updraft velocities, w, and different nucleation rates from TAB (T), KOO (K), or DEM (D). The black bars represent the range of results found in Lin et al. (2002) for the same scenarios.
differences for particular cases. Figure 2 gives one of the main explanations for this difference in the particu-lar case of a comparison of our use of the parameter-ization of TAB and its original use in Lin et al. (2002). In this figure, a small number of our moist particles have a weight percentage lower than in the Clegg and Brimblecombe (1995) case, which is used in TAB. Even though there are very few, these more dilute aerosol particles could cause a large difference in the ice crystal concentration, because they will nucleate earlier and perhaps will be numerous enough to prevent humidity reaching higher values.
The dependence of number concentration on the three nucleation rates TAB, KOO, and DEM shows two different behaviors. For cases with w ⱖ 20 cm s⫺1, or in other words for median and high updraft veloci-ties, the employed parameterization typically differ by a factor of 2 in ice crystal concentration. This factor is significantly smaller than in the study of Lin et al. (2002) where these three parameterizations were used within one of seven individual numerical cloud models. Lin et al. (2002) also came to the conclusion that their variability does not entirely come from the use of a different nucleation rate but also from the use of a different numeric in their models. Here we compare these three parameterizations in a unique numerical cloud model wherein only the rate of ice nucleation varied. Another reason, for which we decrease a lot the variability found in Lin et al. (2002), is our continuous treatment of aerosol particles immerged in solution droplets, which allow us to not assume the composition of solution droplets. In contrast, many types of aerosol treatments in various models were presented in Lin et al. (2002). Our variability is so low that we can even conclude that for moderate to high updraft velocity the number of ice crystal formed is almost insensitive to the nucleation rate used. However what is really surprising in our result is that this conclusion does not stand for weak updraft. Our range of variability, in those cases, for the ice number concentration is similar and even slightly larger to that in Lin et al. (2002), ranging from a factor of 5 to more. Thus, we can conclude that only for weak updraft will the choice of a particular param-eterization for solution effects be of great importance.
Further conclusions from this figure are not obvious because no general tendency appears from it. We no-tice from cases with weak updrafts that the parameter-ization in TAB always gives the smallest ice crystal numbers. The same statement holds for all updraft con-ditions in the cold-air case (below ⫺60°C), but is not valid in the warm case for higher updrafts. To better understand the behavior of the different nucleation rates, in Fig. 4 we display the homogeneous nucleation rate Jhomas a function of the ice supersaturation for a small (radius ⫽ 40 nm) and a medium size aerosol par-ticle (200 nm).
FIG. 4. Homogeneous nucleation rate, Jhom(s⫺1), as a function
of ice supersaturation for two temperatures, two different aerosol particle sizes, and the three nucleation schemes TAB, KOO, and DEM.
TABLE1. Maximum ice supersaturation (%) calculated for the different schemes of homogeneous nucleation.
Nucleation schemes
Cold-air cases Warm-air cases
4 cm s⫺1 20 cm s⫺1 100 cm s⫺1 4 cm s⫺1 20 cm s⫺1 100 cm s⫺1
TAB 43.4 52.8 67.2 41.6 44.5 46.2
KOO 46.4 48.1 50.3 41.8 43.0 44.4
In Fig. 4, temperatures are respectively ⫺45° and ⫺65°C for the warm- and cold-air case because 5°C is roughly the cooling needed before nucleation to occur in the air parcel. From Fig. 4, we can detect that large solution droplets start to nucleate at smaller supersatu-ration than the small ones. Because they are larger, their curvature effects are weaker and they can grow by condensation faster. The dilution of the salt will be the more efficient and the nucleation easier. In addition, we notice that the homogeneous nucleation needs at cold temperature larger ice supersaturation and in DEM is the most sensitive scheme to that temperature depen-dency. In all the cases, DEM is also the scheme that provides the greater slope for dJhom/dRHi. DEM and
KOO parameterizations do not show big variation in this slope for increasing ice supersaturation; TAB on the other hand shows the weakest slope and the slope the most sensitive to the ice supersaturation. This shows that one cannot explain the difference of effi-ciency of these three schemes to form ice crystals by the time duration of the nucleation event. For the TAB scheme, a longer nucleation event means a greater dif-ference in the maximum ice supersaturation and ice supersaturation at the cloud base. However, since this slope is so weak, it does not mean that the TAB scheme could reach the regime of very high homogeneous nucleation rates.
2) HOMOGENEOUS AND HETEROGENEOUS NUCLEATION
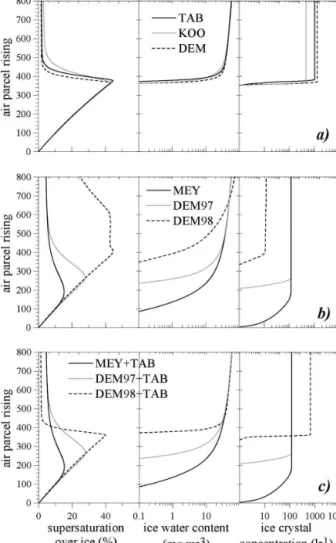
Figure 5 shows the evolution of ice supersaturation, ice water content, and ice crystal concentrations as a function of time (i.e., the altitude of the ascending air parcel), considering the scenario of the warm-air case with a vertical velocity of 20 cm s⫺1. The comparison is done for homogeneous (Fig. 5a), heterogeneous (Fig. 5b), and heterogeneous plus the TAB homogeneous nucleation (Fig. 5c). To be able to describe heteroge-neous nucleation we assumed that the aerosol particle is an internal mixing of sulfuric acid and some inert material like soot or silicate. The acid part is assumed to be 50% of the total mass.
We defined, following Lin et al. (2002), the cloud base as the altitude for which the threshold of one ice particle per liter is reached. We can see, in Fig. 5a, that for homogeneous nucleation the choice of the nucle-ation parameteriznucle-ation does not change the cloud base. The three schemes need at least 40% of supersaturation before forming ice, the maximum supersaturation var-ies only within 2% (see Table 1). Despite this small variability, the final variance in the number of crystals is quite important, with only 573, 1020, and 1280 L⫺1for
KOO, TAB, and DEM, respectively. We notice that the time interval during which nucleation is active is quite short since the process becomes inactive within a few tens of meters. And as we mentioned with the analysis of Fig. 4 the length of the time during which nucleation is active is not directly linked to the final number of ice crystals. Nucleation events with the DEM and KOO scheme are almost of the same du-ration and their final ice crystal concentdu-rations differ by a factor greater than 2.
In Fig. 5b, considering only heterogeneous nucle-ation, we notice the totally different behavior of the
FIG. 5. Evolution along the air parcel height in m of the (left) ice
supersaturation (%), (middle) the total ice water content (mg m⫺3), and (right) the ice crystal concentration (L⫺1). Comparison
of the different nucleation scheme for (a) homogeneous ation only (i.e., TAB, KOO, and DEM), (b) heterogeneous nucle-ation only (i.e., MEY, DEM97, and DEM98), (c) and the three parameterizations for heterogeneous nucleation together with the TAB approach for homogeneous nucleation. All these runs are performed in the scenario denoted warm with an ascent of 20 cm s⫺1in Lin et al. (2002).
DEM98 formula. This parameterization is quite ineffi-cient to form ice crystals (only 12 L⫺1). The evolution of the ice supersaturation is, therefore, explained by the lack of ice crystals. They are, indeed, not numerous enough to consume the vapor, thus the saturation over liquid water level is reached and some droplets are formed, which is unrealistic. For the two other param-eterizations, heterogeneous nucleation is more active but final ice crystal concentrations remain small com-pared to the one from the simulation with homoge-neous nucleation (117 and 118 L⫺1 for MEY and DEM97, respectively). Since the parameterization of MEY depends only on saturation over ice, nucleation begins at the initial altitude of the air parcel. The cirrus cloud base is, therefore, near the initial altitude. The air parcel rises roughly 200 m before producing the maxi-mum of ice crystals possible at this temperature. For DEM97, cirrus cloud formation differs, as it takes into account the effective temperature; hence, the sulfuric solution, with its insoluble core, needs to be sufficiently diluted before nucleation occurs. Thus, the cirrus cloud base is located about 200 m above the initial altitude. Nucleation starts at smaller dilution than for homoge-neous nucleation. The ice supersaturation at the cirrus cloud base for DEM97 is only 29.5% compared to 40.1% for DEM in the homogeneous case (Fig. 5a).
After these considerations, we can anticipate that considering both homogeneous and heterogeneous nucleation together in that scenario will be similar to only considering heterogeneous nucleation. Ice crystals formed primarily through the heterogeneous process will, by vapor diffusion, prevent an increase of ice su-persaturation to values needed for homogeneous nucle-ation. Figure 5c substantiates this statement. We note that the two curves for the MEY and DEM97 param-eterizations stay unchanged even if the TAB approach for homogeneous nucleation is simultaneously consid-ered. For the DEM98 parameterization, which was shown to be really inefficient in forming ice crystals, the threshold for homogeneous nucleation in ice supersatu-ration could be reached. Although the number of ice crystals formed by heterogeneous nucleation is quite small, they are sufficient to decrease the maximum ice supersaturation from 44.5% (for TAB only) to 39.8% (for DEM98 and TAB). The final number in ice crystals is hence smaller considering both nucleations together (659 L⫺1) than considering homogeneous nucleation alone (1020 L⫺1). For this scenario we can then con-clude that considering heterogeneous nucleation from DEM97 or MEY will prevent homogeneous nucleation to be active. One can argue that this result depends on the vertical velocity and does not apply for stronger
updraft. But repeating that test for the case with 1m s⫺1, we also found that the maximum ice supersatu-ration reached if heterogeneous nucleation is active is lower than the ice supersaturation needed for homoge-neous nucleation to occur.
b. Implications for comparisons with the INCA measurements
During the INCA campaign, a total of 19 scientific missions representing more than 130 flight hours, sev-eral types of cirrus were sampled, including frontal (cold and warm) cirrus, jet stream cirrus, cirrocumulus, orographic wave cirrus, and anvil blow-off cirrus. To focus on pure ice clouds, only measurements taken at air temperature below 235 K were analyzed. The sam-pling approach has been described in Kärcher and Ström (2003) and Gayet et al. (2004). The cirrus clouds systems were chosen to be young. The flight procedures mostly consisted of climbing to high altitudes above the main cloud layer and then performing several 10–15-min flight legs at different levels within the cloud. These procedures allow for the study of the upper cloud lay-ers, which are regions of formation for the cirrus clouds. In Kärcher and Ström (2003) distributions of occur-rence of vertical velocity, temperature, aerosol par-ticles, and ice crystal concentrations are presented for both PR and PA campaigns. From their Fig. 2, we note that, for the ice crystal concentration, the range from 1 to 10 ice crystals cm⫺3is densely populated. From our theoretical modeling, we can conclude that the most likely nucleation process to get such high concentra-tions of ice crystals is the homogeneous nucleation con-sidered alone. This statement is in agreement with other conclusions from theoretical modeling (Lin et al. 2002). Indeed, the number of crystals formed by the heterogeneous nucleation parameterizations used is at least one order of magnitude smaller. If we consider the two processes together, the regime of homogeneous nucleation will not be reached, except for DEM98, since the ice crystals formed at smaller supersaturation by heterogeneous nucleation consume the water vapor. In addition, even if the heterogeneous nucleation scheme allows homogeneous nucleation to be reached the ice crystal concentrations are then smaller. Conse-quently, in order to explain the INCA measurements with the model, based on the parameterizations we used for homogeneous and heterogeneous nucleation, homogeneous nucleation needs to be active alone.
In addition, our theoretical results, summarized in Fig. 3, show that homogeneous nucleation could form high ice crystal concentration in agreement with the INCA measurements, but only for vertical velocities
between 20 and 100 cm s⫺1at both temperatures. Dis-tributions of occurrence of vertical velocity shown in Kärcher and Ström (2003) are unable to reproduce this peak in ice crystal concentration distribution assuming homogeneous nucleation. Temperature sampling dur-ing the INCA campaign is in the range between 215 and 235 K, which is roughly that of our theoretical work and in which our model did not show any sensitivity to tem-perature. Kärcher and Ström (2003) also showed that the sensitivity of final ice crystal concentration to tem-perature is very low and unable to explain the observed ice crystal concentration assuming homoge-neous nucleation. So we cannot superimpose a varia-tion in temperature to the observed variability in up-draft speed to explain the peak of ice crystal concen-tration observed in the range of 1–10 cm⫺3. Kärcher and Ström (2003) almost reproduced the observed ice crystal concentration distribution by adding to the ver-tical velocities a random component between 0 and 20 cm s⫺1, implying a net increase of 5 cm s⫺1to the mean value of the updraft speed. Increased dynamics vari-ability could then be the answer to producing high ice crystal concentrations with weak updrafts, but the treatment of microphysics should also be investigated. The ice crystal concentrations of our modeling stud-ies are controlled by the competition for water vapor between the solution droplets and the newly formed ice crystals. The competition is the result of the droplets needing really high supersaturation to homogeneously nucleate and the fast growth of the newly formed ice crystals by deposition. To form a greater number of ice crystals, one would need to maintain for longer time a high ice supersaturation and therefore to slow down the water vapor consumption by ice crystal diffusional growth. To vary the shape of ice crystals will vary their capacitance and consequently their growth rate (Prup-pacher and Klett 1997). However, differences in the growth rates of hexagonal plates, columns, or ice spheres can only change the ice crystal number by a maximum of 150%, and moreover the spherical shape, which was assumed to be consistent with the study of Lin et al. (2002), is the one that gives the highest con-centrations. Consequently, a different shape cannot re-solve the observed discrepancies. As another possibil-ity, we can study the impact of the vapor deposition accommodation coefficient. As Gierens et al. (2003) have shown, an accommodation coefficient of unity makes the model underestimate the ice crystal concen-tration. Moreover, they obtained ice crystal numbers in agreement with the INCA campaign for low vertical velocities very commonly sampled (15 cm s⫺1in their work) by considering this coefficient to be small, at
least for small ice crystals. One of the reasons consid-ered in Gierens et al. (2003) to explain the small ac-commodation of small ice crystals is the impurity of the ice surface. Some new experimental evidence for this impurity has been performed. In their work, Ettner et al. (2004) observed freezing of sulfuric acid solution droplets with densities commonly encountered in the upper troposphere. These observations showed at freezing point the instantaneous ejection of the particu-lar content of solution droplets to the surface. Aerosol fragments then contaminate the ice crystal surface at its earliest stage. One might speculate that these debris pieces could decrease the water accommodation coef-ficient for small ice crystals.
Finally, a very low accommodation coefficient for mi-cron-sized ice crystals is very probable with regard to recent experiments and could explain the numerous oc-currences of high ice crystal concentrations with the observed vertical velocity distribution.
4. Investigations of residual aerosol particle spectra
Another helpful method for the assessment of the different parameterizations of the nucleation mecha-nisms is the analysis of measurements of the particles that remain after the ice crystals have been evaporated. There are two different mechanisms to incorporate aerosol particles inside the ice crystal. There is the nucleation and here we assumed that the aerosol con-tent of the droplet remains in the formed ice crystal during nucleation. There is also the possibility that wet aerosol particles free in the air could be impacted by an ice crystal and stick on it. The modeling concept for ice crystals presented by Eq. (3) treats explicitly the nucleus mass mAP,Nand therefore allows for the calcu-lation of the “residual” particle spectra.
a. Incorporation of aerosol particles in ice phase by nucleation
In the idealized scenario of the warm-air case with
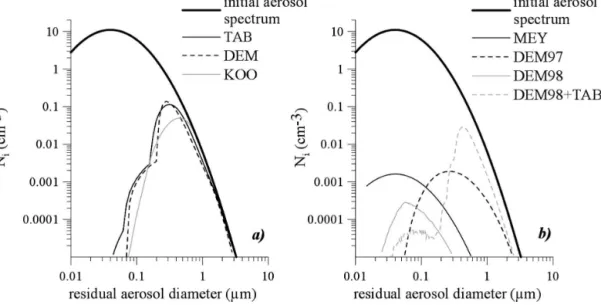
w ⫽20 cm s⫺1, which was presented in previous section, we investigated how homogeneous nucleation incorpo-rates aerosol particle in the ice phase. Results for the three different schemes TAB, KOO, and DEM are displayed in Fig. 6a. The graph for the three residual spectra reflects the nucleation behavior already dis-cussed in Fig. 4. Large particles will nucleate ice at smaller supersaturation than small particles; thus, most large particles serve as ice nuclei while the small ones are not nucleated. The difference between the
effec-tiveness of small and large particles is so pronounced that we can even define a sort of cut-sized diameter in Fig. 6a for each parameterizations. For KOO, since the slope of the nucleation rate as a function of humidity was not really steep, the cut-sized diameter for nucle-ation is not so sharp. The slopes for TAB and DEM of nucleation rate as a function of humidity are differ-ent. It is much less steep for TAB. This can explain how, even with forming less ice crystals, TAB could nucleate smaller aerosol particles.
Figure 6b provides the equivalent results for the three heterogeneous nucleation parameterizations: DEM97, DEM98, and MEY. The preference to nucle-ate large particles remains only visible for the DEM97 approach. Equation (11) shows that there are two rea-sons for this: first, the soot surface is taken into account. Consequently, increasing the aerosol particles sizes also increases the nucleation rate. Second, effective tem-perature is considered. Thus, for large particles the cur-vature effects are weaker, the particles grow more readily and are more dilute and the nucleation rate is greater. The MEY parameterization nucleates all par-ticle size with the same efficiency since the nucleation rate [Eq. (10)] only depends on the ice supersaturation. A size dependency for the heterogeneous nucleation rate for DEM98 also exists in Eq. (12) (hidden in Teff), however, this cannot be detected in Fig. 6b due the weak nucleation efficiency.
As explained in the previous section, if homogeneous and heterogeneous nucleations are active together in
the air parcel, the MEY plus DEM97 parameterization results are the same as if heterogeneous nucleation is considered alone. On the contrary, for a combination of DEM98 with one of the homogeneous schemes TAB, DEM97, or KOO, both nucleation regimes could be reached. The results for DEM98 and TAB are provided in Fig. 6b and underline this statement since two dif-ferent modes are visible in the modeled residual aerosol distribution. The one at the smaller size is due to het-erogeneous nucleation and the bigger one is due to homogeneous nucleation.
b. Incorporation of aerosol particles in ice phase by collection
Through Brownian motion, phoretic effects and in-ertial impact ice crystal can collide with a wet aerosol particle and collect it. The aerosol particle content of that solution droplet will then be incorporated into the ice phase.
The importance of the uptake of wet aerosol particles by ice crystals have been estimated in the air parcel framework for the warm-air case with a vertical velocity of 20 cm s⫺1. Nucleation is assumed to be homogeneous and solution effects are taken into account through the TAB parameterization. After 30 min of modeling, our study showed that the cirrus cloud reached a typical ice water content as well as a typical ice crystal concentra-tion. At this point, less than 1% of the mass of residual aerosol came from the collision and collection
pro-FIG. 6. Modeling results for number distribution of residual particles using a lognormal distribution for the ambient aerosol particle spectrum. Here Niis the concentration in the ith model bin when i goes from 1 to 75 for
(a) the homogeneous nucleation rates TAB, DEM, and KOO and (b) for the heterogeneous nucleation rates only MEY, DEM97, and DEM98, as well as for DEM98 heterogeneous together with the TAB homogeneous param-eterization.
cesses. With a purpose of studying the removal of up-per-tropospheric aerosol by cirrus clouds, collection is thus negligible compared to nucleation in the formation region of the cirrus cloud. Moreover, only one part in 108of the ice water content was coming from this pro-cess, compared to the one in 105from nucleation, indi-cating that the uptake of aerosol particles by falling ice crystals is also obviously negligible to explain the size of ice crystals and therefore ice water content. This small impact of the collision and collection process is not a result of the particular efficiency dataset from Martin et al. (1980) and Wang and Wusheng (2000), but more of the very small concentration of ice and aerosol par-ticles. Indeed, setting all efficiencies to the value of 1, as a crude test, leads to the same conclusions.
c. Implications for comparisons with the INCA measurements
Measurements of ambient and residual aerosol par-ticles were performed (Seifert et al. 2004) during the INCA campaign. The residual aerosol particles are ana-lyzed downstream of the CVI inlet, which separates cloud elements with an aerodynamic size between 5 and 60 m from the surrounding atmospheric air, after evaporation of the cloud elements. Downstream of the inlet, for one branch the sampled particles are at a tem-perature of 25°–30°C. We assume that the aerosol par-ticle size distribution that was measured in that branch is the size distribution of residual aerosol particles. The number of residual aerosol particles has been shown to be in agreement with the number of ice crystal (Seifert et al. 2003). This makes the assumption that each ice crystal leaves behind only one particle to be valid. But, there is no evidence that the remaining aerosol particle after evaporation corresponds exactly to the initially dry aerosol particle that has served as the nucleus for the solution droplet, which has nucleated. However, no information is available on the fraction of aerosol par-ticles that has been lost from the entering in the ice phase until the analysis. In that case, we assumed the mass of the initial dry aerosol particles, mAP,N, to be
directly comparable to the mass of sampled aerosol par-ticles downstream of the CVI inlet in the 25°–30°C branch.
Figure 7 shows results from 31 March in PA and 27 September in PR. Both pairs of measurements suggest that small aerosol particles have the capacity to be ice nuclei. This holds for all measurements taken (J. Ström 2003, personal communication). A comparison of the homogeneous nucleation model results for the ice crys-tal residual particles with those measured during the INCA experiment in cirrus clouds points out a dramatic
discrepancy in the shape of the size dependence. Ob-servations in cirrus clouds for the Northern and South-ern Hemisphere do not confirm a stronger nucleation efficiency for the larger aerosol particles but show rather that smaller particles are more effective as the ice nucleus. Indeed, comparison of these measurements with the modeled residual spectra for the homogeneous nucleation process (Fig. 6a) suggests that all three ho-mogeneous nucleation schemes strongly overestimate the nucleation of large aerosol particles and strongly underestimate the nucleation of small particles. We cannot incriminate the possible difference from the ini-tial dry aerosol particles, which formed an ice crystal and the remaining analyzed aerosol particles to be the only cause of that discrepancy even though it could explain some of it. One possible explanation for the discrepancy with the observations could be that it is not the homogeneous but the heterogeneous that domi-nated nucleation during INCA, which is in disagree-ment with our conclusions from the previous section. Without a proper case study further analyses are im-possible.
5. Investigations of particle size distribution
If one wants to quantify the radiative properties of cirrus clouds or their role in upper-tropospheric chem-istry, it is necessary to correctly describe the number size distribution of the ice crystals. Figure 8 provides a particular ice crystal distribution observed with an FSSP (length smaller than 20 m) and a 2DC probe
FIG. 7. Measurements of the ambient and residual aerosol num-ber distributions performed on 31 March on PA and on 27 Sep-tember on PR, Niis the concentration in the ith DMPS bin.
(length larger than 25 m) during the INCA campaign in an upper region of the cirrus cloud to represent the formation region of this cloud. Figure 8 also shows one modeled ice crystal spectrum from the study of Gierens et al. (2003) using an air parcel. The figure demon-strates that even if a detailed microphysics model can produce ice crystal number and ice water content in agreements with observations, there is no insurance that modeled ice crystal distributions describe the mea-surements correctly. As in Fig. 8, typical observed ice size distributions show the simultaneous presence of numerous small particles and large ones in a smaller amount. But considering only nucleation and deposi-tion growth as microphysical processes in an air parcel frame leads to nearby monodispersive ice crystal size distributions (Fig. 8). None of these spectra, even the broader one with a varying deposition coefficient, would be able to fit the observations.
Applying some findings from the warm cloud micro-physics, we could expect the stochastic collection pro-cesses of cloud elements to broaden the ice crystal size distribution. We already proved in the previous section that during the formation stage of the cirrus cloud the probability that a falling ice crystal captured a wet aero-sol was really low. This low probability was not due to a lack of efficiency of particles to stick together but to the very low concentration of ice crystal and wet aero-sol particles. The probability of them to collide was therefore negligible in the formation stage of cirrus cloud. If we now want to consider aggregation, that
means that the collection of an ice crystal by another ice crystal, to explain the broadening of ice crystal size distribution in formation region of cirrus clouds. Un-fortunately, we face two major limitations. First, ice crystals are totally dry at cirrus temperatures and there-fore cannot stick together. Furthermore, the absence of dendrite ice crystals in cirrus clouds also reduces the possibility of forming aggregates. Thus, the efficiency of ice crystal to aggregate if they collide will be very low. Second, the smallest concentration between aerosol particles and ice crystals is the crystal one with at least
FIG. 8. Comparison of one typically observed ice crystal size distribution during the INCA campaign with some of the modeled distributions obtained by Gierens et al. (2003) and shown in their work in Fig. 2.
FIG. 9. Observations for the second flight of 31March for the flight leg in the formation region of the sampled cirrus cloud: (top) total number of particles measured by the combination of FSSP and 2DC probe particles with a diameter larger than 3 m, (middle) relative humidity in respect to ice measured by the LMD hygrometer (Ovarlez et al. 2002), and (bottom) the vertical ve-locity of air.
an order of magnitude in difference. If the concentra-tions of aerosol particles and ice crystal were too low to make a collision between them statistically relevant during the formation stage of the cirrus cloud, obvi-ously the probability of the impact of ice crystals will be even more negligible in that stage. The lifetime of cirrus clouds could be really important. We do not claim that aggregation is a negligible microphysical process for cir-rus clouds; we just conclude that it could not explain the observation of ice crystal size distribution only in the formation region.
To explain formation of rain in warm cloud micro-physics, some studies (Young 1975; Zawadzki et al. 1994) showed how important the sedimentation of cloud elements with different fall speed is to explain, in addition to collision–coalescence processes, the broad-ening of raindrop size distribution. Since in our theo-retical studies we are unable to explain the breadth of the ice crystal size distribution within the formation region of cirrus clouds, we need to use a vertical model to explain that failure. A proper case study has to be performed in a one-dimensional framework if we want to compare modeled and observed ice crystal size dis-tribution.
6. Modeling study of the formation region of the cirrus cloud sampled during the second flight on 31 March
This flight took place at the beginning of the PA campaign. The sampled cirrus cloud was part of a sys-tem approaching from the west, with humid air in the entire troposphere. The flight procedure was identical to the other ones; it consisted of climbing to high alti-tudes above the main cloud layer and then performing several 10–15-min flight legs at different levels within the cloud. The cloud was composed of a thin layer aloft with some hundred meters of cloud-free air in between this layer and the main body of the cloud. The first flight level was performed at an altitude of about 10 km in the upper layer of the cloud. Other flight legs were performed afterward in the interior of the main part of the cloud.
As our model has been designed to study the forma-tion of the cirrus cloud, we decided to simulate the thin top layer. Some of the measurements taken on that flight leg are shown in Fig. 9. The temperature was close to ⫺52°C at this altitude and the pressure was 260 mb.
To compare observations and simulations we used the two independent pieces of information provided by our model—that is, the knowledge of aerosol particle
size distributions within the ice phase and interstitial in the air and the ice crystal size distributions.
a. Study of the residual aerosol particle size distribution
We performed an air parcel simulation to study the incorporation of aerosol particles through nucleation. We neglected the incorporation through impact as the observations are in the area of formation of cirrus clouds and collection of aerosol particles by ice crystal is mainly taking place at a more advanced age of cirrus clouds. The initial temperature was to set to be ⫺50°C, and initial pressure to be 260 mb, in agreement with the observations. We exposed the air parcel to a constant vertical velocity of 10 cm s⫺1. Following our conclu-sions from section 4c; we expected only heterogeneous nucleation to be responsible for the observed residual aerosol particles. Therefore, we performed simulations with the three different parameterizations for hetero-geneous nucleation. The initial aerosol particle size dis-tribution was assumed to be an average of the mea-sured aerosol particle spectra in air free of ice crystals. The aerosol particles were assumed to be a mixing of sulfuric acid and inertial silicates with a mass ratio of 1:1. The modeling results for the three parameteriza-tions on the 31 March case are displayed in Fig. 10a. The behavior of the different heterogeneous nucleation rates confirms what was previously discussed in Fig. 6b. The parameterizations for heterogeneous nucleation DEM97 and DEM98 deviate from the observational results. This is due to the fact that these two approaches consider a size dependency for the ability of the par-ticles to nucleate. The results would not have improved if we had used homogeneous nucleation parameteriza-tions for which the size dependency is even more pro-nounced. However, it is surprising how well the MEY approach agrees with the observed crystal residual aerosol spectra. We should remember here that MEY do not provide any information on the size dependency of the nucleation ability of ice nuclei. It was our as-sumption that the efficiency is the same whatever is the size of the wet aerosol particle.
However, on this flight leg the ice crystal concentra-tion was extremely small (only 234 L⫺1). Furthermore, the rate of incorporation of aerosol particles into the ice phase, which can be estimated roughly to be one per thousand (Fig. 10a), is small. Most of the cases show a rate of incorporation on the order of 1%, as in the 27 September observations. We could conclude that this flight leg sampled the formation region of cirrus cloud and this formation is quite recent. This statement is reinforced by the strong ice supersaturation still visible
in the observations in Fig. 9. The very high particle concentrations with a diameter greater than 3 m found in Fig. 9 are the consequence of the high con-centrations of moist aerosol particles. Since humidity is still important these moist aerosol particles could easily have diameters larger than 3 m. And finally the high concentration of particles, which is measured by the FSSP and the 2DC probes, does not indicate a high ice crystal number.
For 27 September, which is a case with an older for-mation region where the incorporation rate of aerosol particles in the ice phase has reached a typical value on the order of 1%, the modeling result for MEY param-eterization is given in Fig. 10b. In this more typical case, heterogeneous nucleation is again found to be not ef-ficient enough to explain the high crystal concentra-tions. Indeed, we can see in Fig. 10b, that even the MEY parameterization, which was the best for the other flight, strongly underestimates the number of re-sidual aerosol particles.
Therefore, we can conclude from this case study us-ing an air parcel model that both homogeneous and heterogeneous nucleation fail to describe the incorpo-ration of aerosol particles in ice crystals that was ob-served during most of the cases of the INCA campaign. The first mechanism strongly overestimates the ability of large aerosol particles to form ice crystals. The sec-ond underestimates the total number of formed ice crystals. In this context, the work of Ettner et al. (2004) might again help to explain the discrepancy. They ob-served that the chemical content of the supercooled
droplet is instantaneously ejected at the freezing point to the ice crystal surface. The numerous small aerosol particles found in ice crystals could then be the remains of larger particles dissolved and ejected in several parts from droplets during the freezing process. This could be a possible explanation for the discrepancy between ob-served and modeled residual aerosol size distribution, however, this directly challenges the assumption that each ice crystal leaves only one particle after evaporat-ing in the CVI.
b. Study of the ice crystal size distribution
We noted in section 5 that the impossibility of large particles to sediment and the absence of a water vapor supply in the cirrus clouds are the two main limitations of the air parcel framework to describe the cirrus clouds. That is why we developed a cylindrical model, including all the microphysical processes described ear-lier. We initialized our model with the profiles of tem-perature, pressure, and humidity given by the Falcon measurements. During the whole run the vertical ve-locity profile was prescribed and set constant in time even though the measurements showed important vari-ability in the vertical velocity. Vertical velocity was as-sumed nonzero only between 7.5 and 12.5 km, thus, it was prescribed as a second-degree polynomial function of the altitude with a zero value at 7.5 and 12.5 km and a maximum value of 15 cm s⫺1at 10 km. The three first panels in Fig. 11 show the profiles for initial tempera-ture, relative humidity, and vertical velocity.
FIG. 10. (a) Measurements of the ambient and residual aerosol number distributions performed on 31 Mar on PA (thick lines). Modeling results, assuming the ambient measured spectrum as initial aerosols, for number distribution of the residual particles using the heterogeneous nucleation rates MEY, DEM97, and DEM98 are superimposed. (b) Same measurements for 27 September on PR compared with the modeling results of only the MEY scheme for heterogeneous nucleation.