HAL Id: hal-02319246
https://hal.umontpellier.fr/hal-02319246
Submitted on 9 Nov 2020HAL is a multi-disciplinary open access archive for the deposit and dissemination of sci-entific research documents, whether they are pub-lished or not. The documents may come from teaching and research institutions in France or abroad, or from public or private research centers.
L’archive ouverte pluridisciplinaire HAL, est destinée au dépôt et à la diffusion de documents scientifiques de niveau recherche, publiés ou non, émanant des établissements d’enseignement et de recherche français ou étrangers, des laboratoires publics ou privés.
Microscopic Determination of Remaining Oil
Distribution in Sandstones With Different Permeability
Scales Using Computed Tomography Scanning
Yongfei Yang, Haiyuan Yang, Liu Tao, Jun Yao, Wendong Wang, Kai Zhang,
Linda Luquot
To cite this version:
Yongfei Yang, Haiyuan Yang, Liu Tao, Jun Yao, Wendong Wang, et al.. Microscopic Determination of Remaining Oil Distribution in Sandstones With Different Permeability Scales Using Computed Tomography Scanning. Journal of Energy Resources Technology, American Society of Mechanical Engineers, 2019, 141 (9), �10.1115/1.4043131�. �hal-02319246�
Microscopic determination of remaining oil distribution in
sandstones with different permeability scales using CT-scanning
Yongfei YANGa,b*, Haiyuan YANGa,b, Liu TAOa,b, Jun YAOa,b, Wendong WANGa,b, Kai
ZHANGa,b, Linda LUQUOTc
aKey Laboratory of Unconventional Oil & Gas Development (China University of
Petroleum (East China)), Ministry of Education, Qingdao 266580, P. R. China
bResearch Center of Multiphase Flow in Porous Media, School of Petroleum Engineering,
China University of Petroleum (East China), Qingdao 266580, China
c Hydrosciences Montpellier, Université Montpellier, CNRS, IRD, 300 Avenue du Pr.
Emile Jeanbrau CC57, 34090 Montpellier, France
* Correspondence: [email protected]
Abstract
To investigate the characteristics of oil distribution in porous media systems during a high water-cut stage, sandstones with different permeability scales of 53.63 ×10⁻³μm2 and 108.11 ×10⁻³μm2 were imaged under a resolution of 4.12 μm during a water flooding process using X-ray tomography. Based on the cluster-size distribution of oil segmented from the tomography images, and through classification using the shape factor and Euler number, the transformation of the oil distribution pattern in different injection stages was studied for samples with different pore structures. In general, the distribution patterns of an oil cluster continuously change during water injection. Large connected oil clusters break off into smaller segments. For sandstones with higher permeability, which show the largest change in distribution pattern,and the remaining oil is trapped in the pores with a radius of approximately 7-12 μm. Meanwhile, some disconnected clusters merge and lead to a re-connection during the high water cut period. Whereas the pore structure becomes compact and complex, the residual non-wetting phase becomes static and is difficult to move, and thus all distribution patterns coexist during the entire displacement process, and are mainly distributed in pores with a radius of 8-12 μm. For the pore-scale entrapment characteristics of the oil phase during a high water cut period, different enhance oil recovery (EOR) methods should be considered in sandstones correspondent to each permeability scale.
Keywords: X-ray computed microtomography, Remaining oil distribution, Patterns of oil cluster, Pore-scale imaging, Pore network model
1. Introduction
Residual oil in the swept zone of displacement is often taken as the target oil for enhanced recovery processes [1, 2]. During the high water-cut stage, it is difficult to further improve the already high sweeping volume, and therefore the improvement of oil displacement efficiency has become an issue for water injection oil fields. The multi-scale oil displacement mechanism in rocks with different scales of permeability should be considered to provide theoretical guidance with regard to EOR methods and adjustment strategies in high water cut reservoirs, particularly the
2
microscopic distribution law of the remaining oil clusters [3]. Researchers used fractal and history matching methods to predict the parameters [4-6]. What’s more, researchers also used NMR methods to quantitatively study the residual oil distribution and pore size distribution using different NMR T2 spectrums [7-10]. Research has shown that porous systems containing remaining oil are significantly influenced by the pore scale entrapment characteristics of the oil phase [11, 12].
With advances in X-ray tomography (μCT) and increases in computational power, μCT has become an excellent technique for the non-destructive capturing of 3D images of the pore structure of reservoir rocks and the residual fluids within them at a resolution of a few microns [13-15]. Owing to a limited description of the connectivity of the pore space, a 2D model is an insufficient representation of the flow behavior, and detailed information extracted from CT images of rocks can be used to accurately study multiphase flows in consolidated and unconsolidated porous media under specific conditions [16, 17]. Starting with glass bead packs [18, 19], researchers tend to test real reservoir rocks and create a more realistic experimental environment. In previous work, researchers obtained the images of real rock systems after both a non-wetting phase injection (drainage) and a wetting phase injection (imbibition) [20-22]. Simulation and experimental examination of the pore-scale multiphase flow behavior has focused on the relative permeability [23, 24], fluid distribution [25-29], capillary pressure measurements [30, 31], oil recovery [32-34], stress sensitivity [35-37], wettability [38-41], and etc.
The morphology, configuration, and migration of the remaining oil clusters during the high water cut stage are of significant importance for oil field development. Therefore, a thorough understanding of the micro-scale distribution properties of the remaining oil in pore space and the changes in such properties based on the permeability scale is critical. Several measurements of the oil cluster distribution have been conducted. In the earliest studies, residual oil clusters of all size were observed as approximately power-law distributions [42]. The cluster size has been found to range from single- to multiple-pore configurations [27, 34, 43]. The size of an oil blob is directly related to the viscous force required to remove the blob, and the blob surface area and volume have an impact on the mass transfer characteristics of the system [44]. Research has shown that a complex pore structure with different scales of permeability is responsible for trapping a large portion of the oil phase within the rock porous spaces. Moreover, a tendency toward an increase in residual non-wetting-phase saturations as the porosity decreases has been noted. This is related to a strong relationship between the trapping and aspect ratio [26]. However, the trapped oil has been measured in pore-scale experiments, these do not reveal the morphology or distribution changes of a trapped cluster in sandstones with different scales of permeability.
The objective of this work is to characterize the pore-scale distribution law of the remaining oil during a high water cut period in sandstones using 3D micro-computed tomography (μ-CT). Two relative homogeneous sandstone samples of different scales of permeability were selected as representative of the different reservoir sandstone systems. We imaged the sequences of the water flooding production steps to elucidate more clearly the changes in the remaining oil distribution and improve our fundamental understanding through which it will be possible to reduce the oil saturation further.
2. Experimental section and methodology
2.1 Sandstone and fluids
the different types of porous media. The gas permeability of the two rock samples were 53.63 ×10⁻³μm2 and 108.11 ×10⁻³μm2, respectively. The physical properties of the samples used in this
investigation are shown inTable 1. To obtain higher-resolution images, cylindrical core plugs were drilled with a diameter of 9.5 mm and length of 25–29 mm.
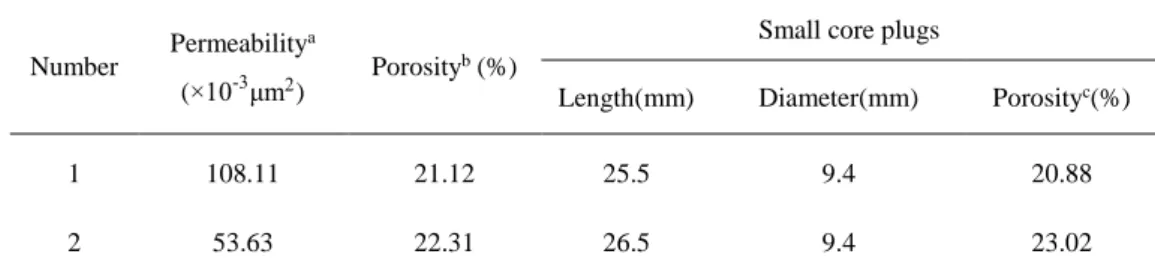
Table 1 Physical properties of the sandstone samples.
Number Permeability
a
(×10-3μm2) Porosity b (%)
Small core plugs
Length(mm) Diameter(mm) Porosityc(%)
1 108.11 21.12 25.5 9.4 20.88
2 53.63 22.31 26.5 9.4 23.02
a Measured at 297.15K using nitrogen. b Measured at 297.15K using nitrogen. c Measured at 297.15K using water.
Brine (salinity of 7850 mg/L) doped with 10 wt.% potassium iodide (to enhance the CT contrast) was applied as the aqueous phase, and crude oil mixed with 52.1 wt.% kerosene was used as the oil phase. The viscosity of the aqueous phase is 1.2 mPa∙s, whereas that for the oil phase is 8.9 mPa∙s.
Table 2 Composition of Brine Salinity (mg/L) SO42− (mg/L) 𝐶𝑙−& 𝐼− (mg/L) 𝑀𝑔2− (mg/L) 𝐶𝑎2− (mg/L) 𝑁𝑎+ & 𝐾+ (mg/L) 7850 800 3500 20 30 3500
2.2 Experimental setup and procedure
The experimental installation comprises four main parts: a core holder, X-ray micro CT equipment, a pumping system, and intermediate containers. The core holder sleeve is made of polyetheretherketone (PEEK), whereas the inlet and outlet end plugs are made of stainless steel. The fluids were injected into the horizontally positioned plug using standard pumps. X-ray micro-tomography was used to scan the pore structure and map the distribution of oil clusters during the water flooding process.
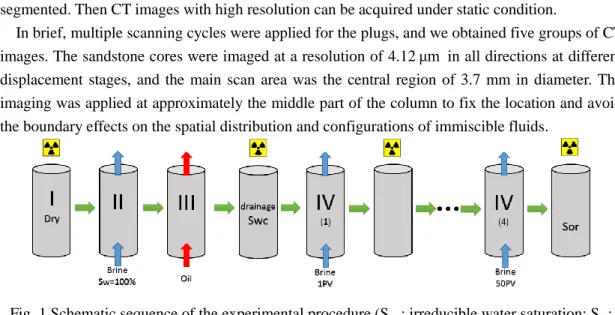
Fig. 1 shows a schematic sequence of the experimental procedure. All experiments were conducted at 297.15 K and atmospheric pressure (0.1 MPa). Initially, the samples were scanned dry to obtain an accurate mapping of the pore structure. Then, the cores were completely saturated with brine under vacuum, and an approximately 200 pore volume (PV) of oil was injected until the water production ceased. After aging, the cores were scanned again to obtain the distribution of oil phase under a connate oil saturation (So) state. During stage IV, the core plug was water-flooded at a velocity of 0.1 ml/min, and μ-CT images of the cores at 1, 5, 15, and 50 PV injection stages were then acquired. As the CT data could be more accurate and easily segment while the core reaches the static condition (no flow), the pump and the pressure valves on both ends of the core holder were turned off and allowed to stand for 1 h before each scanning. We took the image quality as the standard to determine the stable state of core samples in this experiment, especially the interface between different phases. A quick scan test with low resolution but short time-consuming can be used to evaluate if the holder was ready to be imaged. If the distribution of fluid phase in pore space achieves stability, the captured interface should be very clear with the naked eye and easy to be
4
segmented. Then CT images with high resolution can be acquired under static condition.
In brief, multiple scanning cycles were applied for the plugs, and we obtained five groups of CT images. The sandstone cores were imaged at a resolution of 4.12 μm in all directions at different displacement stages, and the main scan area was the central region of 3.7 mm in diameter. The imaging was applied at approximately the middle part of the column to fix the location and avoid the boundary effects on the spatial distribution and configurations of immiscible fluids.
Fig. 1 Schematic sequence of the experimental procedure (Swc: irreducible water saturation; Sor:
residual oil saturation)
Fig. 2 A simplified schematic diagram of the displacement experiment based on CT scanning
2.3 Image processing
To correlate the characteristics of the pore structure of different scales of permeability and oil distributions quantitatively, significant processing needs to be applied to the raw CT images. First, noise must be removed from an extracted portion (300 × 300 × 300 pixels) of the raw images using a non-local means filter [45, 46], which can increase the signal but does not increase the interface width from the raw images.
Prior to any analysis, the gray-scale CT images must be segmented into binary images based on the intensity value of each phase and the histogram of the gray-scale values. Segmentation is the essential process of uniquely identifying different phases in the images based on their different levels of X-ray absorptivity, which means each phase has a range of intensity values. Images containing a partial saturation of multiple fluids are significantly more difficult to segment than dry images [47]. However, in this study, we used a watershed algorithm, which is quite versatile and can be applied to multiphase images [35]. The process of determining the threshold is typically
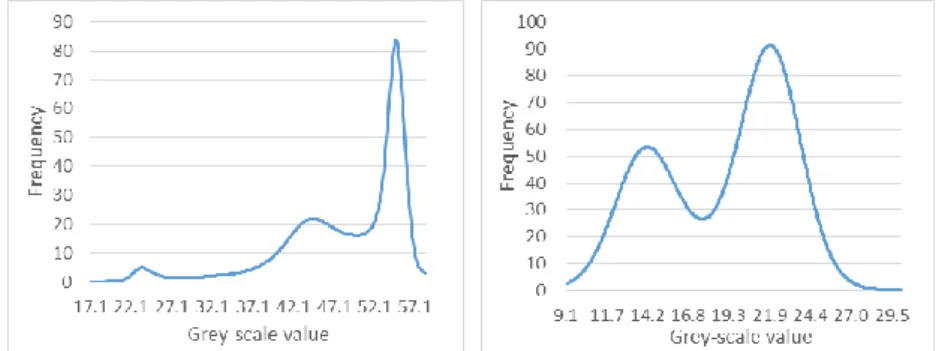
combined with a recognition of the peaks within a gray-scale histogram (Fig. 3) [48]. The accuracy of the segmentation was verified by comparing the results obtained from the segmented images with the experiment results. All raw CT images were filtered and segmented within the commercial software package Avizo (FEI Visualization Sciences Group). Note that, for each process step, the same areas were compared. Fig. 4 shows slices through the rock during the water flooding experiment.
Fig. 3 Histogram of the different grey-scale values for CT images (left: sample with multiphase-fluid; right: dry sample)
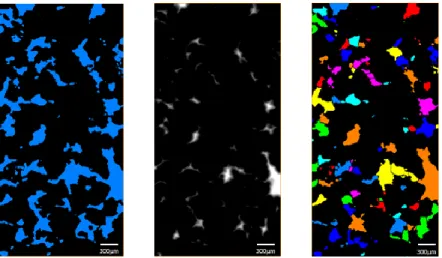
Fig. 4 Image processing procedure (left: raw CT images, middle: the filtered images, right: the corresponding segmented image. Oil: black, brine: dark grey, rock: light grey, resolution: 4.12 μm)
2.4 Pore space segmentation
A binary image space can be defined as a set of points, which are often called voxels in 3D imaging. According to morphological theory, the distance transformation, which is represented by a distance map, is widely used in image analysis and segmentation [49]. A distance map is a gray-level image where the value of each point of pore space (object point) corresponds to its shortest distance to all matrix points (background points). Some of the more common distance functions include the Euclidean distance, city-block distance, and chessboard distance, the most accurate of which is the Euclidean distance. The Euclidean distance is calculated by linking two points using a straight line [50]:
d𝐸(𝑝, 𝑞) = √(𝑥1− 𝑥2)2+ (𝑦1− 𝑦2)2+ (𝑧1− 𝑧2)2
Where d𝐸(𝑝, 𝑞) is the Euclidean distance between points p and q, and x, y, and z are the
coordinates of the points.
In this study, a distance-map based method was used to determine the pore size and distribution for analyses of the pore structure and remaining oil distribution (Fig. 5). Combining the Euclidean
6
distance map and watershed algorithm, each pore space can be segmented and located by distinguishing the “basin” and “peak” areas [51]. Then, the pore radii were obtained using the radius of the max ball of each pore.
Fig. 5 Euclidean-processing workflow(left: binary image; middle: Euclidean distance map; right: segmentation of pore space)
2.5 Connectivity of pore space
The pore network model (PNM) is now able to represent the complex topological structure of the pore space more adequately [52]. By simplifying a realistic pore space such as spheres and cylinders, research into the quantification of the pore structure and pore-scale transport mechanism can be conducted [53]. This approach allows us to map the pore structure and determine the connectivity of the pore space from high-resolution images [54].
The connectivity function 𝐸𝑉(𝑟) is a global description of the topological properties. It can
easily be determined for the network model by [55] 𝐸𝑉(𝑟) =
𝑁𝑛(𝑟) − 𝑁𝑏(𝑟)
𝑉
Where 𝑁𝑛(𝑟) is the number of nodes, and 𝑁𝑏(𝑟) is the number of bonds, in which only bonds
with a radius of larger or equal to 𝑟 are considered.
3. Results and discussion
3.1 Pore structure analysis
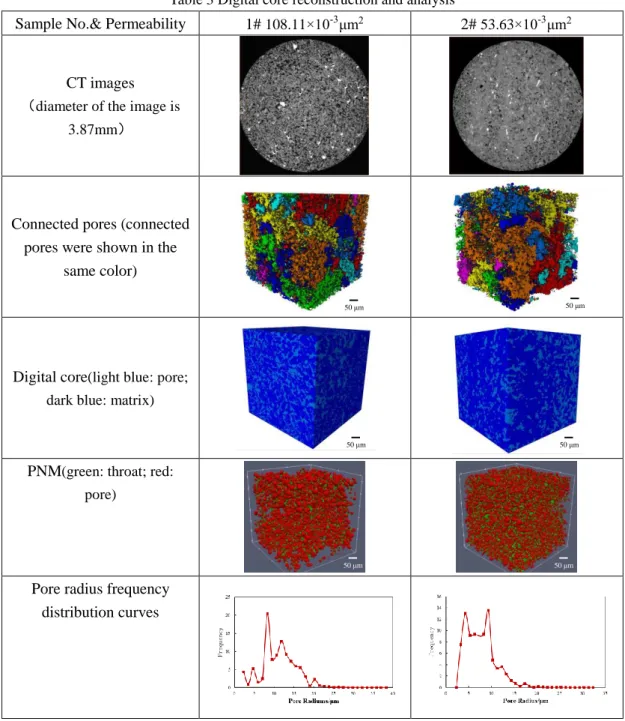
Table 3 shows cross sections of the two selected porous systems extracted from the CT images. We then extracted a portion (300 × 300 × 300 voxels) of the raw CT images for segmentation and analysis using the pore network model and distance transformation [56, 57]. Each volume
Table 3 Digital core reconstruction and analysis
Sample No.& Permeability 1# 108.11×10⁻³μm2 2# 53.63×10⁻³μm2
CT images
(diameter of the image is 3.87mm)
Connected pores (connected pores were shown in the
same color)
Digital core(light blue: pore; dark blue: matrix)
PNM(green: throat; red: pore)
Pore radius frequency distribution curves
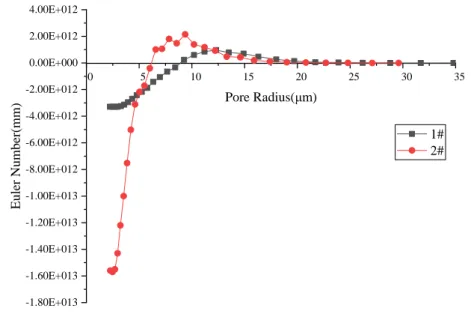
From the CT gray-scale and PNM images, we can see that, as the permeability of the samples is reduced, the pore structure becomes complex; medium pores, small pores, and fine throats develop. The distribution of the pore radius can be quantified using the distance-map based method mentioned above, as shown in Table 3. As the permeability and porosity of the samples decrease, the range of pore radius narrows, the peak value moves to the left, and the mean radius and effective porosity decrease. Table 4 lists the parameters of the samples obtained through a PNM characterization under a resolution of 4.12 μm. As indicated above, the mean pore and throat radii both decrease, although the throat radius changes more than pore radius based on the peak of the frequency distribution curve. Moreover, with the decrease in permeability, the mean volumes of the pore and throat decrease, the mean tortuosity shows a tendency to increase, and the intersection of the connectivity function curve (Fig. 6) with the X-axis moves to the left, which means the connectivity of the pore space worsens [55].
50 μm 50 μm
50 μm 50 μm
8
Table 4 Parameters of the samples obtained by PNM characterization
Parameters 1# 2#
Number of pores 7593 36187
Mean pore radius (µm) 11.10 6.52
Mean volume of pore (103 µm3)
16.5 3.21
Number of throats 13955 67692
Mean throat radius (µm) 7.92 4.88
Mean volume of throats (µm3) 8.12 2.23
Mean length of throats (µm3) 25.4 16.00
Mean shape factor 0.0487 0.0545
Mean coordination number 3.64 3.72
Mean Tortuosity 2.36 2.69
Effective porosity (%)a 22.81 22.12
a Effective porosity with resolution of 4.12μm.
Fig. 6 Connectivity function curves
3.2 Pore-scale classification of remaining oil
To characterize the connected oil clusters in a segmented image, we identify individual clusters and provide each with a unique label based on some first-order statistical information of each voxel’s 26 neighboring voxels. Disconnected oil blobs are labeled with distinct numerical values starting from 1 up to the maximum number of individual blobs in the image. The parameters such as the volume, interfacial area, sphericity index, and distribution pattern of every individual oil cluster are then computed by performing operations on these sets of voxels.
0 5 10 15 20 25 30 35 -1.80E+013 -1.60E+013 -1.40E+013 -1.20E+013 -1.00E+013 -8.00E+012 -6.00E+012 -4.00E+012 -2.00E+012 0.00E+000 2.00E+012 4.00E+012 Eul er Number(mm ) Pore Radius(μm) 1# 2#
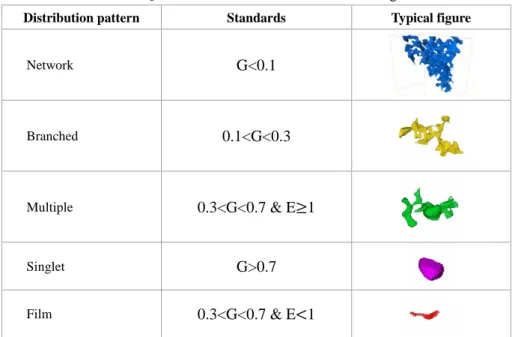
Table 5 Quantitative characterization of remaining oil
Distribution pattern Standards Typical figure
Network G<0.1
Branched 0.1<G<0.3
Multiple 0.3<G<0.7 & E≥1
Singlet G>0.7
Film 0.3<G<0.7 & E<1
The remaining oil saturation is computed as the ratio of the voxels of the oil phase to the pore space. Once the individual oil blobs are labeled, it is easy to calculate the volume of each oil blob 𝑉𝑏𝑙𝑜𝑏 as well as the total oil volume 𝑆𝑜 (remaining oil saturation). Several algorithms are available
to calculate the interfacial area from a digital core, and their accuracy is primarily a function of the resolution of the images. The interfacial areas were computed using an optimized simple face counting algorithm, which can provide a reasonable estimate based on our high-resolution images. The algorithm calculates the surface area (𝑆𝐴𝑏𝑙𝑜𝑏) based on the number of areas of the faces of the
boundary voxels, and a summation of the distances between each boundary voxel.
There are two important parameters used to distinguish the distribution patterns of the remaining oil. One is the sphericity index, which describes how closely an oil blob resembles a sphere, and is computed as follows [58]:
G =6√𝜋𝑉 𝑆1.5
Where S is the surface area of the oil clusters, and 𝑉 is the volume. For a perfect sphere, G = 1.
Another is the Euler number (E), which can be used as a characteristic describing the topological properties of the residual oil clusters. The Euler number can be expressed using three Betti numbers [59].
E = 𝑏0− 𝑏1+ 𝑏2
Where 𝑏0 is the number of isolated components, 𝑏1 is the number of tunnels, and 𝑏2 is the
number of cavities.
The sphericity index (G) and Euler number (E) are combined such that the distribution pattern of the remaining oil can be defined (Table 5).
10
Fig. 7 Remaining oil saturation curves
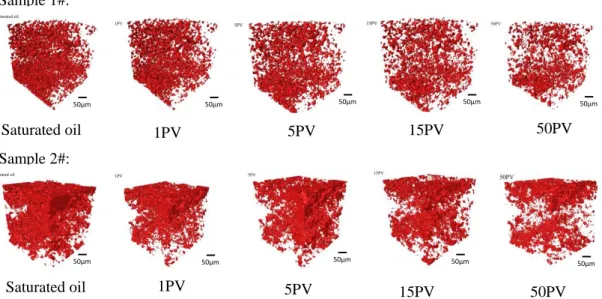
The residual oil saturation decreases with the water flooding (Fig. 7). As the pore structure becomes complicated, the decreasing tendency in the oil saturation slows, and the irreducible oil saturation increases. A three-dimensional visualization of the remaining oil (Fig. 8) during displacement shows that the volume of the remaining oil in the pore spaces is reduced and its distribution patterns are continuously changed.
Fig. 8 Three-dimensional visualization of remaining oil after different brine PV injections
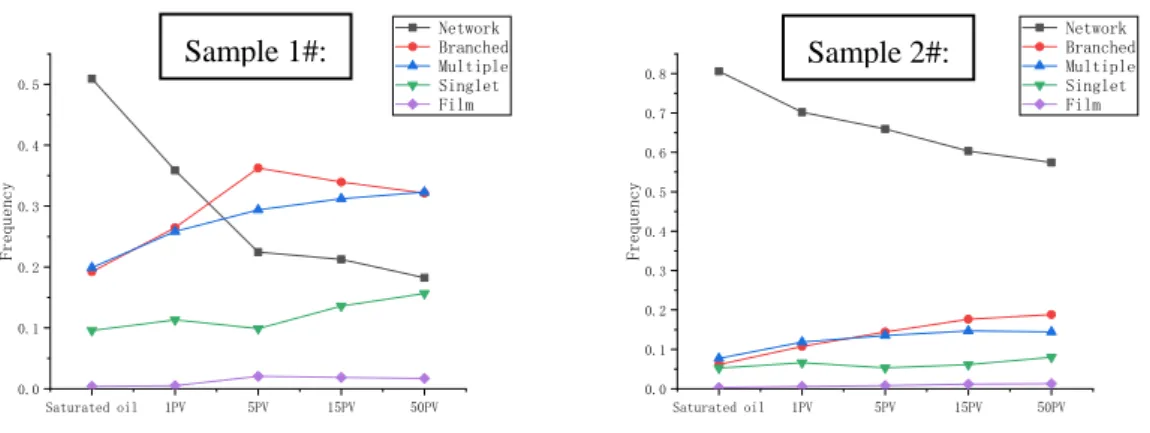
The volume fraction of each remaining oil pattern during each water-flooding stage was calculated, as shown in Fig. 9. Because a large amount of the remaining connected oil exists in the pore space, the distribution pattern of the oil is mainly in a “network” form during the initial stage. With the processing of the water flooding, the oil clusters are cut off, the volume of the network form continually decreases, and the volume of other forms such as the “branched” and “multiple” forms gradually increase. The specific changing trend of the distribution pattern differs over the pore structures. Moreover, oil distributed in a “film” form is too small to acquire at this experimental resolution, and thus the volume of the film is consistently low and does not change much during the entire displacement process.
Saturated oil 1PV 5PV 15PV 50PV 0.20 0.25 0.30 0.35 0.40 0.45 Oil Saturation 1# 2# Saturated oil 1PV 5PV 15PV 50PV Sample 1#: Saturated oil 1PV 5PV 15PV 50PV Sample 2#: 50μm 50μm 50μm 50μm 50μm 50μm 50μm 50μm 50μm 50μm
Fig. 9 Change of distribution pattern during water displacement
Sample #1, which has better connectivity, showed the largest amount of changes in terms of the distribution pattern of the residual oil. At the saturated oil stage, five types of distribution patterns coexist together. The pattern of “network” occupied nearly 50%, and the other shared 50%. With the process of drainage, “network” decreases rapidly, which could due to the breakup of the oil phase affected by the snap-off events. Four other distribution patterns of the residual oil coexisted during the entire displacement process. The distribution pattern is mainly in multiple and branched forms after injection of 50 PV of brine. We also observed a transition from a connected oil phase flow of a network form into disconnected clusters, which break off as fragments. During this process, the volume fraction of the connected oil phase continued decreasing, and the number of oil clusters continued increasing. This can also be seen from the fact that the oil volume of branched and multiple forms increases sharply when the oil in a network form decrease rapidly.
Furthermore, a redistribution of the remaining oil can be observed after the injection of 5 PV of brine. The volume of the branched form increased with the decrease in volume of the multiple forms, which may be because of the coalescence.
In contrast, as for Sample #2, which have a more complicated pore structure, water flooding did not work well owing to the effect of the pore structure. Their remaining oil distribution pattern changes less while the distribution of oil clusters becomes more complex. All five distribution patterns coexist during the entire displacement process, and are mainly in network form.
3.3 Remaining oil distribution during high water cut period
Combining the pore space segmentation and reconstruction of an oil cluster, an oil-rich area where oil is retained can be analyzed. For Sample #1, as shown in Fig. 10. The initial oil is mainly saturated in radius from about 5μm to 25μm, its distribution range is similar to the pore radius frequency curve, and most of the remaining oil clusters are distributed in pores with the radius of 8μm, 12μm and 15μm rather than large pores with a radius more than 20 μm. After water flooding, we can see the significant change that the remaining oil is mainly distributed in pores with radius from 7μm to 12μm, which indicates the remaining oil in radius over 12μm was swept out. During the later period of displacement,a non-uniform displacement can be observed.There was no big change of the oil saturation in a part of pores, meanwhile, the saturation in other pores continue to reduce. Because of flow around a body phenomenon, there are some areas which cannot be swept by the injected water, therefore, a lot of remaining oil is trapped in those pores with a high pore-throat ratio.
Changes in the remaining oil distribution of Sample #2 are shown in Fig. 10. Most of the remaining oil was distributed in pores with a radius ranging between 6 and 19μm prior to the water
Saturated oil 1PV 5PV 15PV 50PV 0.0 0.1 0.2 0.3 0.4 0.5 Frequency Network Branched Multiple Singlet Film Saturated oil 1PV 5PV 15PV 50PV 0.0 0.1 0.2 0.3 0.4 0.5 0.6 0.7 0.8 Frequency Network Branched Multiple Singlet Film Sample 1#: Sample 2#:
12
flooding. As the pore structure becomes more complicated, the swept area of the injected water becomes limited. And pores with a radius ranging between 8 and 12 μm, which abounds in the oil first, still capture a large number of oil clusters. Similar to Sample #1, because an area with a high pore-throat ratio where large pores are encircled by small pores and throats has more potential to trap oil clusters, oil saturation is higher in pores with a radius of 10 μm.
As shown in Fig. 7, the remaining oil saturation of Sample #1 is relatively lower after water flooding. Beside the small oil blobs formed as a singlet or multiple patterns trapped in the swept pores and throats, and also the big oil clusters of branched form usually remained in the large pores (Fig. 9). According to the pore network model, the location with large oil volume can be labelled and analysis. This area, we found that is controlled by the small throats, the large pores trapped with oil has high radius ratio between pores and throats which connected with them, they also have relatively low coordination number and complex shape factor, so that the saturated oil phase was harder to be displaced.
Fig. 11 show the distribution of two sample’s remaining oil in PNM (after water flooding). For Sample #1, we can see that the remaining oil has a more concentrated distribution than Sample #2, and mainly at the corner. As for Sample #2, there are much more pores still remains oil, and the pore size is much smaller than Sample #1.
Fig. 10 Radius frequency distribution curves of pores with oil content
Fig. 11 The main corresponding distribution area of remaining oil in PNM (after water flooding, green is throat while red represent remaining oil in pore)
3.4 Remaining oil distribution during water flooding
Residual oil saturation Original oil saturation
Sample 1#:
Sample 2#:
Original oil saturation Residual oil saturation
Sample 1#:
50μm
Sample 2#:
For the samples with different scales of permeability, there exists a difference in water flooding effectiveness which is also reflected in distribution pattern and location of remaining oil clusters. After a long production history of water flooding, most of the oil in sandstones with relatively high permeability, represented by Sample #1, will be swept, and the remaining oil becomes distributed in multiple and branched form and in pores with a radius of 7–12 μm. However, even in a micro scale experiment, not all pores of high permeability samples can be displaced in the process of water flooding. Rich areas of remaining oil with a high pore throat ratio have little influence under the current stable pressure field. Because the connectivity is poorer than Sample #1, oil clusters in sandstones represented by Sample #2 have local concentrations and global expansion during water flooding. The remaining oil is mainly stuck in pores with a radius of 10 μm in a network form. As for the reason why, the sandstones with low permeability have a low sweep efficiency may relate to the complexity of pore structure, smaller size, and more dispersed pore.
4. Conclusions
High-resolution imaging technology is used to investigate the characteristics of oil distribution in porous media systems during the stage of a high water cut. The findings indicate that the remaining oil distribution is influenced by the pore structure and injected fluid volumes. Because EOR methods for reservoirs containing the remaining oil are greatly influenced by the pore scale entrapment characteristics of the oil phase, this study should result in improvements in our ability to further enhance the oil recovery.
(1) Low-permeability sandstones were more likely to have smaller pores and poor connectivity, which results in the oil production encountering greater resistance. The residual oil saturation tends to increase as the pore structure becomes more complicated, where large oil blobs are trapped in such systems.
(2) During imbibition, the volume of the remaining oil reduced, trapping occurs within an appreciable fraction of the total number of pores in the rock. Meanwhile, the distribution patterns of the oil clusters continuously change during the displacement process, there is one dominating oil cluster in a network form during the initial phase, and is broken into other distribution patterns with the water flooding. Cores with good pore connectivity show the biggest changes in terms of the distribution pattern of the residual oil, transitioning from a connected oil phase flow in a network form into disconnected clusters, which break off into fragments, as can be observed during the displacement. The oil volume in a branched or multiple from increases sharply when the network form of the oil decrease during the stage of a high water cut. The residual oil distribution pattern of cores with a compact pore structure shows smaller changes, whereas the oil clusters have a more complex distribution. Because of the low degree of production, all five distribution patterns coexist during the entire displacement process, which is mainly in a network form.
(3) The initial oil distribution in Samples #1 is mainly in pores with radius range 5-25μm, while the remaining oil after 50PV is mainly in pores of radius of 7-10μm. In sample 2#, the initial oil distribution is a Gaussian type shape from 5 to 25 µm pore radius and turns to pluri-modal trend as for sample 1# with pore radius range between 8 and 12 μm.
Acknowledgement: We would like to express appreciation to the following financial support: the National Natural Science Foundation of China (No.51674280,51490654, 51804328, 51722406,
14
61573018), Key Research and Development Plan of Shandong Province (2018GSF116009), Shandong Province Natural Science Foundation (JQ201808, ZR2018BEE008), the Fundamental Research Funds for the Central Universities (No. 17CX05003, 18CX02168A), National Science and Technology Major Project (2016ZX05010002005), Program for Changjiang Scholars and Innovative Research Team in University (IRT_16R69), and Introducing Talents of Discipline to Universities (B08028).
References
[1] Chatzis, I., Morrow, N. R., and Lim, H. T., 1983, "Magnitude and detailed structure of residual oil saturation," SPE J., 23(2), pp. 311-326.
[2] Wang, W., Shahvali, M., and Su, Y., 2017, "Analytical Solutions for a Quad-linear Flow Model Derived for Multistage Fractured Horizontal Wells in Tight Oil Reservoirs," ASME J. Energy Resour. Technol., 139(1), p. 012905.
[3] Sedaghat, M. H., Ghazanfari, M. H., Parvazdavani, M., and Morshedi, S., 2013, "Experimental Investigation of Microscopic/Macroscopic Efficiency of Polymer Flooding in Fractured Heavy Oil Five-Spot Systems," ASME J. Energy Resour. Technol., 135(3), p. 032901.
[4] Zhang, K., Ma, X., Li, Y., Wu, H., Cui, C., Zhang, X., Zhang, H., and Yao, J., 2018, "Parameter prediction of hydraulic fracture for tight reservoir based on micro-seismic and history matching," Fractals., 26(2), p. 1840009.
[5] Song, W., Yao, J., Li, Y., Sun, H., and Yang, Y., 2018, "Fractal models for gas slippage factor in porous media considering second-order slip and surface adsorption," Int. J. Heat Mass. Tran, 118, pp. 948-960. [6] Zhang, L., Cui, C., Ma, X., Sun, Z., Liu, F., and Zhang, K., 2019, "A fractal discrete fracture network model for history matching of naturally fractured reservoirs," Fractals., 27(1), p. 1940008.
[7] Yang, P., Guo, H., and Yang, D., 2013, "Determination of Residual Oil Distribution during Waterflooding in Tight Oil Formations with NMR Relaxometry Measurements," Energ. Fuel., 27(10), pp. 5750-5756.
[8] Li, J., Yin, J., Zhang, Y., Lu, S., Wang, W., Li, J., Chen, F., and Meng, Y., 2015, "A comparison of experimental methods for describing shale pore features — A case study in the Bohai Bay Basin of eastern China," Int. J. Coal. Geol., 152, pp. 39-49.
[9] Yao, Y., and Liu, D., 2012, "Comparison of low-field NMR and mercury intrusion porosimetry in characterizing pore size distributions of coals," Fuel, 95, pp. 152-158.
[10] Ge, X., Liu, J., Fan, Y., Xing, D., Deng, S., and Cai, J., 2018, "Laboratory Investigation Into the Formation and Dissociation Process of Gas Hydrate by Low-Field NMR Technique," J. Geophys. Res.-Sol. Ea., 123(5), pp. 3339-3346.
[11] Mohebbifar, M., Ghazanfari, M. H., and Vossoughi, M., 2015, "Experimental Investigation of Nano-Biomaterial Applications for Heavy Oil Recovery in Shaly Porous Models: A Pore-Level Study," ASME J. Energy Resour. Technol., 137(1), p. 014501.
[12] Azamipour, V., Assareh, M., Dehghani, M. R., and Mittermeir, G. M., 2017, "An Efficient Workflow for Production Allocation During Water Flooding," ASME J. Energy Resour. Technol., 139(3), p. 032902. [13] Elkatatny, S., Mahmoud, M., and Nasr-El-Din, H. A., 2013, "Filter Cake Properties of Water-Based Drilling Fluids Under Static and Dynamic Conditions Using Computed Tomography Scan," ASME J. Energy Resour. Technol., 135(4), p. 042201.
[14] Pak, T., Butler, I. B., Geiger, S., van Dijke, M. I. J., and Sorbie, K. S., 2015, "Droplet fragmentation: 3D imaging of a previously unidentified pore-scale process during multiphase flow in porous media," P. Natl. Acad. Sci. USA., 112(7), pp. 1947-1952.
[15] Sun, H., Yao, J., Cao, Y.-c., Fan, D.-y., and Zhang, L., 2017, "Characterization of gas transport behaviors in shale gas and tight gas reservoirs by digital rock analysis," Int. J. Heat Mass. Tran, 104, pp. 227-239.
[16] Yang, Y., Liu, Z., Yao, J., Zhang, L., Ma, J., Hejazi, S., Luquot, L., and Ngarta, T., 2018, "Flow simulation of artificially induced microfractures using digital rock and lattice Boltzmann methods," Energies, 11(8), p. 2145.
[17] Zhao, J., Yao, J., Zhang, M., Zhang, L., Yang, Y., Sun, H., An, S., and Li, A., 2016, "Study of Gas Flow Characteristics in Tight Porous Media with a Microscale Lattice Boltzmann Model," Sci. Rep., 6, p. 32393. [18] Culligan, K. A., Wildenschild, D., Christensen, B. S., Gray, W. G., Rivers, M. L., and Tompson, A. F., 2004, "Interfacial area measurements for unsaturated flow through a porous medium," Water Resour. Res., 40(12), p. W12413.
[19] Geistlinger, H., Mohammadian, S., Schlueter, S., and Vogel, H.-J., 2014, "Quantification of capillary trapping of gas clusters using X-ray microtomography," Water Resour. Res., 50(5), pp. 4514-4529. [20] Liu, S., Wang, J. J., He, H., and Wang, H., 2018, "Mechanism on imbibition of fracturing fluid in nanopore," Nanosci. Nanotech. Let., 10(1), pp. 87-93.
[21] Cai, J., Perfect, E., Cheng, C.-L., and Hu, X., 2014, "Generalized modeling of spontaneous imbibition based on Hagen-Poiseuille flow in tortuous capillaries with variably shaped apertures," Langmuir., 30(18), pp. 5142-5151.
[22] Wang, S., Feng, Q., Dong, Y., Han, X., and Wang, S., 2015, "A dynamic pore-scale network model for two-phase imbibition," J. Nat. Gas Sci. Eng., 26, pp. 118-129.
[23] Chen, X., Verma, R., Espinoza, D. N., and Prodanovic, M., 2018, "Pore-Scale Determination of Gas Relative Permeability in Hydrate-Bearing Sediments Using X-Ray Computed Micro-Tomography and Lattice Boltzmann Method," Water Resour. Res., 54(1), pp. 600-608.
[24] Song, W., Yao, J., Li, Y., Sun, H., Zhang, L., Yang, Y., Zhao, J., and Sui, H., 2016, "Apparent gas permeability in an organic-rich shale reservoir," Fuel, 181, pp. 973–984.
[25] Rücker, M., Berg, S., Armstrong, R., Georgiadis, A., Ott, H., Schwing, A., Neiteler, R., Brussee, N., Makurat, A., and Leu, L., 2015, "From connected pathway flow to ganglion dynamics," Geophys. Res. Lett., 42(10), pp. 3888-3894.
[26] Al-Raoush, R. I., 2014, "Experimental investigation of the influence of grain geometry on residual NAPL using synchrotron microtomography," J. Contam. Hydrol., 159, pp. 1-10.
[27] Kumar, M., Knackstedt, M. A., Senden, T. J., Sheppard, A. P., and Middleton, J. P., 2010, "Visualizing and quantifying the residual phase distribution in core material," Petrophysics, 51(5), pp. 323-332. [28] Georgiadis, A., Berg, S., Makurat, A., Maitland, G., and Ott, H., 2013, "Pore-scale micro-computed-tomography imaging: Nonwetting-phase cluster-size distribution during drainage and imbibition," Phys. Rev. E, 88(3), p. 033002.
[29] Krummel, A. T., Datta, S. S., Münster, S., and Weitz, D. A., 2013, "Visualizing multiphase flow and trapped fluid configurations in a model three-dimensional porous medium," Aiche J., 59(3), pp. 1022-1029.
[30] Oughanem, R., Youssef, S., Bauer, D., Peysson, Y., Maire, E., and Vizika, O., 2015, "A Multi-Scale Investigation of Pore Structure Impact on the Mobilization of Trapped Oil by Surfactant Injection," Transport Porous. Med, 109(3), pp. 673-692.
16
[31] Zhou, Y., Helland, J. O., and Jettestuen, E., 2013, "Dynamic capillary pressure curves from pore-scale modeling in mixed-wet-rock images," SPE J., 18(4), pp. 634-645.
[32] Yuan, B., Moghanloo, R. G., and Wang, W., 2018, "Using nanofluids to control fines migration for oil recovery: Nanofluids co-injection or nanofluids pre-flush? -A comprehensive answer," Fuel, 215, pp. 474-483.
[33] Sun, X., Zhang, Y., Chen, G., and Gai, Z., 2017, "Application of nanoparticles in enhanced oil recovery: A critical review of recent progress," Energies, 10(3), p. 345.
[34] Iglauer, S., Paluszny, A., and Blunt, M. J., 2013, "Simultaneous oil recovery and residual gas storage: A pore-level analysis using in situ X-ray micro-tomography," Fuel, 103(1), pp. 905-914.
[35] Yang, Y., Zhang, W., Gao, Y., Wan, Y., Su, Y., An, S., Sun, H., Zhang, L., Zhao, J., Liu, L., Liu, P., Liu, Z., Li, A., and Yao, J., 2016, "Influence of stress sensitivity on microscopic pore structure and fluid flow in porous media," J. Nat. Gas Sci. Eng., 36(Part A), pp. 20-31.
[36] Li, S., Tang, D., Pan, Z., Xu, H., and Huang, W., 2013, "Characterization of the stress sensitivity of pores for different rank coals by nuclear magnetic resonance," Fuel, 111, pp. 746-754.
[37] Yang, Y., Liu, Z., Sun, Z., An, S., Zhang, W., Liu, P., Yao, J., and Ma, J., 2017, "Research on Stress Sensitivity of Fractured Carbonate Reservoirs Based on CT Technology," Energies, 10(11), p. 1833. [38] Andrew, M., Bijeljic, B., and Blunt, M. J., 2014, "Pore-scale contact angle measurements at reservoir conditions using X-ray microtomography," Adv. Water Resour., 68, pp. 24-31.
[39] Al-Raoush, R. I., 2009, "Impact of wettability on pore-scale characteristics of residual nonaqueous phase liquids," Environ. Sci. Technol., 43(13), pp. 4796-4801.
[40] Pan, B., Li, Y., Wang, H., Jones, F., and Iglauer, S., 2018, "CO2 and CH4 Wettabilities of Organic-Rich Shale," Energ. Fuel., 32(2), pp. 1914-1922.
[41] Zhou, Y., Helland, J. O., and Hatzignatiou, D. G., 2014, "Pore-scale modeling of waterflooding in mixed-wet-rock images: Effects of initial saturation and wettability," SPE J., 19(1), pp. 88-100.
[42] Iglauer, S., Fernø, M. A., Shearing, P., and Blunt, M. J., 2012, "Comparison of residual oil cluster size distribution, morphology and saturation in oil-wet and water-wet sandstone," J. Colloid Interf. Sci, 375(1), pp. 187-192.
[43] Karpyn, Z. T., Piri, M., and Singh, G., 2010, "Experimental investigation of trapped oil clusters in a water-wet bead pack using X-ray microtomography," Water Resour. Res., 46(4), p. W04510.
[44] Al-Raoush, R. I., and Willson, C. S., 2005, "A pore-scale investigation of a multiphase porous media system," J. Contam. Hydrol., 77(1), pp. 67-89.
[45] Guo, Y., Wang, Y., and Hou, T., 2011, "Speckle filtering of ultrasonic images using a modified non local-based algorithm," Biomedical Signal Processing and Control, 6(2), pp. 129-138.
[46] Manjon, J. V., Coupe, P., Marti-Bonmati, L., Collins, D. L., and Robles, M., 2010, "Adaptive Non-Local Means Denoising of MR Images With Spatially Varying Noise Levels," J. Magn. Reson. Imaging, 31(1), pp. 192-203.
[47] Sheppard, A. P., Sok, R. M., and Averdunk, H., 2004, "Techniques for image enhancement and segmentation of tomographic images of porous materials," Physica A, 339(1), pp. 145-151.
[48] Yang, Y., Wang, C., Yao, J., and Gao, Y., 2015, "A new voxel upscaling method based on digital rock," Int. J. Multiscale Com., 13(4), pp. 339-346.
[49] Jiang, Z., Wu, K., Couples, G., Van Dijke, M. I. J., Sorbie, K. S., and Ma, J., 2007, "Efficient extraction of networks from three-dimensional porous media," Water Resour. Res., 43(12), p. W12S03.
[50] Danielsson, P.-E., 1980, "Euclidean distance mapping," Comput. Graph. Image Process., 14(3), pp. 227-248.
[51] Wildenschild, D., and Sheppard, A. P., 2013, "X-ray imaging and analysis techniques for quantifying pore-scale structure and processes in subsurface porous medium systems," Adv. Water Resour., 51(1), pp. 217-246.
[52] Blunt, M. J., 2001, "Flow in porous media—pore-network models and multiphase flow," Curr. Opin. Colloid In, 6(3), pp. 197-207.
[53] Yang, Y., Liu, P., Zhang, W., Liu, Z., Sun, H., Zhang, L., Zhao, J., Song, W., Liu, L., An, S., and Yao, J., 2016, "Effect of the pore size distribution on the displacement efficiency of multiphase flow in porous media," Open Phys., 14(1), pp. 610-616.
[54] Liu, G. F., Bai, Y. X., Gu, D. H., Lu, Y., and Yang, D. Y., 2018, "Determination of static and dynamic characteristics of microscopic pore-throat structure in a tight oil-bearing sandstone formation," Aapg Bull., 102(9), pp. 1867-1892.
[55] Vogel, H., 2000, "A numerical experiment on pore size, pore connectivity, water retention, permeability, and solute transport using network models," Eur. J. Soil Sci., 51(1), pp. 99-105.
[56] Yang, Y., Yao, J., Wang, C., Gao, Y., Zhang, Q., An, S., and Song, W., 2015, "New pore space characterization method of shale matrix formation by considering organic and inorganic pores," J. Nat. Gas Sci. Eng., 27(P2), pp. 496-503.
[57] Yao, J., Wang, C., Yang, Y., Hu, R., and Wang, X., 2013, "The construction of carbonate digital rock with hybrid superposition method," J. Petrol. Sci. Eng., 110, pp. 263-267.
[58] Prodanović, M., Lindquist, W. B., and Seright, R. S., 2007, "3D image-based characterization of fluid displacement in a Berea core," Adv. Water Resour., 30(2), pp. 214-226.
[59] Kong, T. Y., and Rosenfeld, A., 1989, "Digital topology: Introduction and survey," Comput. Vis. Graphic. Image Process., 48(3), pp. 357-393.