HAL Id: hal-00302170
https://hal.archives-ouvertes.fr/hal-00302170
Submitted on 29 Sep 2006HAL is a multi-disciplinary open access
archive for the deposit and dissemination of sci-entific research documents, whether they are pub-lished or not. The documents may come from teaching and research institutions in France or abroad, or from public or private research centers.
L’archive ouverte pluridisciplinaire HAL, est destinée au dépôt et à la diffusion de documents scientifiques de niveau recherche, publiés ou non, émanant des établissements d’enseignement et de recherche français ou étrangers, des laboratoires publics ou privés.
Mirror image hydrocarbons from Tropical and Boreal
forests
J. Williams, N. Yassaa, S. Bartenbach, J. Lelieveld
To cite this version:
J. Williams, N. Yassaa, S. Bartenbach, J. Lelieveld. Mirror image hydrocarbons from Tropical and Boreal forests. Atmospheric Chemistry and Physics Discussions, European Geosciences Union, 2006, 6 (5), pp.9583-9602. �hal-00302170�
ACPD
6, 9583–9602, 2006Mirror image hydrocarbons from Tropical and Boreal
forests J. Williams et al. Title Page Abstract Introduction Conclusions References Tables Figures J I J I Back Close
Full Screen / Esc
Printer-friendly Version Interactive Discussion
Atmos. Chem. Phys. Discuss., 6, 9583–9602, 2006 www.atmos-chem-phys-discuss.net/6/9583/2006/ © Author(s) 2006. This work is licensed
under a Creative Commons License.
Atmospheric Chemistry and Physics Discussions
Mirror image hydrocarbons from Tropical
and Boreal forests
J. Williams, N. Yassaa, S. Bartenbach, and J. Lelieveld
Air Chemistry Department, Max-Planck Institute for Chemistry, J. J. Becher Weg 27, 55020 Mainz, Germany
Received: 22 August 2006 – Accepted: 18 September 2006 – Published: 29 September 2006 Correspondence to: J. Williams (williams@mpch-mainz.mpg.de)
ACPD
6, 9583–9602, 2006Mirror image hydrocarbons from Tropical and Boreal
forests J. Williams et al. Title Page Abstract Introduction Conclusions References Tables Figures J I J I Back Close
Full Screen / Esc
Printer-friendly Version Interactive Discussion
Abstract
Monoterpenes, emitted in large quantities by trees to attract pollinators and repel her-bivores, can exist in mirror image forms called enantiomers. In this study such enan-tiomeric pairs have been measured in ambient air over extensive forest ecosystems in South America and northern Europe. For the dominant monoterpene, α-pinene, 5
the (−)-form was measured in large excess over the (+)-form over the Tropical rainfor-est, whereas the reverse was observed over the Boreal forest. Interestingly, over the Tropical forest (−)-α-pinene did not correlate with its own enantiomer, but correlated well with isoprene. The results indicate a remarkable ecosystem scale enantiomeric fingerprint and a nexus between the biosphere and atmosphere.
10
1 Introduction
Monoterpenes and isoprene together make up 55% of the estimated 1150 TgC (Tg=1012g) of biogenic volatile organic compounds emitted each year into our atmo-sphere (Guenther et al., 1995). Monoterpenes alone are comparable to the 150 TgC yr−1 total emissions estimated from all anthropogenic sources including fossil fuel us-15
age and biomass burning (M ¨uller, 1992). Both isoprene and the monoterpenes react rapidly with the atmosphere’s primary oxidant OH (Atkinson and Arey, 2003; Fuentes et al., 2000), and are known to impact ozone and produce secondary organic aerosol, thereby affecting the Earth’s radiation energy budget (Seinfeld, 2003; Claeys et al., 2004; Williams, 2004). The global effect of these gases on atmospheric chemistry has 20
been assessed by models (Wang et al., 1998; Houweling et al., 1998), however, such work is crucially dependent on emission algorithms which are uncertain, particularly in the case of monoterpenes (Guenther et al., 1995; Shao et al., 2001). Leaf scale studies have established that isoprene emissions can be parameterized as a func-tion of light and temperature (Guenther et al., 1995). Unlike isoprene, monoterpenes 25
ACPD
6, 9583–9602, 2006Mirror image hydrocarbons from Tropical and Boreal
forests J. Williams et al. Title Page Abstract Introduction Conclusions References Tables Figures J I J I Back Close
Full Screen / Esc
Printer-friendly Version Interactive Discussion
point whether the monoterpene emissions are light dependent or not (Lerdau and Gray, 2003; Tarvainen et al., 2005). Many of the monoterpenes considered in present day models are chiral compounds, which means they exist in two distinct forms that are mir-ror images called enantiomers. For example α-pinene occurs as both (+)-α-pinene and (−)-α-pinene, see Fig. 1, although they are typically measured and modeled together 5
as one substance in ambient air studies. Therefore emission algorithms deduced from studies of α-pinene assume both enantiomeric constituents behave similarly (Shao et al., 2001; Tarvainen et al., 2005), although from a biosynthetic point of view, the two enantiomers of a chiral monoterpene often exhibit differences in biological activ-ity (Croteau, 1987). Here we present the first set of monoterpene measurements to 10
resolve these enantiomers in air over large Tropical and Boreal forest ecosystems.
2 Experimental
2.1 Analytical
For a given pair of monoterpene enantiomers (e.g. (+)- and (−)-α-pinene, having abso-lute configurations (1R,5R) and (1S,5S) α-pinene respectively), both compounds have 15
exactly the same molecular formula, mass, and physical properties such as boiling point, freezing point, and density. Nonetheless, such compounds cannot be struc-turally superimposed, and are distinguishable by their interaction with plane polarized light. Unsurprisingly these compounds are difficult to physically separate from a mix-ture and no leaf scale emission rate studies to date have resolved these enantiomers. 20
For ambient air analysis on an ecosystem scale we exploit the recent development of modified cyclodextrin chromatography columns, which have allowed enantiomers to be resolved from single plant emissions and from essential oils (Yassaa et al., 2001; Yassaa and Williams, 2005). The enantiomers are chromatographically resolved by selective inclusion into the cavity of a chiral macromolecule constructed from glycosidi-25
cally connected glucose molecules and detected by mass spectrometry. 9585
ACPD
6, 9583–9602, 2006Mirror image hydrocarbons from Tropical and Boreal
forests J. Williams et al. Title Page Abstract Introduction Conclusions References Tables Figures J I J I Back Close
Full Screen / Esc
Printer-friendly Version Interactive Discussion
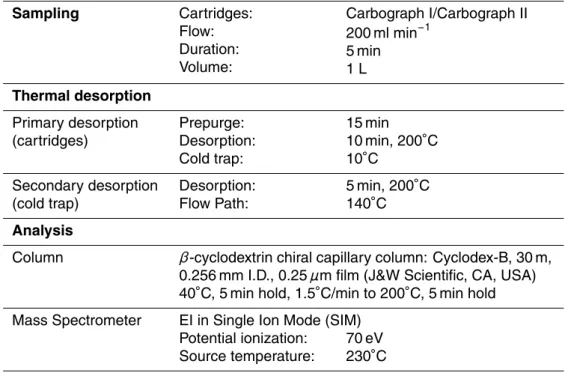
The GC-MS analysis system used to analyse the cartridges consists of an air con-centrating autosampler and a thermal desorber (Markes Int., Pontyclun, UK), coupled to a gas chromatograph (GC6890A, Agilent Technologies, CA, USA) linked to a Mass Selective Detector (MSD 5973 inert) from the same company. All pertinent analysis pa-rameters are summarised in Table 1. Laboratory multipoint calibrations showed good 5
linearity within the concentration ranges measured. One-point calibrations of 250 ml VOC standard Riemer, CT, USA) and 100 ml of an enantiomeric terpene (Apel-Riemer, CT, USA, stated accuracy 5%) standard were carried out at the beginning and the middle of each flight analysis for the Tropical data and at 3 hourly intervals for the Boreal forest data. Blanks were taken regularly and showed no high levels for the com-10
pounds discussed. The total measurement uncertainties were between 10 and 15%, the detection limit ranged from 0.5 pptv to 5 pptv. An example sample from the Tropical rainforest, the boreal forest and a calibration chromatogram are shown in Fig. 2.
Airborne sampling for monoterpenes over the Tropical rainforest was performed us-ing a custom built cartridge samplus-ing device installed within a standard aircraft wus-ing- wing-15
pod, see Fig. 3. The device was mounted underneath the port wing of a Learjet aircraft and operated from within the cabin via a communication cable. The system was de-signed to collect ambient air samples in flight within 18 cartridges and 18 stainless steel canisters. A flight was typically 3 h in duration, range ca. 1800 km so that a cartridge was filled every 10 min. Flights were performed in the daylight from 07:30–17:30 local 20
time. Three identical systems were built to allow rapid changeovers between flights. For the airborne samples, outside air was drawn by a metal bellows pump (Senior Aerospace, Lambsheim, Germany) into the system through a 8.5 mm diameter stain-less steel inlet located at the front of the wing-pod. The pump was connected to the canisters and the cartridge sampling sections by heated 0.64 mm stainless steel tubing. 25
Calibrated mass flow-controllers (MKS) regulated the air flow through the system and a custom made processor was used to set the parameters and record the sampling pro-cesses. The sample tubes were fitted into the flow path approximately 80 cm after the pump with Swagelok Ultra-Torr stainless steel fittings (B.E.S.T. GmbH, Maintal,
Ger-ACPD
6, 9583–9602, 2006Mirror image hydrocarbons from Tropical and Boreal
forests J. Williams et al. Title Page Abstract Introduction Conclusions References Tables Figures J I J I Back Close
Full Screen / Esc
Printer-friendly Version Interactive Discussion
many) and sealed with 2-way electromagnetic valves (Fluitronics GmbH, D ¨usseldorf, Germany) at the entrance and the exit. The valves could be opened and closed si-multaneously via the software. During the sampling, the inlet and outlet valves of the selected cartridge are opened and the sample flow (200 ml/min) passed over the sor-bent for 5 min. Cartridges were filled every 10 min and, up to 17 of the 18 available 5
cartridges (at least one blank was flown i.e. cartridge that was not opened in flight) were filled per measurement flight. To minimise the sample contamination from airport air, the pump was started 5 min after take-off.
Prior to flight, the stainless steel, two-bed sampling cartridges (Carbograph I/ Car-bograph II; Markes International, Pontyclun, UK) were cleaned with the Thermocondi-10
tioner TC-020 (Markes International, Pontyclun, UK). Cleaning was achieved by purg-ing with helium 6.0 (99.9999%, Messer-Griesheim, Germany) for 120 min at 350◦C and 30 min at 380◦C. For storage the cartridges were sealed with brass caps with PTFE ferrules and put into an airtight metal container (Rotilabo, Carl Roth GmbH & Co, Karlsruhe, Germany). After sampling, the cartridges were stored in a separate 15
airtight metal container a maximum of 12 h. Shortly before the analysis, the brass caps were exchanged for DiffLok-caps (Markes International, Pontyclun, UK). In total, 140 cartridges were sampled from 0–10 km altitude and between 6–3.5◦N and 129–123◦W. 2.2 Tropical forest location
The northeast coast of South America in October is an excellent location to study the 20
effects of the unperturbed Tropical rainforest on atmospheric trace gas composition. In October 2005 the ITCZ was located to the north of Suriname at approximately 10– 15◦N. Thus at this time of year, although geographically in the northern hemisphere, Suriname was atmospherically in the southern hemisphere and under the influence of the steady south easterly trade winds. As clean marine boundary layer air advected 25
westwards over the pristine tropical rainforests of French Guyana and Suriname, trace gas exchange occurred over long fetches of pristine rainforest. Trace gases emitted by the forest (e.g. isoprene, monoterpenes) are released into the well-mixed boundary
ACPD
6, 9583–9602, 2006Mirror image hydrocarbons from Tropical and Boreal
forests J. Williams et al. Title Page Abstract Introduction Conclusions References Tables Figures J I J I Back Close
Full Screen / Esc
Printer-friendly Version Interactive Discussion
layer (∼1.5 km) and oxidized as the air masses travel westwards. The ground based samples presented here were taken at the Suriname meteorological station of Browns-berg (4◦530N, 55◦130W, 500 m). Ambient air was drawn rapidly (ca. 100 l/min) from the canopy top (50 m) through a 1.91 cm diameter shrouded Teflon inlet mounted on a 50 m telecommunications tower. The tower was sited on a hill (500 m) adjacent to the 5
Brokopondo lake. Upwind from the site is 300–400 km of pristine rainforest before the coast of French Guyana. The ground based site, Brownsberg, was approximately cen-tral to the operational area of the aircraft which ranged from 6–3.5◦N and 129–123◦W. A view from the ground based site is given in Fig. 4a.
2.3 Boreal forest location 10
Chiral and achiral monoterpenes were measured in Scots pine forest in the Hyyti ¨al ¨a (61◦510N 24◦170E) meteorological station located in the south of Finland. Monoter-penes were sampled at 8 m height using a thermal desorber (Markes Int., Pontyclun, UK) operated in on-line mode. Volatile Organic Compounds (VOCs) collected in an adsorbent tube by drawing air at 50 ml/min for 1 h sampling duration, were thermally 15
desorbed into GC/MS equipped with a β-cyclcodextrin capillary column and operated with the same conditions as described above. The same calibration procedure was also adopted in boreal forest. Diel profiles of monoterpenes were obtained for one month throughout April 2005. It should be noted that the Scots Pine is weak or not an isoprene emitter and hence isoprene/monoterpene correlations were not compared for 20
the Boreal forest in this work. A picture of the Boreal forest is given in Fig. 4b. 2.4 Botanical garden location
For comparison with the Tropical data further cartridge samples were taken from the Botanical Garden of the Johannes Gutenberg-University which is part of the Institut f ¨ur Spezielle Botanik in the Department of Biology. The Garden covers an area of nearly 25
ACPD
6, 9583–9602, 2006Mirror image hydrocarbons from Tropical and Boreal
forests J. Williams et al. Title Page Abstract Introduction Conclusions References Tables Figures J I J I Back Close
Full Screen / Esc
Printer-friendly Version Interactive Discussion
cultivars from all over the world. Cartridges were taken within three large (ca. 300 m3) greenhouses (Fig. 4c). The sampling procedure was exactly as used in the aircraft samples. The plants within are from various continents. They are kept at 30◦C and high humidity. The distance to the institute where the samples were analyzed is ap-proximately 500 m. All samples were analyzed on the same day as their collection. 5
3 Results
In October 2005, measurements of isoprene as well as chiral and achiral monoter-penes were made from a jet aircraft over a pristine rainforest (5–2◦N, 51–58◦W). The distribution of enantiomeric monoterpenes is shown in Fig. 5 for both the Tropical forest in South America (French Guyana, Suriname and Guyana) and a ground based cam-10
paign in a Boreal forest (Hyyti ¨al ¨a, Finland) performed in the same year. For the Trop-ical dataset, the monoterpene species detected in order of decreasing average mix-ing ratio were: (−)-α-pinene 74 pptv, (+)-β-pinene 45 pptv, (−)-limonene 40 pptv, (+)-α-pinene 34 pptv, (+)-camphene 9 pptv, (+)-δ-3-carene 9 pptv, (−)-camphene 6 pptv, (+)-limonene 4 pptv. When both enantiomers are summed then the most abundant 15
monoterpene was α-pinene accounting about 51% of the total of measured monoter-penes, consistent with previous rainforest studies (Kesselmeier et al., 2000). In the case of α-pinene, highlighted green in Fig. 5, the (−)-enantiomer was discovered to be clearly enriched relative to the (+)-enantiomer in 80% of measurements over the Tropi-cal forest (10 flights), in most cases between 2–8 times. Additional ground based mea-20
surements from the top of the Tropical forest canopy in the same region also showed an enantiomeric excess of (−)-α-pinene throughout the diel cycle. Since both enan-tiomers react with OH and O3 at exactly the same rate (Nunes et al., 2005), the dom-inance of the (−)-α-pinene enantiomer over the Tropical forest must be a function of selective emission or uptake rather than chemical removal. Sharply contrasting results 25
were discovered in the Boreal forest of Finland in April 2005 using the same instru-mentation. The air over the Boreal forest in spring showed a clear predominance of
ACPD
6, 9583–9602, 2006Mirror image hydrocarbons from Tropical and Boreal
forests J. Williams et al. Title Page Abstract Introduction Conclusions References Tables Figures J I J I Back Close
Full Screen / Esc
Printer-friendly Version Interactive Discussion
(+)-α-pinene for all samples, see Fig. 5. As far as we are aware, the only other enan-tiomeric selective study of emissions in ambient air available in literature examined individual Mediterranean tree species and showed that for some species (−)-α-pinene dominated (e.g. Quercus ilex L.) while for others it was (+)-α-pinene (e.g. Cypresses and Eucalyptus) (Yassaa et al., 2001). In order to confirm the apparent dominance of 5
(−)-α-pinene over the rainforest ecosystem we also tested three mixed-species Trop-ical greenhouses (ca. 300 m3) in the Mainz University Botanical garden, Germany. In all three cases an enantiomeric excess of (−)-α-pinene was found, consistent with our findings over the rainforest.
Most remarkable for the Tropical rainforest measurements was the correlation of the 10
individual α-pinene enantiomers with isoprene, shown in Fig. 6. While (+)-α-pinene showed no significant correlation with isoprene, the (−)-α-pinene enantiomer showed a significant correlation in the terrestrial boundary layer (r=0.6, altitude range 0–2 km). As the individual monoterpene enantiomers have not been considered in previous stud-ies of this kind, one might reasonably assume the (+)- and (−)-α-pinene correlate to 15
some extent, or be emitted in response to the same stimuli, however, (−)-α-pinene correlates much better with isoprene than it does with it’s own mirror image enantiomer (+)-α-pinene. This suggests that while (−)-α-pinene emission is light dependent like isoprene, (+)-α-pinene is temperature dependent only and therefore unlikely to be of significance in the Tropics. This hypothesis is consistent with our results from the 20
Boreal forest which was (+)-α-pinene dominated, see Fig. 5, since recent independent results from the same location have found that non-enantiomerically resolved α-pinene emission rates could be described solely by a temperature dependent emission algo-rithm (Tarvainen et al., 2005). Furthermore the monoterpene emissions for Quercus ilex, which has been established to be predominately (−)-α-pinene emitting (Yassaa et
25
al., 2001), have been shown to fit a light and temperature dependent emission algo-rithm in independent studies (Plaza et al., 2005).
ACPD
6, 9583–9602, 2006Mirror image hydrocarbons from Tropical and Boreal
forests J. Williams et al. Title Page Abstract Introduction Conclusions References Tables Figures J I J I Back Close
Full Screen / Esc
Printer-friendly Version Interactive Discussion
4 Discussion
We assume the broad scale predominance of (−)-α-pinene in air over the biodiverse rainforest was biologically determined. However, previous enantiomeric analyses of individual tree xylem have shown highly variable enantiomeric ratios from 90% (−)-α-pinene to 80% (+)-α-pinene, even from different parts of the same tree (Norin, 1996; 5
F ¨aldt et al., 2001). In contrast, the spatially and temporally more extensive ecosystem scale data presented here shows a clear enantiomeric predominance in ambient air, so what could be the underlying reason for the clear dominance of the (−)-form in air over the rainforest? The natural world uses the air as a communication medium and such specific volatiles can signal opportunity to insects, pathogens and pollinators alike, or 10
serve as a chemical defense (e.g. Croteau, 1987; Baldwin et al., 2006). The ecosys-tem relies on the atmosphere to rapidly oxidize these signaling compounds to preserve chemical gradients and thus the communication bandwidth. Trees, insects and even our own sense of smell can distinguish between certain enantiomeric monoterpenes since sensory organs are made up of proteins which are also chiral and hence chi-15
rally selective (Greer and Wainer, 2002). One possibility is that, in addition to the thermotolerance and antioxidant effects of (−)-α-pinene emissions (Penuelas et al., 2005), it is advantageous for communication that certain monoterpenes are available throughout the ecosystem. Some insects (e.g. the bark beetle, Ips paraconfusus) can transform the specific monoterpene enantiomer (−)-α-pinene where available, into a 20
specific product (+)-cis-verbenol which acts as an aggregation pheromone (Renwick et al., 1976). Such interactions are complex and usually investigated for single com-pounds and specific species of tree and insect. Since it has been established that the presence of one enantiomer can re-enforce, negate or enable the sensory effect of the other (Mori, 2002), the widespread presence of particular monoterpenes in the 25
forest air may be considered as the “background noise” through which the vegetation communicates.
ACPD
6, 9583–9602, 2006Mirror image hydrocarbons from Tropical and Boreal
forests J. Williams et al. Title Page Abstract Introduction Conclusions References Tables Figures J I J I Back Close
Full Screen / Esc
Printer-friendly Version Interactive Discussion
5 Conclusions
We conclude that for future atmospheric chemistry, biological and ecological studies, the enantiomers of monoterpenes should be regarded and measured separately as distinct species. Moreover if insect/insect or insect/plant interactions are being investi-gated the distribution in air rather than solely in the xylem of individual species should 5
be analysed, and this rainforest background distribution of monoterpenes considered in future experiments. The unexpected correlations between isoprene and the α-pinene enantiomers shown here suggest that monoterpene responses to light and tempera-ture may have been confused in the past because of the co-elution of the enantiomers. Perhaps the Tropical trees make use of the diel cycle in solar intensity in communi-10
cating with insects, whereas in Boreal latitudes the information would be obscured by the highly variable day length and the much stronger temperature variations. The im-plication is that many leaf scale studies of temperature and light responses (Owen et al., 2002), and large scale emission distribution measurements (Klinger et al., 2002; Geron et al., 2000) should be repeated with enantiomeric discrimination of monoter-15
penes, while there is a need to better understand forest emissions and genotype dis-tribution. Such knowledge will be essential for the accurate modelling of present and future atmospheric hydrocarbon emissions by forests, and recognise the sophistication of interactions between flora, fauna and the atmospheric environment.
Acknowledgements. We thank J. Kesselmeier, R. Winterhalter and J. Crowley from the Max
20
Planck Institute for Chemistry in Mainz for helpful discussions. We thank the workers of the Johannes Gutenberg-University Botanical garden for kindly providing access to the tropical greenhouses.
References
Atkinson, R. and Arey, J.: Gas Phase tropospheric chemistry of biogenic volatile organic
com-25
ACPD
6, 9583–9602, 2006Mirror image hydrocarbons from Tropical and Boreal
forests J. Williams et al. Title Page Abstract Introduction Conclusions References Tables Figures J I J I Back Close
Full Screen / Esc
Printer-friendly Version Interactive Discussion
Baldwin, I. T., Halitschke, R., Paschold, A., von Dahl, C. C., and Preston, C. A.: Volatile signal-ing in plant-plant interactions: “Talksignal-ing trees” in the genomics era, Science, 311, 812–815, 2006.
Claeys, M., Graham, B., Gyorgy, V., Wang, W., Vermeylen, R., Pashynska, V., Cafmeyer, J., Guyon, P., Andreae, M. O., Artaxo, P., and Maenhaut, W.: Formation of secondary organic
5
aerosols through photooxidation of isoprene, Science, 303, 1173–1176, 2004.
Croteau, R.: Biosynthesis and catabolism of monoterpenoids, Chem. Rev., 87, 929–954, 1987.
F ¨aldt, J., Sjodin, K., Persson, M., Valterova, I., and Borg-Karlson, A. K.: Correlations between selected monoterpene hydrocarbons in the xylem of six Pinus (pinaceae) species,
Chemoe-10
cology, 11, 97–106, 2001.
Fuentes, J. D., Lerdau, M., Atkinson, R., Baldocchi, D., Bottenheim, J. W., Ciccioli, P., Lamb, B., Geron, C., Gu, L., Guenther, A., Sharkey, T. D., and Stockwell, W.: Biogenic hydrocarbons in the atmospheric boundary layer: A review, Bull. Am. Meteorol. Soc., 81, 1537–1575, 2000. Geron, C., Rasmussen, R., Arnts, R. R., and Guenther, A.: A review and synthesis of
monoter-15
pene speciation from forests in the United States, Atmos. Environ., 34, 1761–1781, 2000. Greer, J. and Wainer, I. W.: The molecular basis of chiral recognition, in: Chapter 4, The
molecular basis of chiral recognition, edited by: Lough, W. J. and Wainer, I. W., Chirality in Natural and Applied Science, CRC Press, Blackwell Publishing, Oxford, 2002.
Guenther, A., Hewitt, C. N., Erickson, D., Fall, R., Geron, C., Graedel, T., Harley, P., Klinger,
20
L., Lerdau, M., Mckay, W. A., Pierce, T., Scholes, B., Steinbrecher, R., Tallamraju, R., Taylor, J., and Zimmerman, P.: A global-model of natural volatile organic compound emissions, J. Geophys. Res., 100, 8873–8892, 1995.
Houweling, S., Dentener, F., and Lelieveld, J.: The impact of nonmethane hydrocarbon com-pounds on tropospheric photochemistry, J. Geophys. Res., 103, 10 673–10 696, 1998.
25
Kesselmeier, J., Kuhn, U., Wolf, A., Andreae, M. O., Ciccioli, P., Brancaleoni, E., Frattoni, M., Guenther, A., Greenberg, J., Vasconcellos, P. D., de Oliva, T., Tavares, T., and Artaxo, P.: Atmospheric volatile organic compounds (VOC) at a remote tropical forest site in central Amazonia, Atmos. Environ., 34, 4063–4072, 2000.
Klinger, L. F., Li, Q. J., Guenther, A. B., Greenberg, J. P., Baker, B., and Bai, J. H.:
Assess-30
ment of volatile organic compound emissions from ecosystems of China, J. Geophys. Res., 107(D21), 4603, doi:10.1029/2001JD001076, 2002.
Lerdau, M. and Gray, D.: Ecology and evolution of light-dependent and light-independent
ACPD
6, 9583–9602, 2006Mirror image hydrocarbons from Tropical and Boreal
forests J. Williams et al. Title Page Abstract Introduction Conclusions References Tables Figures J I J I Back Close
Full Screen / Esc
Printer-friendly Version Interactive Discussion
togenic volatile organic carbon, New Phytologist, 157, 199–211, 2003.
Mori, K.: Chirality in the natural world: Chemical communications, in: Chapter 9, Chirality in the natural world: Chemical communications, edited by: Lough, W. J. and Wainer, I. W., Chirality in Natural and Applied Science, CRC Press, Blackwell Publishing, Oxford, 2002.
Muller, J. F.: Geographical distribution and seasonal variation of surface emissions and
depo-5
sition velocities of atmospheric trace gases, J. Geophys. Res., 97, 3787–3804 1992. Norin, T.: Chiral chemodiversity and its role for biological activity. Some observations from
studies on insect/insect and insect/plant relationships, Pure Appl. Chem., 68, 2043–2049, 1996.
Nunes, F. M. N., Veloso, M. C. C., Pereira, P. A. D. P., and de Andrade, J. B.: Gas-phase
10
ozonolysis of the monoterpenoids (S)-(+)-carvone, (R)-(−)-carvone, (−)-carveol, geraniol and citral, Atmos. Environ., 39, 7715–7730, 2005.
Owen, S. M., Harley, P., Guenther, A., and Hewitt, C. N.: Light dependency of VOC emissions from selected Mediterranean plant species, Atmos. Environ., 36, 3147–3159, 2002.
Penuelas, J., Llusia, J., Asensio, D., and Munne-Bosch, S.: Linking isoprene with plant
ther-15
motolerance, antioxidants and monoterpene emissions, Plant Cell Environ., 28, 278–286, 2005.
Plaza, J., Nunez, L., Pujadas, M., Perrez-Pastor, R., Bermejo, V., Garcia-Alonso, S., and Elvira, S.: Field monoterpene emission of Mediterranean oak (Quercus ilex) in the central Iberian Peninsula measured by enclosure and micrometeorological techniques: Observation
20
of drought stress effect, J. Geophys. Res., 110(D3), D03303, doi:10.1029/2004JD005168, 2005.
Renwick, J. A. A., Hughes, P. R., and Krull, I. S.: Selective production of cis and trans-verbenol from (−) and (+) alpha pinene by a bark beetle, Science, 191, 199–201, 1976.
Seinfeld, J. H. and Pankow, J. F.: Organic atmospheric particulate material, Ann. Rev. Phys.
25
Chem., 54, 121–140, 2003.
Shao, M., Czapiewski, K. V., Heiden, A. C., Kobel, K., Komenda, M., Koppmann, R., and Wildt, J.: Volatile organic compound emissions from Scots pine: Mechanisms and description by algorithms, J. Geophys. Res., 106, 20 483–20 492, 2001.
Tarvainen, V., Hakola, H., Hell ´en, H., B ¨ack, J., Hari, P., and Kulmala, M.: Temperature and light
30
dependence of the VOC emissions of Scots pine, Atmos. Chem. Phys., 5, 989–998, 2005. Wang, Y. H., Jacob, D. J., and Logan, J. A.: Global simulation of tropospheric
hydro-ACPD
6, 9583–9602, 2006Mirror image hydrocarbons from Tropical and Boreal
forests J. Williams et al. Title Page Abstract Introduction Conclusions References Tables Figures J I J I Back Close
Full Screen / Esc
Printer-friendly Version Interactive Discussion
carbons, J. Geophys. Res., 103, 10 757–10 767, 1998.
Williams, J.: Organic trace gases: An overview, Environ. Chem., 1, 125–136, 2004.
Yassaa, N., Brancaleoni, E., Frattoni, M., and Ciccioli, P.: Trace level determination of enan-tiomeric monoterpenes in terrestrial plant emission and in the atmosphere using a β-cyclodextrin capillary column coupled with thermal desorption and mass spectrometry, J.
5
Chromatogr. A, 915, 185–197, 2001.
Yassaa, N. and Williams, J.: Analysis of enantiomeric and non-enantiomeric monoterpenes in plant emissions using portable dynamic air sampling/solid-phase microextraction (PDAS-SPME) and chiral gas chromatography/mass spectrometry, Atmos. Environ., 39, 4875–4884, 2005.
10
ACPD
6, 9583–9602, 2006Mirror image hydrocarbons from Tropical and Boreal
forests J. Williams et al. Title Page Abstract Introduction Conclusions References Tables Figures J I J I Back Close
Full Screen / Esc
Printer-friendly Version Interactive Discussion
Table 1. Sampling, desorption and analysis data for the Tropical rainforest measurement. Sampling Cartridges: Flow: Duration: Volume: Carbograph I/Carbograph II 200 ml min−1 5 min 1 L Thermal desorption Primary desorption (cartridges) Prepurge: Desorption: Cold trap: 15 min 10 min, 200◦C 10◦C Secondary desorption (cold trap) Desorption: Flow Path: 5 min, 200◦C 140◦C Analysis
Column β-cyclodextrin chiral capillary column: Cyclodex-B, 30 m,
0.256 mm I.D., 0.25 µm film (J&W Scientific, CA, USA) 40◦C, 5 min hold, 1.5◦C/min to 200◦C, 5 min hold Mass Spectrometer EI in Single Ion Mode (SIM)
Potential ionization: Source temperature:
70 eV 230◦C
ACPD
6, 9583–9602, 2006Mirror image hydrocarbons from Tropical and Boreal
forests J. Williams et al. Title Page Abstract Introduction Conclusions References Tables Figures J I J I Back Close
Full Screen / Esc
Printer-friendly Version Interactive Discussion
Fig. 1. Mirror image enantioners of alpha pinene. (−)-α-pinene S (1S,5S) is labeled (a), and (+)-α-pinene R (1R,5R) labeled (b).
ACPD
6, 9583–9602, 2006Mirror image hydrocarbons from Tropical and Boreal
forests J. Williams et al. Title Page Abstract Introduction Conclusions References Tables Figures J I J I Back Close
Full Screen / Esc
Printer-friendly Version Interactive Discussion
ACPD
6, 9583–9602, 2006Mirror image hydrocarbons from Tropical and Boreal
forests J. Williams et al. Title Page Abstract Introduction Conclusions References Tables Figures J I J I Back Close
Full Screen / Esc
Printer-friendly Version Interactive Discussion
Fig. 3. Example separations using the beta-cyclodextrin column.
ACPD
6, 9583–9602, 2006Mirror image hydrocarbons from Tropical and Boreal
forests J. Williams et al. Title Page Abstract Introduction Conclusions References Tables Figures J I J I Back Close
Full Screen / Esc
Printer-friendly Version Interactive Discussion
Fig. 4. (a) A view over the region probed by the aircraft from the ground based site Brownsberg. (b) The Boreal forest at the Hyyti ¨al ¨a meteorological station, Finland. (c) Greenhouse in the Mainz Botanical Garden.
ACPD
6, 9583–9602, 2006Mirror image hydrocarbons from Tropical and Boreal
forests J. Williams et al. Title Page Abstract Introduction Conclusions References Tables Figures J I J I Back Close
Full Screen / Esc
Printer-friendly Version Interactive Discussion
Fig. 5. Enantiomeric distributions of monoterpenes in Tropical forest (October 2005) and Boreal forest (April 2005). The enantiomers of α-pinene are highlighted in green. Vertical bars show the range of the measurements.
ACPD
6, 9583–9602, 2006Mirror image hydrocarbons from Tropical and Boreal
forests J. Williams et al. Title Page Abstract Introduction Conclusions References Tables Figures J I J I Back Close
Full Screen / Esc
Printer-friendly Version Interactive Discussion 200 150 100 50 0 (+) - a - pinene (pptv) 3000 2500 2000 1500 1000 500 0 Isoprene (pptv) 200 150 100 50 0 (-) - a - pinene (pptv) CH3 H3C H3C CH3 H3C CH3
Fig. 6. Correlations of (−)-α-pinene and (+)-α-pinene with isoprene. The data presented were taken by aircraft over the forest between 0–2 km. The enantiomeric structures of (−)-α-pinene and (+)-α-pinene are inserted top left in each panel.